OMG (Oceans Melting Greenland)
Airborne Sensors
OMG (Oceans Melting Greenland) Airborne Mission of NASA
OMG: A Greenland-wide Experiment News and Features References
August 4, 2021: This week, NASA’s airborne Oceans Melting Greenland (OMG) mission begins its final survey of glaciers that flow from Greenland into the ocean. OMG is completing a six-year mission that is helping to answer how fast sea level is going to rise in the next five, 10, or 50 years. 1)
Greenland’s melting glaciers currently contribute more freshwater to sea level rise than any other source does. The glaciers are melting six or seven times faster today than they were only 25 years ago, and OMG is the first NASA mission to focus solely on what the ocean contributes to this ice loss. That’s a critical part of helping improve calculations of future melt rates so that coastal communities worldwide can take timely precautions to limit the damage from higher seas.
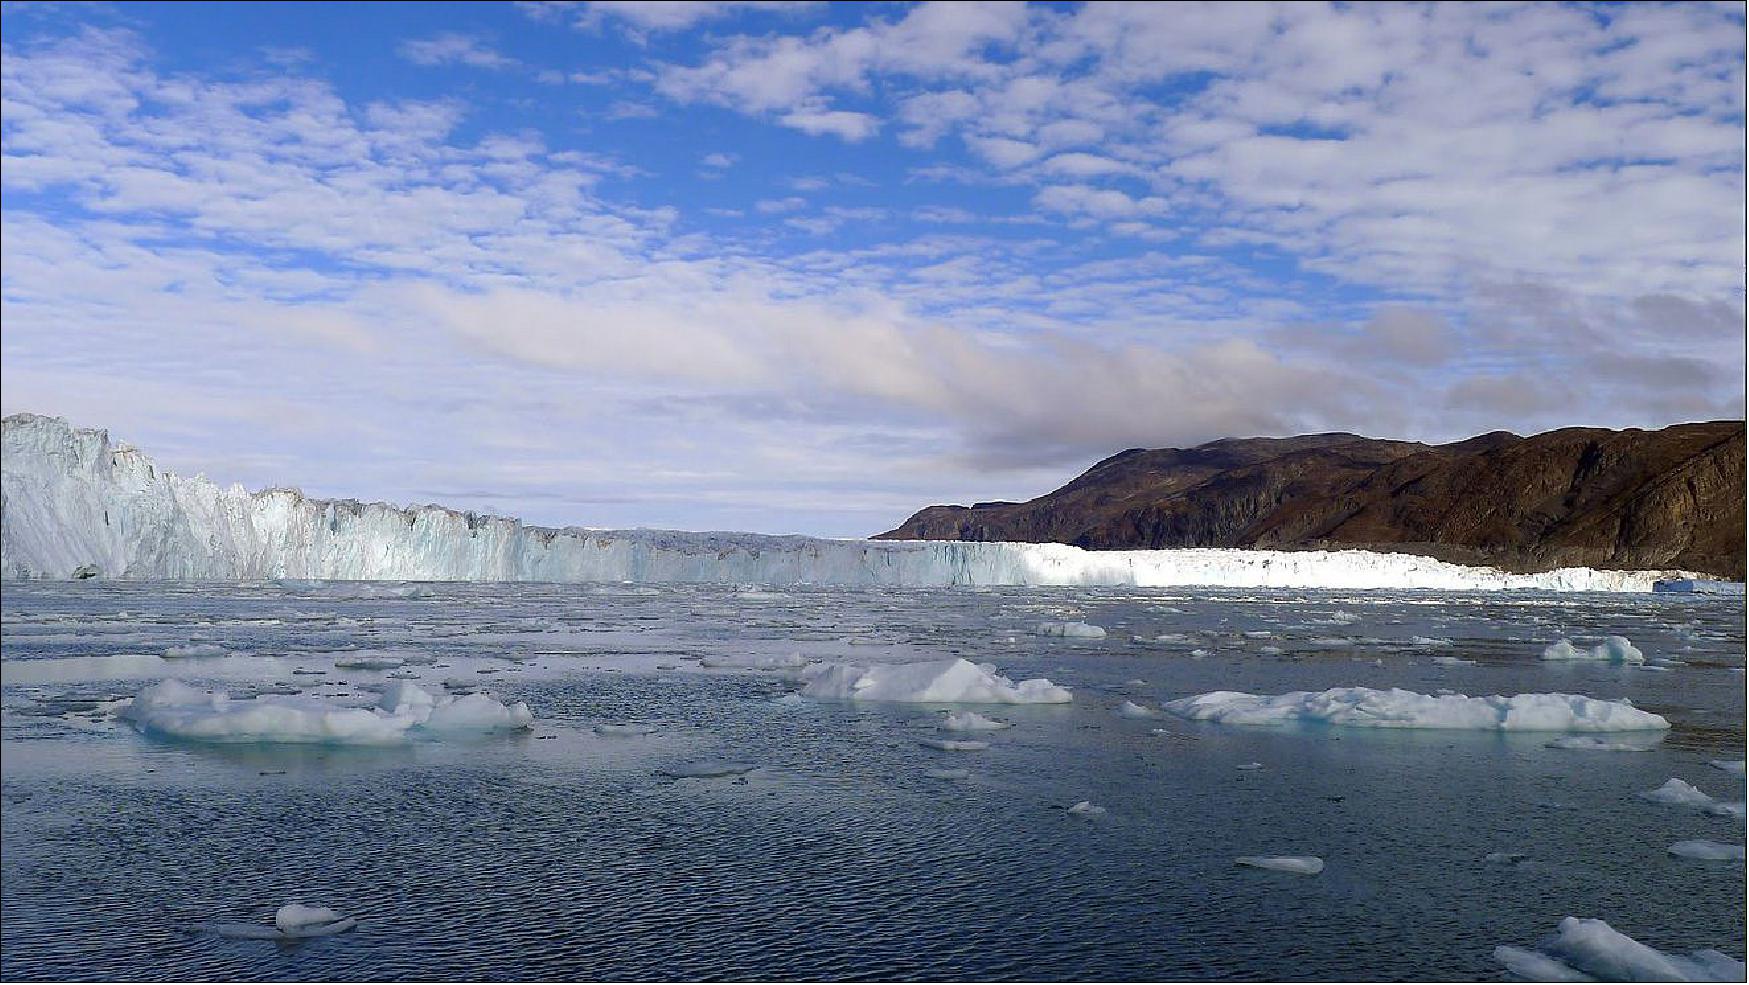
Ice melts faster in warmer water than it does in colder water, but before the OMG mission, the temperature of the ocean water touching Greenland’s more than 200 coastal glaciers was largely unknown. Simply measuring the temperature at the ocean surface isn’t enough. The upper layer of the ocean around Greenland consists largely of Arctic meltwater, and it’s very cold – sometimes even below freezing temperature. About 600 or 700 feet (200 meters) down is a layer of warmer, saltier water carried northward from less-frigid latitudes. Many glacier fronts extend down into the warmer-water zone, where they melt more rapidly.
No satellite instrument can peer deep into the ocean to measure temperature. The only way scientists have found to do that is to drop a probe into the water and let it sink. That’s what the OMG team has been doing every summer since 2016.
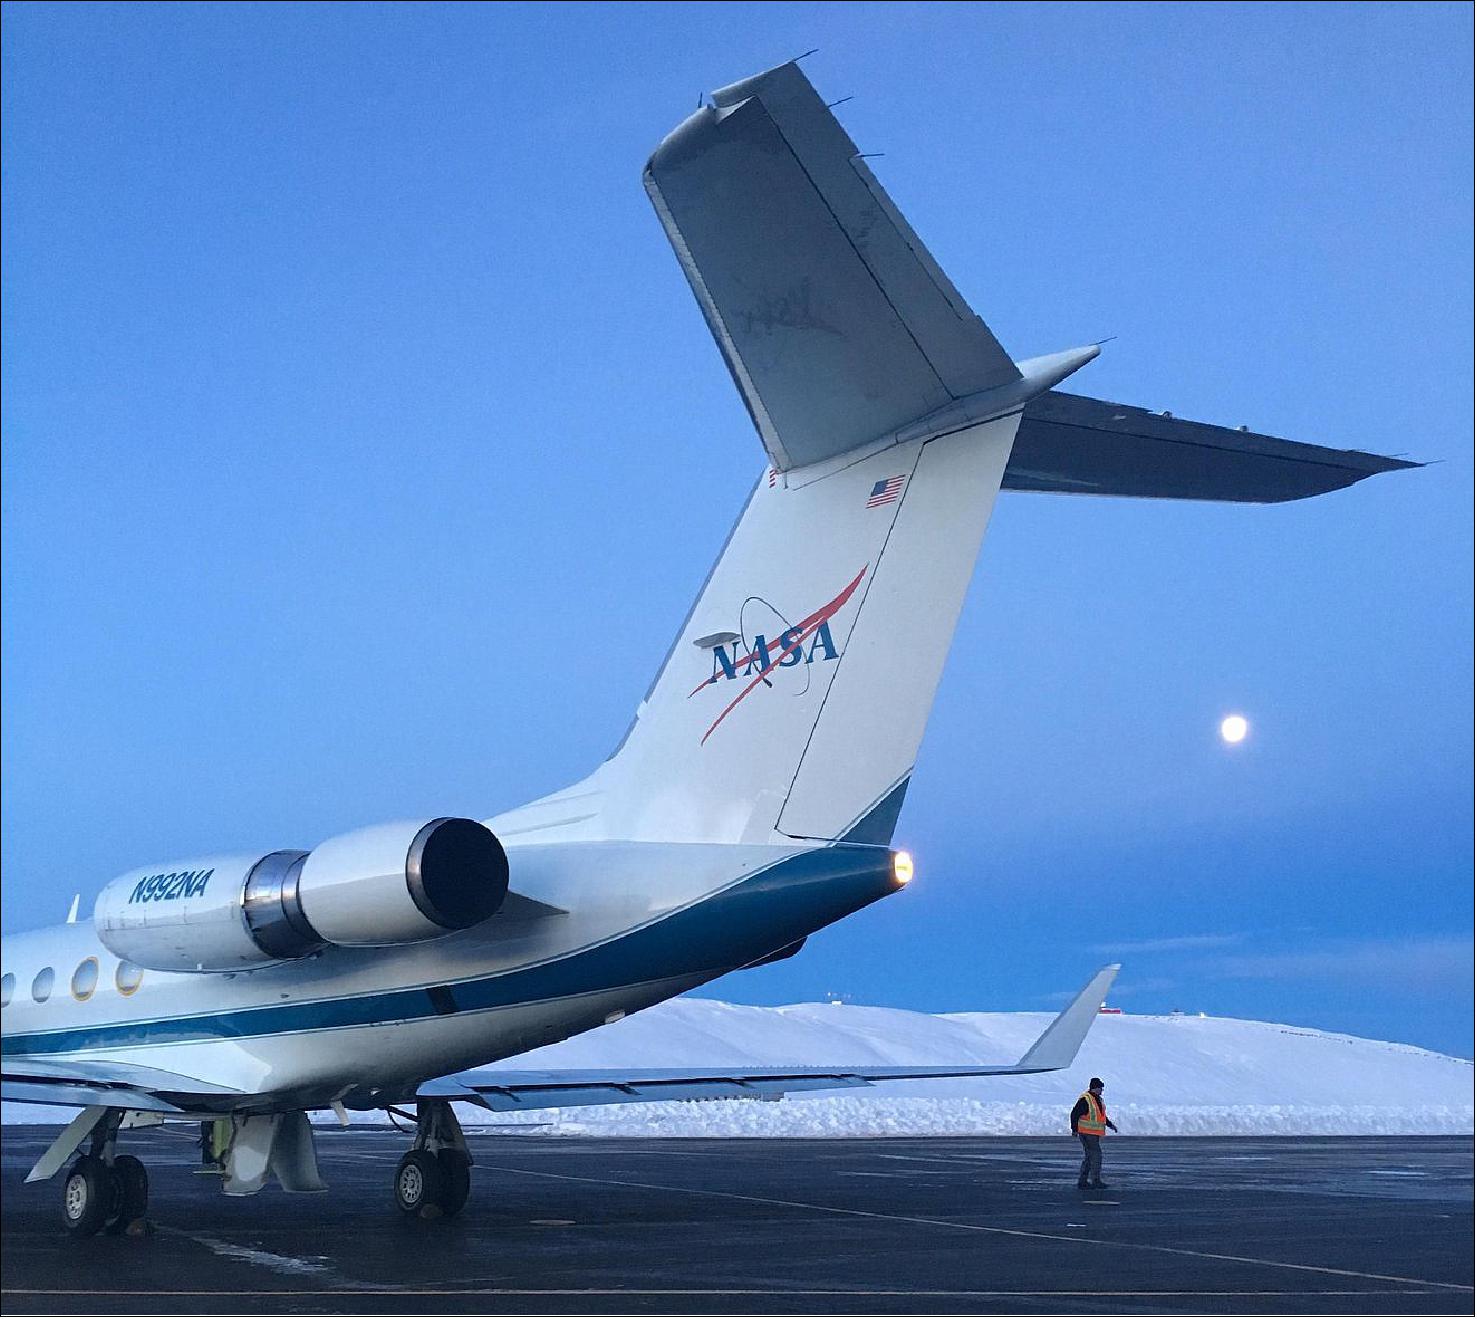
This year, Principal Investigator Josh Willis of NASA’s Jet Propulsion Laboratory in Southern California and OMG Project Manager Ian McCubbin, also of JPL, will fly around the entire coast of Greenland with a crew of pilot and engineers in a specially modified DC-3 aircraft. From early August through early or mid-September, they’ll drop probes out of the belly of the plane into the ocean at about 300 target locations in front of glaciers. As the probes sink, they transmit temperature and salinity readings by radio waves to the plane overhead until they reach the ocean floor.
More Ocean Changes off Greenland's West Coast?
OMG’s five years of data – including other measurements, such as a survey of the topography of Greenland’s continental shelf – have already greatly improved researchers’ understanding of what the ocean is doing to Greenland’s ice sheet. To date, almost 60 research papers in multiple fields have used the data. But Willis is hoping to achieve at least one more objective with this year’s fieldwork, following up on a surprising observation last year.
Back in 2017, the team had documented a drop of more than 2.7º Fahrenheit (1.5º Celsius) in water temperature off Greenland’s west coast, which was most likely the result of natural ocean and atmospheric patterns that effectively “flip a switch” between warmer and cooler currents flowing along the coast.
Since the switch may stay in the same position for decades, the OMG scientists felt lucky to observe the dramatic change – especially when they saw how it affected Greenland’s largest glacier, Jakobshavn (also called Sermeq Kujalleq). The glacier had been shrinking rapidly and retreating almost 2 miles (3 km) inland annually. But the colder water revived Jakobshavn; it began to grow and advance toward the ocean.
In 2020, the OMG team found that warm water was beginning to return to Greenland’s west coast, and Jakobshavn appeared to be returning to its previous pattern of loss and retreat. The team knew there was more to discover. “With one more year of observations, we may have the opportunity to see the ocean change in a dramatic way and see how the ice is reacting to it,” said Willis.
“It was a fortunate opportunity for NASA to observe a rare phenomenon around Greenland as the North Atlantic Ocean was undergoing a shift towards colder waters after being in a warm phase for nearly 20 years,” said Nadya Vinogradova-Shiffer, OMG program scientists at NASA, who is planning to join the team during its final campaign in Greenland this year. “Capturing this reversal in real time is giving us new insights into the complex physics of ocean-ice coupling, which is crucial to improve NASA’s projections of future sea level rise.”
If the OMG team does find a warming event under way that’s comparable in scope to the 2017 cooling event, Willis says it would 'provide a good handle on how the oceans are driving the ice changes in West Greenland', which is what OMG is about. “One thing about airborne science in a place like Greenland is that we really don’t know until we get there what we’re going to find,” Willis said.
Background: A Greenland-wide Experiment
Melting of the Greenland Ice Sheet represents a major uncertainty in projecting future rates of global sea level rise. Much of this uncertainty is related to a lack of knowledge about subsurface ocean hydrographic properties, particularly heat content, how these properties are modified across the continental shelf, and about the extent to which the ocean interacts with glaciers. Early results from NASA’s five-year Oceans Melting Greenland (OMG) mission, based on extensive hydrographic and bathymetric surveys, suggest that many glaciers terminate in deep water and are hence vulnerable to increased melting due to ocean-ice interaction. OMG will track ocean conditions and ice loss at glaciers around Greenland through the year 2020, providing critical information about ocean-driven Greenland ice mass loss in a warming climate.
The OMG mission is guided by the overarching science question: To what extent is the ocean melting Greenland’s glaciers from below? To address this question, the mission formulated the following approach: 2)
1) Observe the year-to-year changes in the temperature, volume, and extent of warm, salty Atlantic Water on the continental shelf.
2) Observe the year-to-year changes in the extent and height of all marine-terminating glaciers.
3) Observe submarine topography (bathymetry) to reveal the complex network of underwater troughs and canyons connecting glacial fjords with the continental shelf.
4) Investigate the relationship between the observed variations in Atlantic Water properties and glacier extent and height.
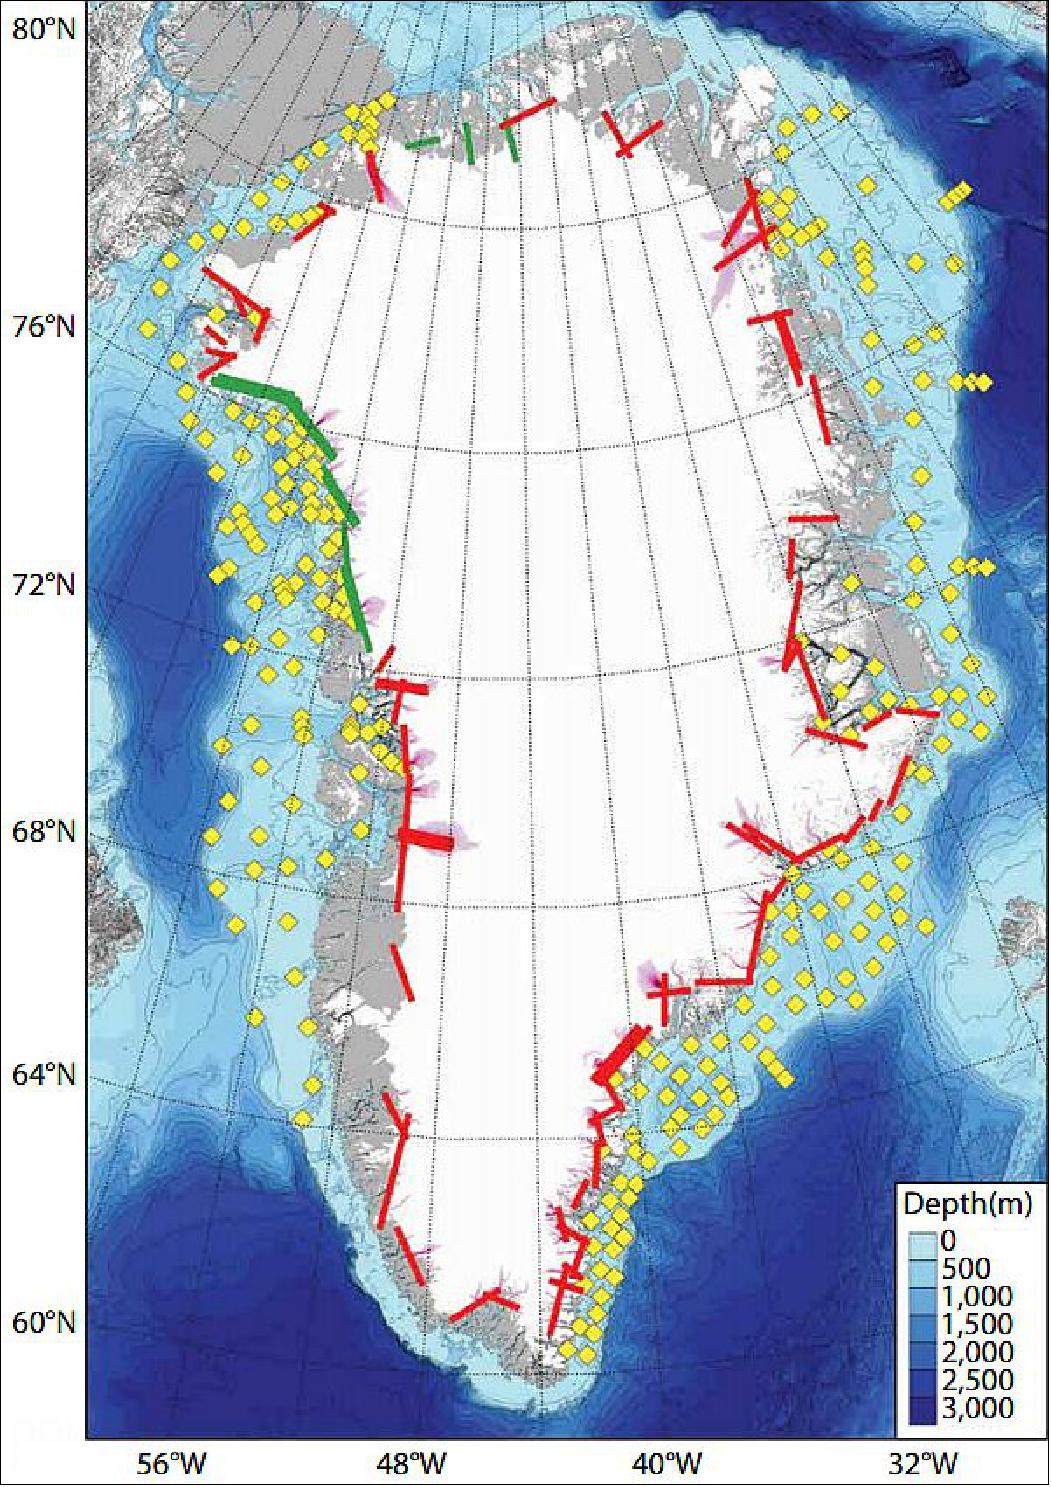
Airborne eXpendable conductivity, temperature, and depth (AXCTD) surveys will be conducted in September of each year to observe interannual variations in the hydrographic properties of Atlantic Water on the shelf, and an interferometric radar will provide annual measurements of the extent and height of marine-terminating glaciers. Bathymetric observations will be made using ship-based sonars and airborne gravimetry. Statistical analysis of these data and a suite of variable-resolution data-assimilating ocean general circulation models will be utilized to make new quantitative estimates of ice sheet mass loss as a function of ocean warming.
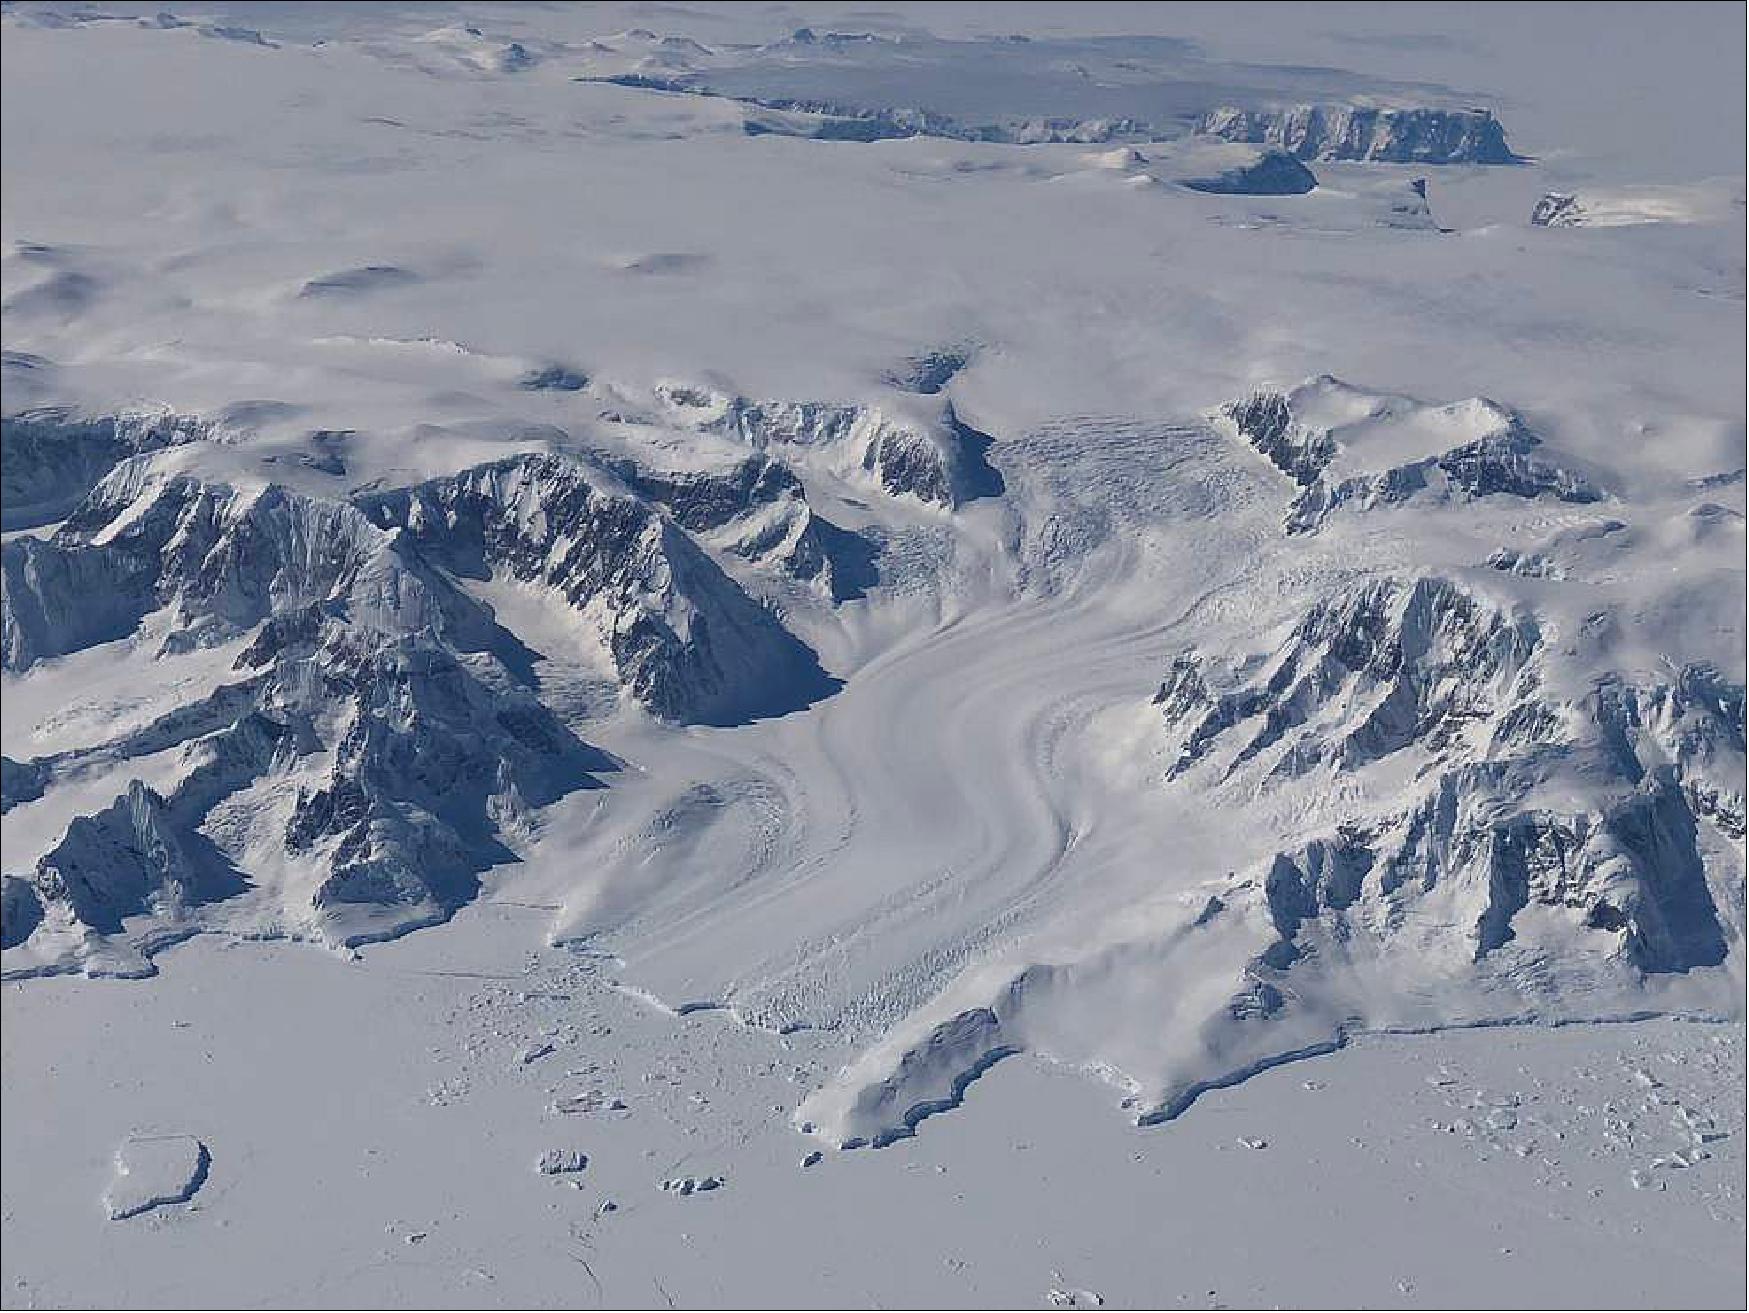
Greenland's Glaciers
The Greenland Ice Sheet has more than 200 land-terminating and marine-terminating outlet glaciers that drain ice from its interior outward toward the coast. The southeast, west, and northwest sectors of the ice sheet are characterized by marine-terminating glaciers without significant floating ice tongues. The few marine-terminating glaciers with floating extensions longer than a few kilometers are found in North and Northeast Greenland. The southwest sector of the ice sheet is predominantly drained by slow-moving, land-terminating glaciers. The flow of marine-terminating glaciers has been shown to be highly sensitive to changes in ocean temperature and circulation. Following a sufficiently large increase in submarine melt rate, a glacier can exhibit dynamic destabilization that triggers a rapid flow acceleration, thinning, or retreat until a new, dynamically stable geometric configuration is achieved (Meier and Post, 1987). Exactly how any individual glacier responds to submarine melt rate perturbations depends on several factors, including fjord and bedrock geometry, bed composition, ice rheology, and subglacial water transport (Nick et al., 2009; Rignot et al., 2016a,b). In general, ocean-induced ice flow acceleration and dynamic thinning are greatest in the vicinity of glacier termini where ice flow is concentrated in narrow fjords.
The ice element of OMG consists of annual surveys of glacier surface elevation (OMG, 2016b) using NASA’s high-resolution airborne Glacier and Ice Surface Topography Interferometer, GLISTIN-A. OMG uses the GLISTIN radar to map the entire periphery of the Greenland Ice Sheet where glaciers terminate in the ocean. The first survey, conducted in March 2016, provides a baseline against which future changes in glacier surface topography will be determined.
Repeat measurements of four parameters are commonly assessed to quantify glacier changes: surface elevation, frontal position, ice flow velocity, and ice mass (gravity). Of these four parameters, GLISTIN directly measures two, changes in surface elevation and changes in frontal position. Changes in glacier mass can be inferred by combining GLISTIN ice elevation and frontal change measurements with estimates of changes in the firn (granular snow) air content of the ice column.
Installed on a NASA G-III (Gulfstream III Research Testbed) aircraft, the GLISTIN Ka-band radar returns surface elevation data in 10–12 km wide swaths bounded within its 15°–50° off-nadir look angle range. GLISTIN can achieve a 20 cm vertical precision at a horizontal resolution of 3 m in the near range (15° off-nadir) and 38 m in the far range (50° off-nadir), independent of cloud conditions or solar illumination.
GLISTIN’s systematic errors from volume scattering average about 30 cm under dry snow conditions . We anticipate that the effect of systematic errors on estimates of interannual surface elevation change may be somewhat mitigated because systematic errors could largely cancel after differencing observations collected at the same time of year. Comparisons between coincident or nearly coincident surface elevations measured by GLISTIN and NASA’s Airborne Topographic Mapper laser altimeter flown during Operation IceBridge will be made to refine GLISTIN uncertainty estimates.
To maximize the radar energy backscatter, GLISTIN campaigns are flown in late winter before the onset of the spring melt season, as dry frozen surfaces are more reflective than wet melting surfaces. Opting for GLISTIN involved compromising among spatial coverage, spatial resolution, and vertical precision to achieve the mission requirement of observing highly heterogeneous surface elevation changes along the ice sheet periphery. GLISTIN’s lower vertical accuracy relative to laser altimetry is offset by its significantly wider swath, higher spatial resolution, and insensitivity to cloud conditions and solar illumination.
Final calibration of GLISTIN elevation maps will use stationary targets such as rocky outcroppings and near-stationary targets such as slowly changing ice surfaces wherever possible. Fortuitously, elevation data from suitable calibration targets are abundant, thanks to Airborne Topographic Mapper campaigns.
As the orientation of glacier flow lines vary and the spatial distribution of front locations is complex, defining straight radar flight lines to map multiple glaciers in a single swath requires trade-offs. Glaciers are prioritized by considering ice volume discharge, retreat/advance history, and proximity to other glaciers with dissimilar retreat and advance histories. The highest priority is assigned to retreating and thinning glaciers with large volume discharges that are proximate to glaciers with dissimilar retreat patterns. A small number of the highest priority glaciers are allocated multiple parallel lines (e.g., Jakobshavn Isbræ) or overlapping perpendicular lines near their termini (e.g., Zachariæ Isstrøm and 79N).
The GLISTIN survey plan captures nearly all of Greenland’s marine-terminating glaciers in 82 swaths with an average length of 103 km covering ~85,000 km2.
The OMG airborne bathymetry survey (OMG, 2016d) is accomplished using the AIRGRAV gravimeter owned and operated by Sander Geophysics Ltd (SGL). AIRGRAV has three orthogonal accelerometers mounted on a three-axis gyro-stabilized Schuler-tuned inertial platform installed in the cabin of a Twin Otter aircraft. Precision positioning of the aircraft is determined through dual frequency GPS and differential GPS.
Free-air gravity anomalies measured by AIRGRAV arise from variations in mass beneath the aircraft. A major component of the mass signal comprises the changing proportion of seawater to rock beneath the aircraft as the seafloor depth varies. Seafloor depth can be inferred by inverting the observed gravity anomalies. An accurate inversion of seafloor depth from gravity data requires knowledge of the spatially varying seafloor density. For this mission, seafloor density is estimated using ground-truth sonar data and prior geological findings about the composition of Greenland’s shelf.
AIRGRAV survey regions correspond to the unmapped areas of the inner to mid shelves in the northwest, southeast, and northeast sectors. Logistical challenges precluded a complementary sonar survey in the northeast sector around Zachariæ Isstrøm and 79N, neighboring glaciers with dissimilar dynamical behaviors. The AIRGRAV survey consisted of multiple parallel alongshore flight lines separated by 2 km near the coast and 4 km further offshore. This flight line spacing strategy allowed a considerable fraction of the data-poor shelf to be mapped while also ensuring that the resolution of the near-shore bathymetry was adequate for merging with the sonar data.
News and Features
• January 26, 2022: NASA Greenland Mission Completes Six Years of Mapping Unknown Terrain. - The most important thing to remember about NASA’s Oceans Melting Greenland mission, which ended Dec. 31, 2021, may be its name: OMG proved that ocean water is melting Greenland’s glaciers at least as much as warm air is melting them from above. Because ice loss from Greenland’s ice sheet currently contributes more to the global rise of the oceans than any other single source, this finding has revolutionized scientists’ understanding of the pace of sea level rise in the coming decades. 3)
- These new, unique measurements have clarified the likely progress of future ice loss in a place where glaciers are melting six or seven times faster today than they were only 25 years ago. If all of Greenland’s ice sheet were to melt, global sea levels would rise by about 24 feet (7.4 meters).
- But that’s just the tip of the iceberg in the story of this small plane- and boat-based mission. In six years of operations, OMG made the first scientific measurements along many miles of the most remote coastline in the Northern Hemisphere. The mission performed the most complete survey of the seafloor around Greenland’s coastline, including dozens of previously uncharted fjords (cliff-lined inlets clogged with icebergs from disintegrating glaciers), and measured how the ocean temperature changed from place to place, year to year, and top to bottom. To get this unique dataset, mission planes logged enough air miles around and over Greenland to circle the globe more than 13 times.
Airports in Greenland, Iceland, and Norway served as bases for research flights. Credit: NASA/JPL-Caltech.
Preparation
- More than 220 glaciers flow from Greenland into the ocean. Before OMG, scientists figured the ocean water swirling around and under these glaciers had to be contributing to their ice loss. But how much?
- Satellite observations of sea surface temperature weren’t much help in answering that question. Around Greenland, the top layer of the ocean is extremely cold and not very salty, containing a lot of water from the Arctic, the freshest of oceans. A shallow glacier that only touches this layer melts slowly. But hundreds of feet below, the ocean is warmer and saltier. A deep-seated glacier is eaten away by the warmer water, losing ice four or five times as fast as a shallow one.
- The only way to find out any glacier’s risk is to go to Greenland and measure the glacier and the seafloor and water in front of it. Scientists had been studying individual glaciers that way for years, but Josh Willis, principal investigator of OMG at NASA’s Jet Propulsion Laboratory in Southern California, wanted to get the complete picture: to measure all 220-plus glaciers for five years – the length of time available to missions funded by NASA’s Earth Ventures airborne research program.
- “When we started to design OMG, we asked ourselves, ‘Can we do an experiment in five years that will tell us about the next 50?’” Willis said. Results have proved that they could. NASA even allowed them a sixth year of fieldwork to observe unexpected, rapid swings in water temperatures off Greenland’s west coast.
Operation
- The mission’s first job was to map the seafloor around the island to see where deep, warm water can reach glaciers. A contractor completed most of the mapping using a research boat, and OMG Deputy Principal Investigator Eric Rignot of JPL and the University of California, Irvine led smaller surveys in following years to fill in missing sections.
- To measure the ocean temperature and salinity down to the seafloor, Willis ran a summer airborne campaign that dropped about 250 probes each year into the ocean at strategic locations around the entire coastline. Six summers of flying over the remote Arctic may sound more like an adventure than a research project, but, Willis said, “It’s only an adventure in retrospect. While you’re in it, you have your head down and you’re working as hard as you can.” For the scientists, the data streaming into their computer from the probes was excitement enough.
- The detailed maps and temperature data collected by OMG show that two to four times as many glaciers sit in water that is several degrees warmer than previously thought and, thus, are at higher risk than anyone knew. Researchers understood that about a third of Greenland’s glaciers account for half of its ice loss; OMG found that all of these culprits reach down into warm water. Climate models that don’t account for the warm water’s effects underestimate glacial ice loss by at least a factor of two – in other words, missing half the sea level rise from this source.
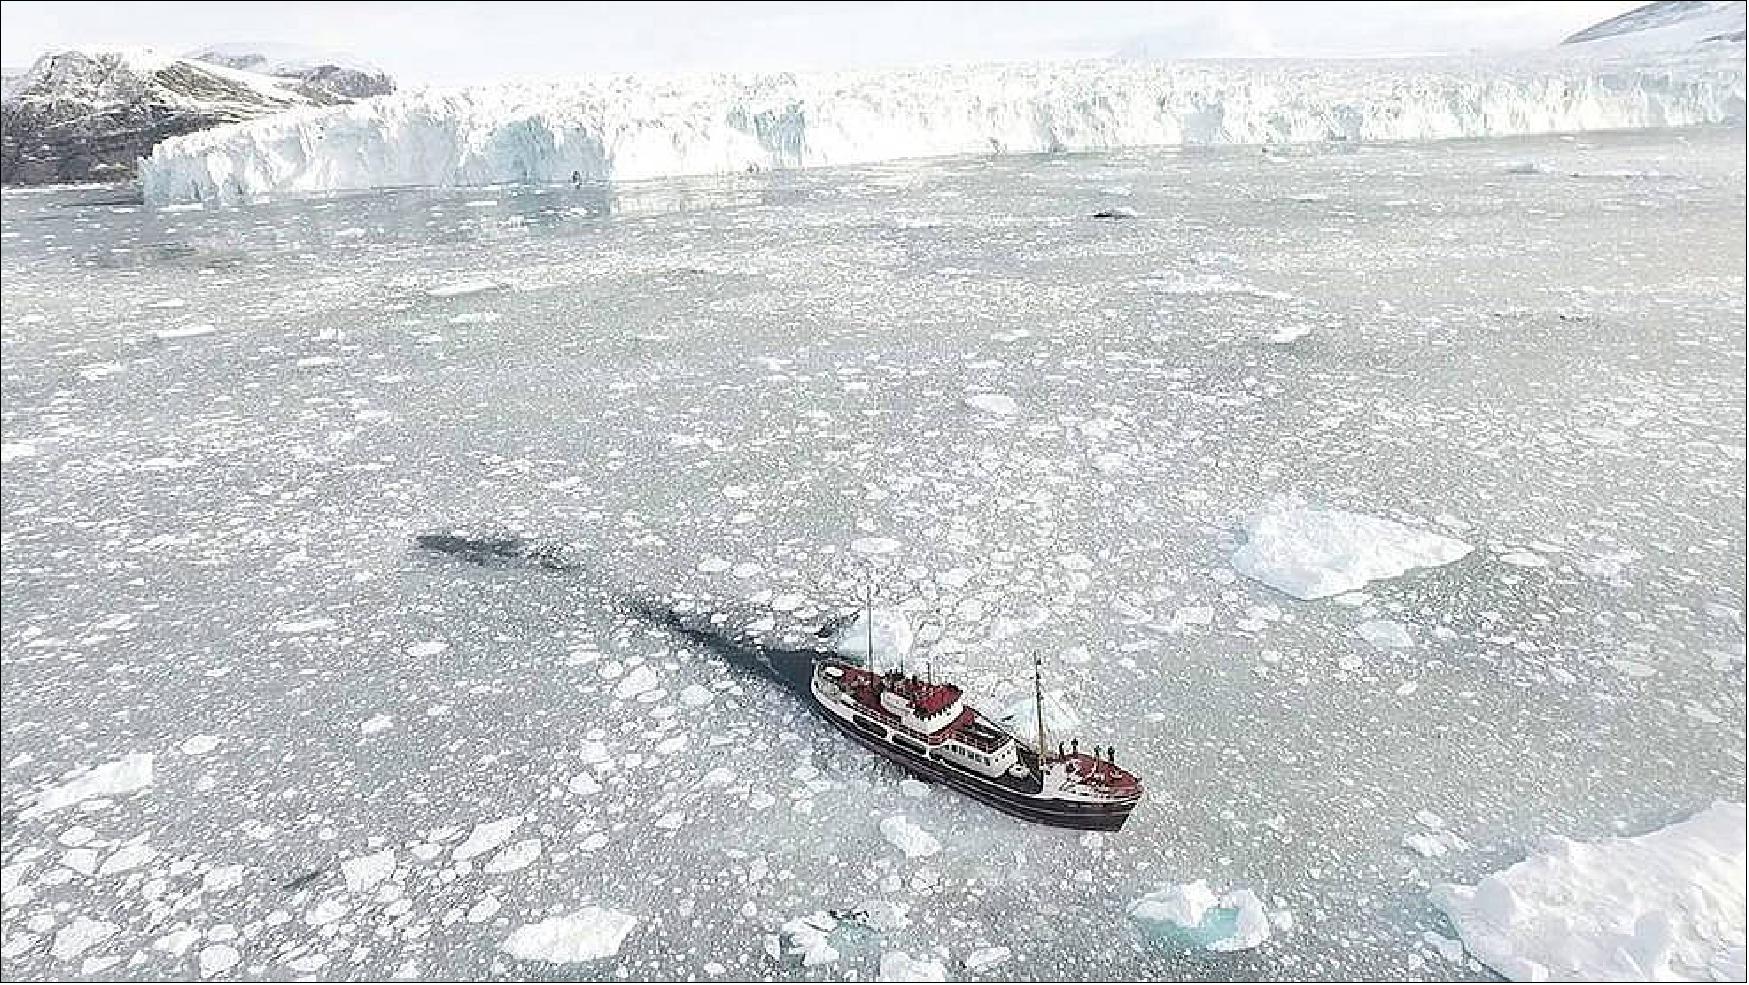
Collaboration
- OMG’s groundbreaking data has influenced many kinds of Arctic studies besides oceanography. For example, Kristin Laidre of the University of Washington is an internationally known expert on narwhals, Arctic whales with a tusk-like protruding tooth. She and Ian Fenty, an OMG co-principal investigator at JPL, developed a project that benefits both marine biologists and oceanographers: a research cruise to place OMG probes and acoustic sounders that record the presence of narwhals in front of West Greenland glaciers.
- The probe data provides a close-up view of how much ocean conditions can vary in a small area, and Laidre hopes that, in combination with the sounder data, it will help explain why certain glacier fronts are especially attractive to narwhals. “We biologists can get a better understanding of animals and populations by working with physical scientists,” she said, referring to the OMG team. “To have a group of scientists who want to collaborate is really great.”
Continuation
- The end of the mission doesn’t mean the end of all new data from the Greenland ocean. In 2021, the team dropped a few longer-lived probes in areas where changes in ocean temperatures or circulation are not fully understood. These probes “winter over” below the surface, continuing to bob up and down through the water to collect data that will be read remotely when the ice melts next summer.
- And scientists in many fields will continue to draw on OMG’s observations for their research. To date, about half of peer-reviewed journal articles using the data are written by researchers outside the mission’s science team – an unusually large portion. “We’re seeing a lot more science than we originally planned,” Willis said. “Those papers aren’t going to stop.”
• April 21, 2021: Everything on our planet — the land, the water, the air, people — is connected by the various chemical, physical and biological processes that make up what we call the Earth system. 4)
- One of the key components of that huge system is the cryosphere, or all of Earth’s frozen water. This important “sphere” includes frozen soils in Alaska, the snow on top of the Himalayas, as well as all the ice in the polar regions.
- Nowhere is the role of the cryosphere as evident as it is at high latitudes, where the Greenland and Antarctic ice sheets cover most of the land, and where sea ice caps enormous sections of the polar waters. The vastness of that bright, white ice — in addition to the huge areas covered by winter snow beyond polar regions — helps control the global climate by reflecting some of the Sun’s radiation back into space.
- Because of the importance of the cryosphere, NASA is committed to studying Earth’s ice extensively. With the recently decommissioned Gravity Recovery and Climate Experiment satellite mission, and its successor, GRACE Follow-On, scientists have studied changes in ice sheet mass balance. The missions have measured variations in Earth’s gravitational pull in response to surface mass and water changes.
- For more than a decade, Operation IceBridge took to the skies to survey the Arctic, Antarctica and Alaska. With more than 1,000 flights completed, scientists and engineers gathered data on the height, depth, thickness, and flow of sea ice, glaciers and ice sheets.
- IceBridge ended officially in 2021, but its legacy will live through the hundreds of terabytes of data on land and sea ice collected since 2009. The mission collected an array of data to bridge the data gap between NASA’s two spaceborne laser altimeters built for studying the cryosphere, the Ice, Cloud, and land Elevation Satellites, or ICESat and ICESat-2.
- Last year, scientists using ICESat-2 reported dramatic ice sheet losses in Greenland and Antarctica. Equipped with the most advanced laser altimeters ever flown in space, the spacecraft enabled scientists to create elevation maps to measure the loss of ice with unprecedented detail.
- Between 2003 and 2019, the Greenland Ice Sheet lost an average of 200 gigatons of ice per year, the researchers concluded. Antarctica’s ice sheet lost an average of 118 gigatons of ice per year. The combined ice losses caused sea levels to rise by 0.55 inches (14 millimeters) over those 16 years.
- By studying changes observed between the ICESat and ICESat-2 missions, scientists also reported substantial thinning of Greenland’s coastal glaciers — another important aspect of the cryosphere that NASA scientists investigate.
- As part of NASA’s Oceans Melting Greenland mission, which surveys glaciers with aircraft and ships, scientists want to gain a better understanding of how ocean warming affects coastal glaciers. Greenland’s melting glaciers are a significant contributor to the rising sea levels that already pose concerns for coastal communities worldwide.
- In 2020, the mission's scientists completed an extensive survey of Greenland’s fjords and glaciers, shedding more light on the ways in which warming seas accelerate glacier retreat. Their research showed that warming ocean water in fjords erodes the base of glaciers, causing the ice above it to break away. Bigger glaciers melt faster because of that undercutting process, the scientists concluded.
- Scientists expect climate change to amplify the ocean warming and the undercutting of those Greenlandic glaciers. But the interaction between the ocean and other types of polar ice extends beyond glaciers.
- For example, last year NASA scientists found that rapid sea ice melt led to a more turbulent ocean current in the Arctic called the Beaufort Gyre. Like other currents in the world’s oceans, the Beaufort Gyre plays an important role in regulating massive exchanges of water around the globe with different temperatures and salinity. Through this process, known as the thermohaline circulation, ocean currents interact with the many other components of the Earth system to control temperatures across the globe.
- The NASA study, which included 12 years of satellite data, showed the gyre has gained a massive amount of cold fresh water since the 1990s. Because some of that fresh water is slowly picked up by another system of currents known as the Atlantic Meridional Overturning Circulation, the far-reaching effects of the changing currents could also influence the climate of Western Europe and North America.
- Even though the polar regions hold most of Earth’s ice, snowpacks and alpine glaciers at lower latitudes are important parts of ecosystems around the world. In mountain ranges such as the Sierra Nevada in California, snowpacks that release water gradually during warmer months serve as the primary source of drinking and irrigation water. This water also provides an important source of hydroelectric power.
- Alpine snow can be difficult to study with satellites from space, as snow cover often hides under forest canopy and other types of complex terrains. To complement satellite observations of snow in Western U.S. states, NASA’s SnowEx campaign has been surveying snowpacks since 2017. The campaign is an effort to characterize snow depth, density and other detailed properties of snow that scientists need to accurately estimate how much water will melt and flow into mountain streams, rivers and reservoirs.
- In order to expand these local measurements to global observations, scientists need to perform some complex calculations to combine airborne and ground observations of snow with satellite data. NASA funds efforts that help determine the best ways to combine observations from various satellites and study snow depending on ground conditions.
- Climate change can also influence the amount of fresh water available from melting winter snow. Where climate change results in less snow fall, droughts can follow in the warmer months. Additionally, changes in alpine glaciers and snow can also lead to natural hazards. As warming causes more precipitation in the form of rain instead of snow, water can overwhelm rivers and cause floods.
- To study vulnerability to flooding, landslides and other types of natural hazards, NASA’s High Mountain Asia Team is completing the most comprehensive ice and snow survey ever made of the region where mountain ranges such as the Himalayas, Karakoram and Hindu Kush provide fresh water for millions of people. There, glacial melt and changes in precipitation patterns have become more common. As meltwater lakes form on top of these glaciers, the surrounding glaciers can become unstable and eventually lead to lake bursting, flooding and debris flows downstream.
- By combining expertise about the cryosphere with field campaigns and an extensive fleet of operational and upcoming satellites, NASA and its partners can help communities worldwide to predict the effects of climate change and to potentially mitigate natural hazards and disasters that are deeply connected to our planet’s cryosphere.
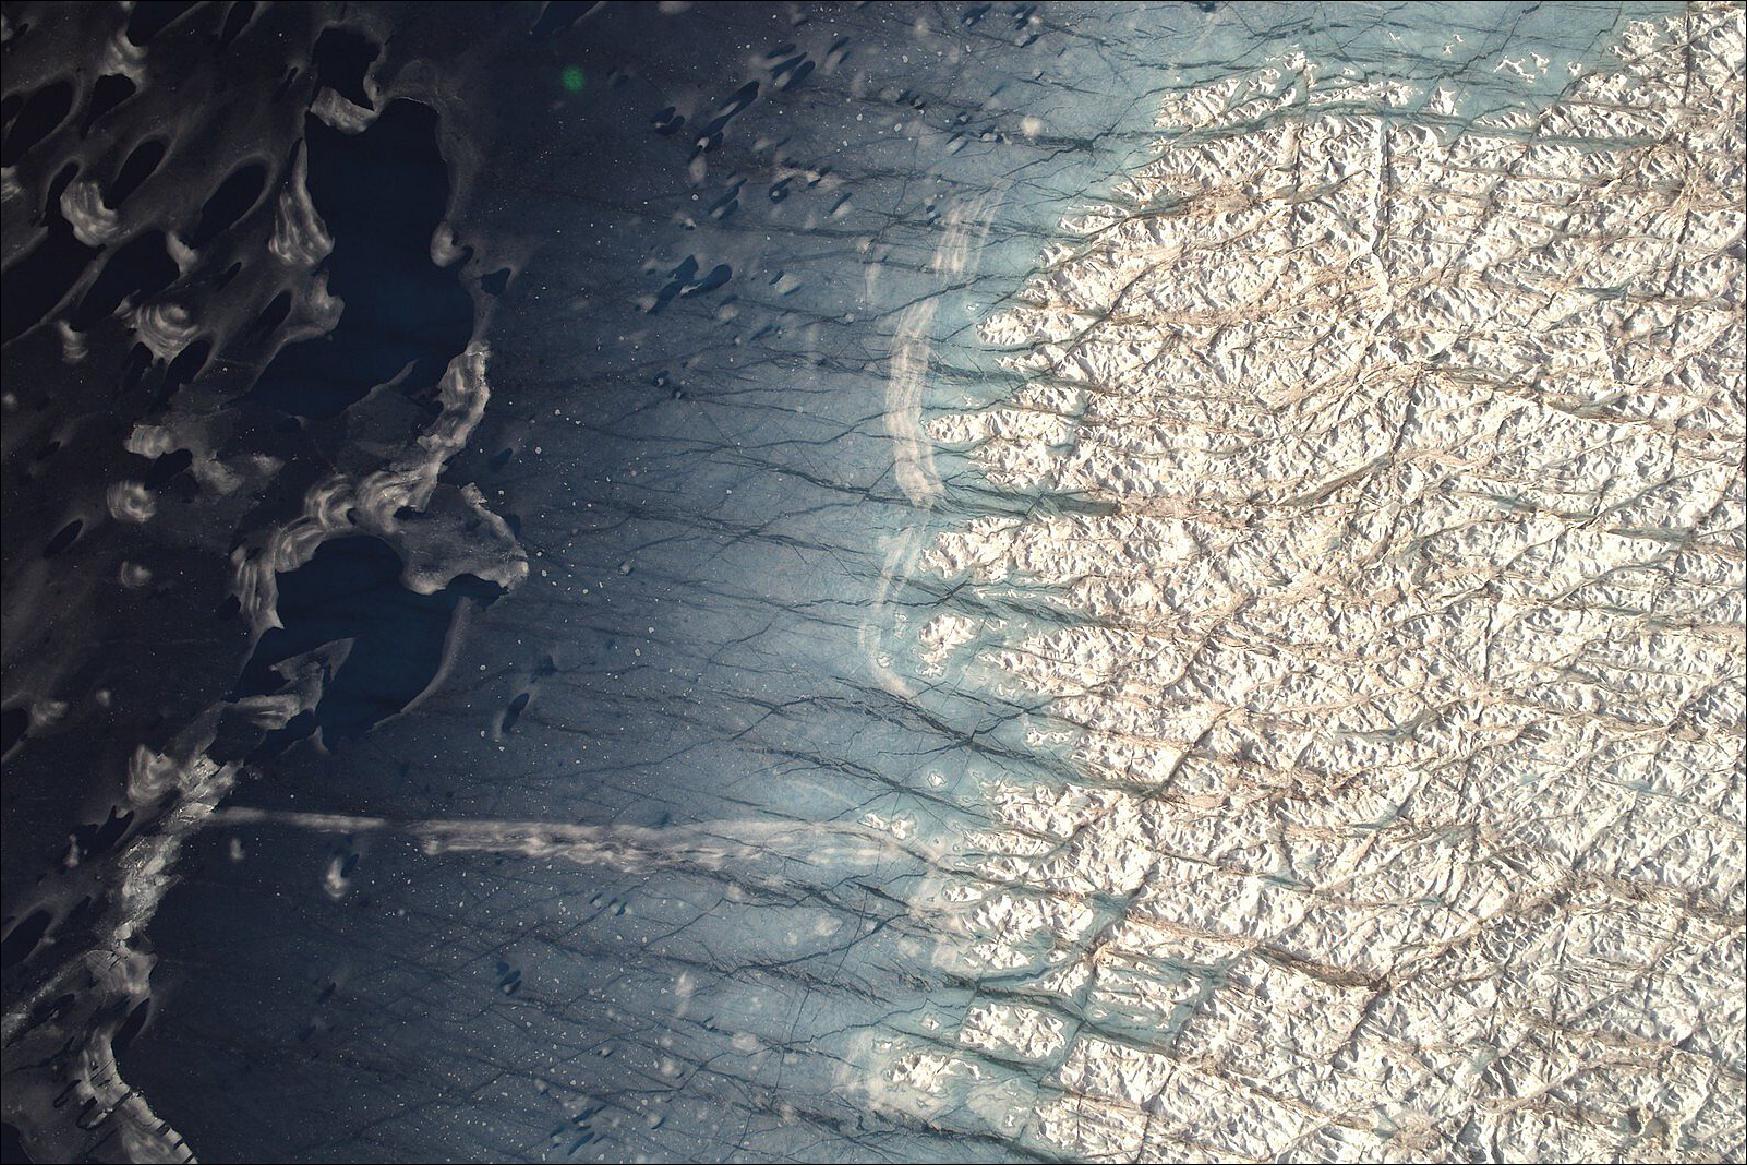
• April 5, 2021: With data from a 2016 expedition, scientists supported by NASA are shedding more light into the complex processes under the Greenland Ice Sheet that control how fast its glaciers slide toward the ocean and contribute to sea level rise. 5)
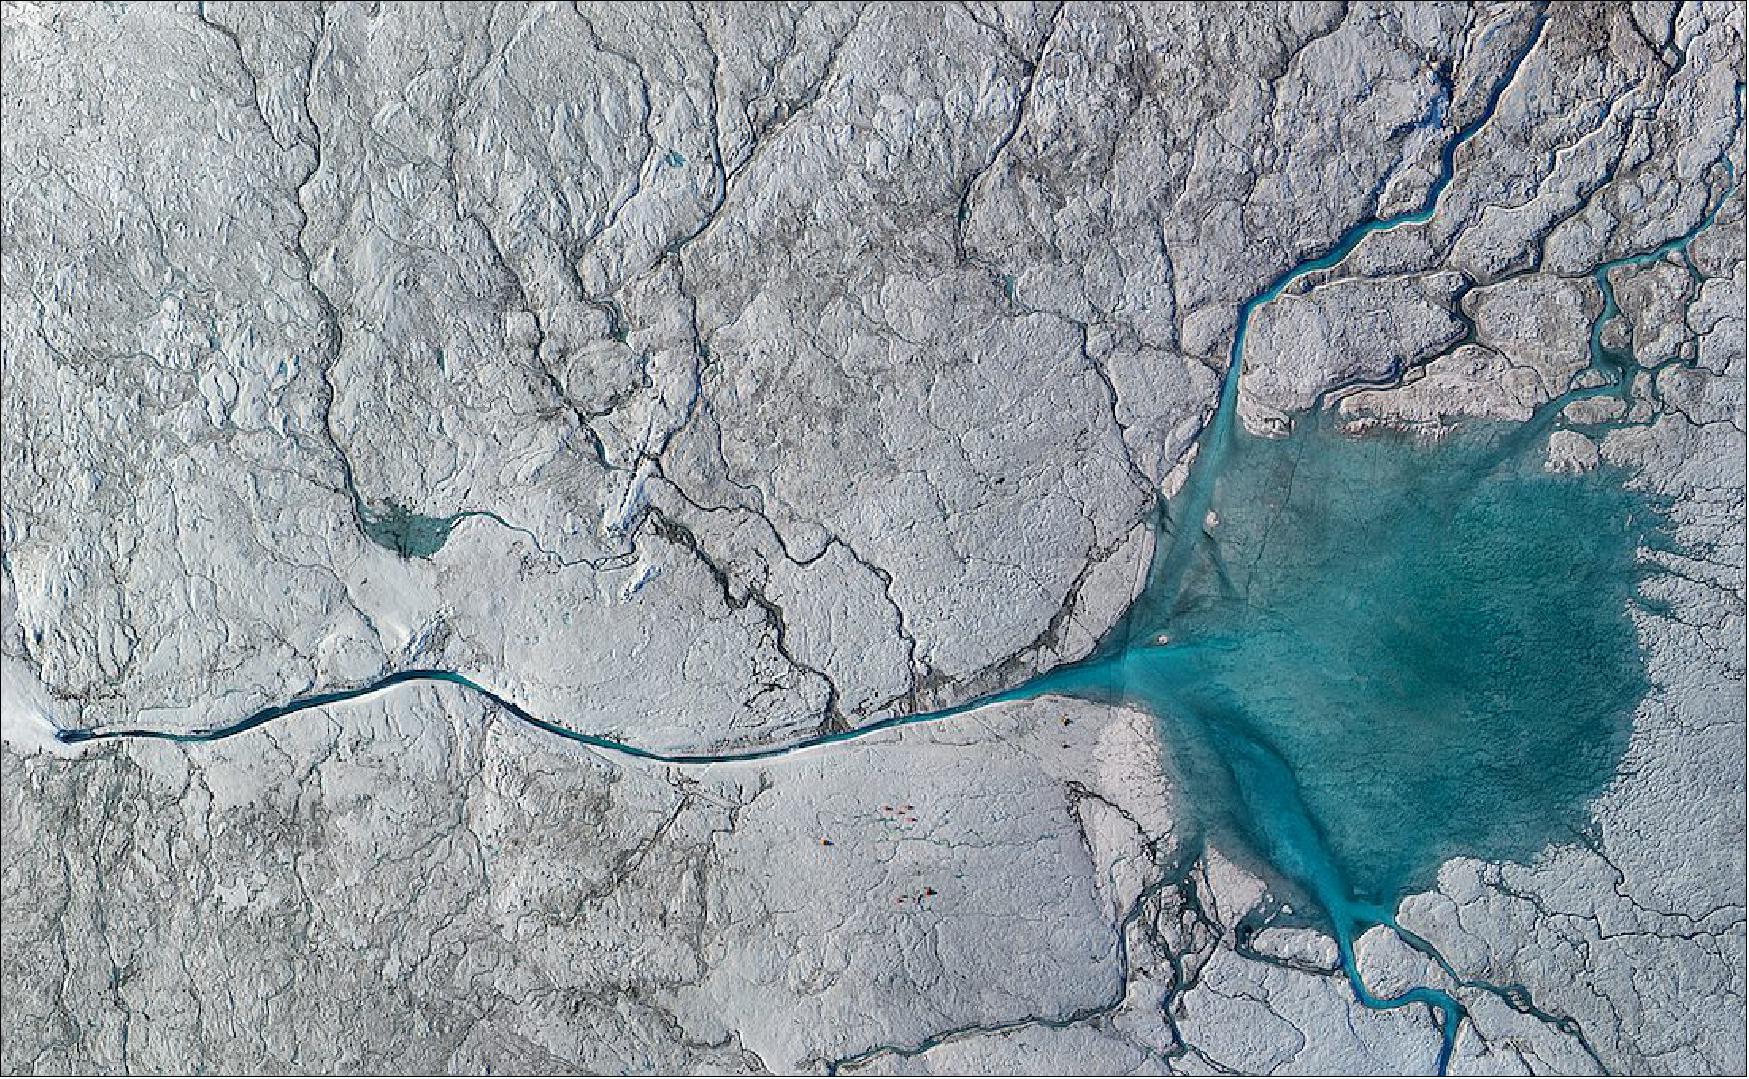
- On the surface of the ice sheet, bottomless sinkholes called moulins can funnel meltwater into the base of the ice. As that water reaches the ice sheet’s underlying bed, it can make the ice detach slightly and flow more rapidly.
- Glaciers that slide faster can eventually lead to the ice sheet melting a bit faster than expected, also increasing the amount of ice calved into the ocean. With a vast surface area roughly the size of Mexico, Greenland’s melting ice is the largest contributor to global sea level rise.
- In a new study, published April 5 in Geophysical Research Letters, the authors concluded that the one important factor influencing the speed of a sliding glacier in southwest Greenland was how quickly water pressure changed within cavities at the base of the ice, where meltwater met bedrock. 6)
- “Even if the cavities are small, as long as the pressure is ramping up very fast, they will make the ice slide faster,” said Dr. Laurence C. Smith, a professor of environmental studies and Earth, environmental, and planetary sciences at Brown University in Providence, Rhode Island.
- It’s the first time observations directly from field research show how changes in the volume of water under the Greenland Ice Sheet drive the flow velocities of a glacier.
- The findings contradict a long-held view about ice sliding velocities and water stored under a glacier known as steady-state basal sliding law, which has helped scientists predict how fast ice sheets will slide based on the total volume of water underneath the ice.
- Dr. Lauren Andrews, a glaciologist at NASA’s Goddard Space Flight Center in Greenbelt, Maryland, likes to explain the interactions between surface meltwater, basal ice, and the bedrock, as tires that slide very rapidly on a wet road because of hydroplaning.
- “If you have a rapid perturbation of water going into the subglacial system, you overwhelm the system, and so you create essentially a layer of water at the interface that's not contained in channels or cavities anymore,” Andrews said.
- It's not the actual volume in water that drives ice velocity, she explained, but the speed with which it builds up at a bedrock ice interface. For slow increases in water the subglacial system has time to evolve to accommodate the same amount of water.
- Until recently, the lack of data directly from the ground had made it difficult for scientists to probe the interactions that speed up glaciers in Greenland. One of the trickiest aspects preventing scientists from fully understanding ice sliding dynamics is the need to pair measurements of the flow of meltwater into a glacier with observations of the motion of the ice at the surface.
- The research team set camp on Russell Glacier near Kangerlussuaq, Greenland, and studied a glacial river named to honor the late NASA researcher Alberto Behar. By comparing GPS measurements of the motion of ice at the surface with the amount of meltwater discharging into a vertical shaft in the glacier, known as a moulin, as well as meltwater exiting the glacier’s edge, the team identified changes in water stored under the ice that corresponded with small accelerations in the ice at the surface. Past research on small alpine glaciers guided the design of the study.
- The new findings will be valuable for satellites such as the upcoming NISAR satellite mission, a joint Earth-observing mission between NASA and the Indian Space Research Organization (ISRO), which will measure changes in ice surface velocity with unprecedented resolution for the entire Greenland and Antarctic ice sheets, said Thorsten Markus, Cryospheric Science program manager at NASA. Projected to launch no earlier than 2022, NISAR may also enable further studies of ice surface velocities at much larger scales.
- Eventually, combining satellite observations with data acquired from the ground can help scientists as they consider adjusting their models to represent the hydrology at the base of ice sheets more accurately.
- Integrating new data in models is a gradual process, but Smith hopes the new findings can improve how climate models predict the pace of future sea level rise from Greenland’s ice in the face of climate change.
- “The only tools that we have to predict the future are models,” Smith said. “We have remote sensing, and we have field campaigns, so if we can use both to improve our modeling capability, we'll be better able to adapt and mitigate sea level rise and climate change.”
- The fieldwork is one of many projects NASA has supported over the last two decades to interpret satellite observations and study the Greenland Ice Sheet using local field data.
• January 25, 2021: Greenland’s melting glaciers, which plunge into Arctic waters via steep-sided inlets, or fjords, are among the main contributors to global sea level rise in response to climate change. Gaining a better understanding of how warming ocean water affects these glaciers will help improve predictions of their fate. Such predictions could in turn be used by communities around the world to better prepare for flooding and mitigate coastal ecosystem damage. 7)
- But researchers have long lacked measurements of the depths of the fjords along Greenland’s craggy coast. Without this information, it’s extremely difficult to arrive at a precise assessment of how much ocean water is being allowed into the fjords and how that affects glacier melt. By measuring their fjords one by one, a new study published in Science Advances has quantified, for the first time, how the warming coastal waters are impacting Greenland’s glaciers.
- For the past five years, scientists with the Oceans Melting Greenland (OMG) mission have been studying these marine-terminating glaciers from the air and by ship. They found that of the 226 glaciers surveyed, 74 in deep fjords accounted for nearly half of the total ice loss (as previously monitored by satellites) from Greenland between 1992 and 2017. These glaciers exhibited the most undercutting, which is when a layer of warm, salty water at the bottom of a fjord melts the base of a glacier, causing the ice above to break apart. In contrast, the 51 glaciers that extend into shallow fjords or onto shallow ridges experienced the least undercutting and contributed only 15% of the total ice loss.
- “I was surprised by how lopsided these findings were. The biggest and deepest glaciers are undercut much faster than the smaller glaciers in shallow water,” said lead author Michael Wood, a post-doctoral researcher at NASA’s Jet Propulsion Laboratory in Southern California, who began this research as a doctoral student at the University of California, Irvine. “In other words, the biggest glaciers are the most sensitive to the warming waters, and those are the ones really driving Greenland’s ice loss.”
- In the case of Greenland’s glaciers, the bigger they are, the faster they melt. And the culprit is the depth of the fjord they occupy: Deeper fjords allow in more warm ocean water than shallow fjords, hastening the undercutting process.
Undercutting and Calving
- Greenland is home to one of Earth’s only two ice sheets. The ice there is over 2 miles (3 km) thick in places. At the edges of Greenland, the vast glaciers extending from the ice sheet travel slowly down valleys like icy conveyor belts, which pour into the fjords and then melt or break off (or calve) as icebergs. The ice is replenished by snowfall that is compressed over time into the ice pack.
- If the ice sheet were in balance, the amount of snow accumulating on the top would roughly equal the ice lost from melt, evaporation, and calving. But previous observations have shown that the ice sheet has been out of balance since the 1990’s: Melt has accelerated and calving has increased. In other words, the rate of ice being lost to the ocean is exceeding the supply from the ice sheet. This is causing the ice sheet to shrink and the glaciers to retreat toward land.
- The main cause of such glacier retreat is the process of undercutting, which is driven by two factors: the amount of meltwater flowing from the glacier and the warm layer of salty water at the base of the fjord. During the summer months, increasing air temperatures heat the glacier’s surface, creating pools of meltwater. These pools leak through the ice and flow from the glacier in rivers below the surface. As the meltwater flows into the sea, it encounters the warmer salty water at the bottom of the fjord.
- Glacial meltwater doesn’t contain salt, so it is less dense than saltwater and thus rises as a plume. The plume drags the warmer ocean water into contact with the glacier’s base. The amount of undercutting depends on the depth of the fjord, the warmth of the ocean water, and the amount of meltwater flowing out from beneath the glacier. As the climate warms, the amount of meltwater will increase and the ocean temperature will rise, two factors that boost the undercutting process (Figure 2) .
- These findings suggest that climate models may underestimate glacial ice loss by at least a factor of two if they don’t account for undercutting by a warm ocean.
- The study also lends insight into why many of Greenland’s glaciers never recovered after an abrupt warming of ocean water between 1998 and 2007, in which ocean temperature increased by nearly 2º Celsius. Although ocean warming paused between 2008 and 2017, the glaciers had already experienced such extreme undercutting in the previous decade that they continued to retreat at an accelerated rate.
- “We have known for well over a decade that the warmer ocean plays a major role in the evolution of Greenland glaciers,” said OMG Deputy Principal Investigator Eric Rignot of UCI and JPL, which manages the mission. “But for the first time, we have been able to quantify the undercutting effect and demonstrate its dominant impact on the glacier retreat over the past 20 years.”
Into the Icy Depths
- Now in its sixth year, the OMG mission has carried out the mammoth task of measuring ocean temperature and salinity around the entire coast of Greenland. Each summer since 2016, the team has spent several weeks dropping between 250 and 300 probes from an aircraft to measure how water temperature and salinity change with depth while mapping the depth of otherwise-inaccessible fjords.
- This data complements other surveys of the region – including OMG measurements via boat (which began in 2015) and observational data collected from the Landsat satellites from NASA and the U.S. Geologic Survey – and builds on a growing body of glacier research on ice-ocean interactions. During this time, the OMG team has been able to gain a detailed view of how quickly the 226 glaciers studied are melting and which are retreating the fastest.
- OMG is planning its campaign for the summer of 2021. The team hopes that the ongoing measurements of ocean conditions will be invaluable for refining predictions of ice loss, ultimately helping the world prepare for a future of rising oceans.
- “When the ocean speaks, the Greenland Ice Sheet listens,” said OMG Principal Investigator Josh Willis, also of JPL. “This gang of 74 glaciers in deep fjords is really feeling the influence of the ocean; it’s discoveries like these that will eventually help us predict how fast the ice will shrink. And that’s a critical tool for both this generation and the next.”
References
1) ”NASA’s Oceans Melting Greenland Mission Leaves for Its Last Field Trip,” NASA/JPL News Release 2021-161, 4 August 2021, URL: https://www.jpl.nasa.gov/news/
nasas-oceans-melting-greenland-mission-leaves-for-its-last-field-trip?
utm_source=iContact&utm_medium=email&utm_campaign=nasajpl&utm_content=omg20210804-1
2) Ian Fenty, Josh K. Willis , Ala Khazendar , Steven Dinardo, René Forsberg, Ichiro Fukumori, David Holland , Martin Jakobsson, Delwyn Moller, James Morison, Andreas Münchow, Eric Rignot, Michael Schodlok, Andrew F. Thompson, Kirsteen Tinto, Matthew Rutherford, Nicole Trenholm, ”Oceans Melting Greenland: Early Results from NASA’s Ocean-Ice Mission in Greenland,” Oceanography, Volume 29, No. 4, pp: 72 - 83, Published online: 11 December 2016, https://doi.org/10.5670/oceanog.2016.100, URL: https://tos.org/oceanography/assets/docs/29-4_fenty.pdf
3) ”NASA Greenland Mission Completes Six Years of Mapping Unknown Terrain,” NASA/JPL, 26 January 2022, URL: https://www.jpl.nasa.gov/news/
nasa-greenland-mission-completes-six-years-of-mapping-unknown-terrain?utm_source=iContact&
utm_medium=email&utm_campaign=nasajpl&utm_content=omg20220126-1
4) Roberto Molar Candanosa, ”Earth's Cryosphere Is Vital for Everyone. Here's How NASA Keeps Track of Its Changes,” NASA News, 21 April 2021, URL: https://sealevel.nasa.gov/news/215/
earths-cryosphere-is-vital-for-everyone-heres-how-nasa-keeps-track-of-its-changes/
5) ”What a Glacial River Reveals About the Greenland Ice Sheet,” NASA News, 5 April 2021, URL: https://soulfulness's/news/214/what-a-glacial-river-reveals-about-the-greenland-ice-sheet/
6) L. C. Smith, L. C. Andrews, L. H Pitcher, B. T. Overstreet, Å. K. Rennermalm, M. G. Cooper, S. W. Cooley, J. C. Ryan, C. Miège, C. Kershner, C. E. Simpson, ”Supraglacial River Forcing of Subglacial Water Storage and Diurnal Ice Sheet Motion,” Geophysical Research Letters, Volume48, Issue7, 16 April 2021, e2020GL091418, https://doi.org/10.1029/2020GL091418
7) ”Warming Seas Are Accelerating Greenland's Glacier Retreat,” NASA News, 25 January 2021, URL: https://sealevel.nasa.gov/news/211/warming-seas-are-accelerating-greenlands-glacier-retreat/
The information compiled and edited in this article was provided by Herbert J. Kramer from his documentation of: ”Observation of the Earth and Its Environment: Survey of Missions and Sensors” (Springer Verlag) as well as many other sources after the publication of the 4th edition in 2002. - Comments and corrections to this article are always welcome for further updates (eoportal@symbios.space).
OMG: A Greenland-wide Experiment News and Features References Back to top