Skip to content
eoPortal

Satellite Missions Catalogue

Copernicus: Sentinel-1 2018-14

Jul 15, 2019

Back to main article

References

• November 30, 2018: The Copernicus Sentinel-1 mission takes us over Mexico City. This huge, densely-populated capital can be seen in the top right of the image. It is home to almost nine million people, with the Greater Mexico City area recording a population of over 21 million. This makes it the largest Spanish-speaking city in the world. 1)

Figure 1: Mexico City is located in the top right of the SAR image. This striking image has been created using three Copernicus Sentinel-1 acquisitions from 28 July, 27 August and 26 September 2018, overlaid in red, green and blue, respectively. Where we see explosions of color, changes have occurred between the different acquisitions. This image is also featured on the Earth from Space video program (image credit: ESA, the image contains modified Copernicus Sentinel data (2018), processed by ESA, CC BY-SA 3.0 IGO)

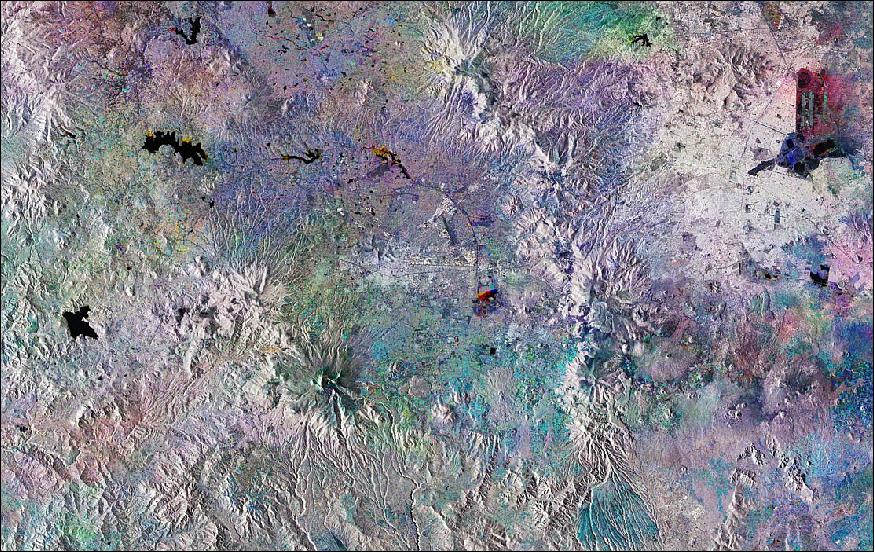
- In the left of the image, three bodies of water are shown in black: Villa Victoria, Valle de Bravo, and Tepetitlán. Water is significant to the development of Mexico City, which is thought to have been built over a lake by the Aztecs around 1325.

- Today, the city finds itself in a precarious situation in terms of water supply in spite of the regular flash floods and heavy rainfall it experiences during the wet season from June and September.

- In the top right, we can see the round structure of El Caracol meaning ‘the snail’ in Spanish. Currently used as a reservoir for industrial facilities within Mexico City, there are plans for this to become a wastewater treatment plant. A 62 km-long sewer tunnel is also due to begin operating this year.

- The Cumbres del Ajusco national park is shown to the southwest of the capital, in an area of the image that shows colorful dots forming a circle. Famous for being up to almost 4000 m above sea level at its highest elevation, it is one of many national parks surrounding the capital.

- Volcanoes are also dotted around this area. Popocatépetl, to the south east of Mexico City, last erupted in September 2018.

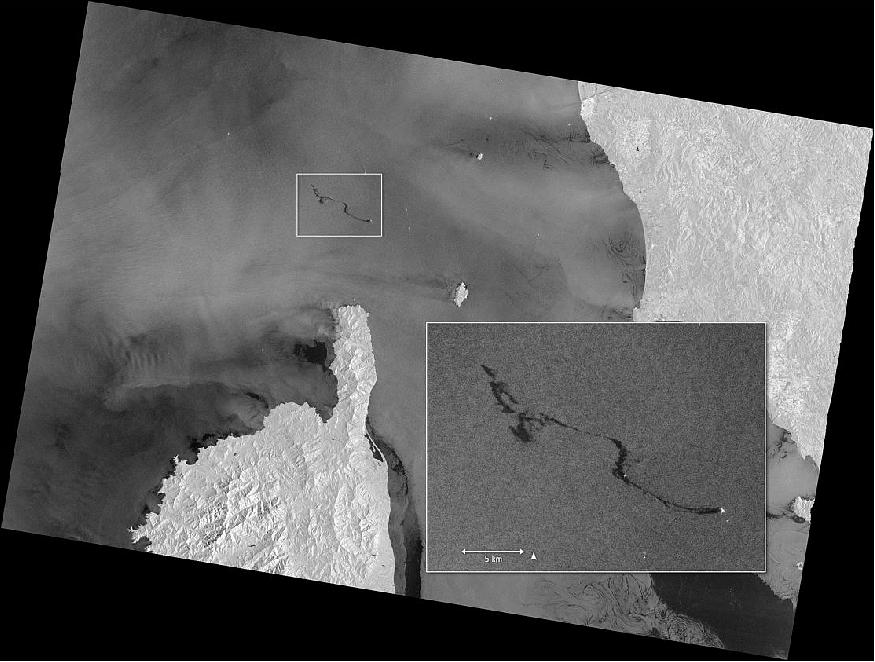
• On 8 October 2018 at 05:28 GMT (07:28 CEST), the Copernicus Sentinel-1 mission captured its first images of the oil spill from a collision between two ships that had occurred the day before in the Mediterranean Sea, north of the French island of Corsica. This first image shows that the oil slick was about 20 km long. By the evening at 19:21 CEST, however, imagery shows that the slick had lengthened to about 35 km. And 24 hours later, on 9 October at 19:14 CEST, the slick had grown to about 60 km long. 2)

Figure 2: The Copernicus Sentinel-1 mission returns images showing how oil is spreading in the Mediterranean Sea following a collision between two ships (image credit: ESA, the image contains modified Copernicus Sentinel data (2018), processed by ESA, CC BY-SA 3.0 IGO

Legend to Figure 2: The image from 9 October also shows a large black patch southeast of the oil slick – this is a result of low reflectivity of the radar signal and therefore depicts calm waters.

• October 8, 2018: The Copernicus Sentinel-1 mission has imaged the oil spill in the Mediterranean following a collision between two merchant ships on Sunday 7 October 2018. A Tunisian cargo ship is reported to have struck the hull of a Cypriot container ship in waters north of the French island of Corsica. There were no casualties, but the collision caused a fuel leak – which has resulted in an oil slick about 20 km long. Although the collision occurred in French waters, the cleanup operation is part of a joint pact between France, Italy and Monaco to address pollution accidents in the Mediterranean. 3)

Figure 3: This image of the slick, which can be seen as a dark patch north of the tip of Corsica, was captured by the Sentinel-1A satellite on 8 October at 05:28 GMT (07:28 CEST). Sentinel-1 is a two-satellite constellation built for the European Commission’s Copernicus environmental monitoring program (image credit: ESA, the image contains modified Copernicus Sentinel data (2018), processed by ESA, CC BY-SA 3.0 IGO)

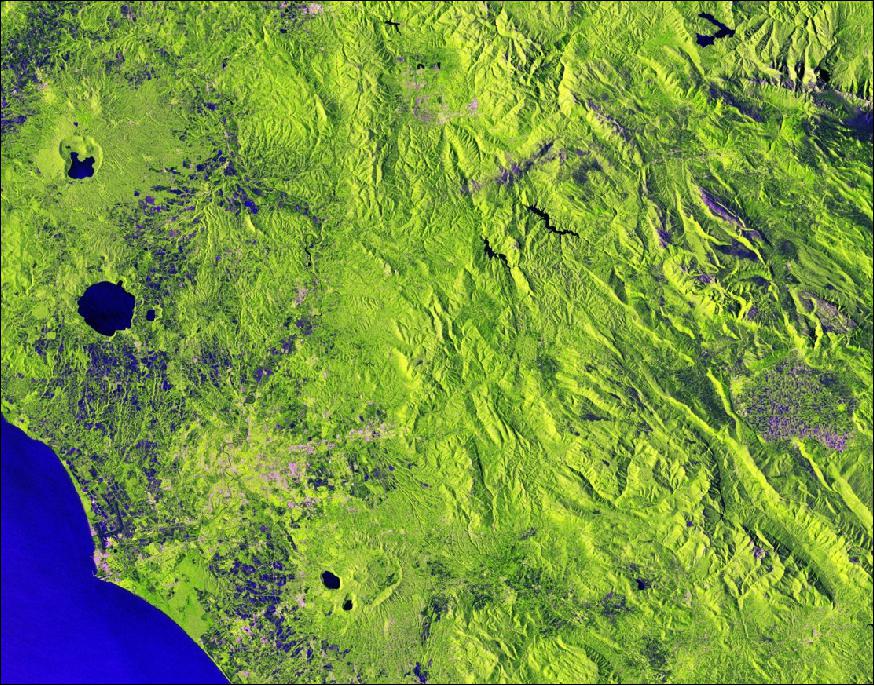
• September 28, 2018: The Copernicus Sentinel-1B satellite takes us over central Italy. From the Apennine Mountains in the top right, to the fertile, former lakebed of the Avezzano plain in the center right, this bright, false-color image (Figure 4) captures the diversity and beauty of the region’s landscapes. 4)

- Dual-polarization radar technology has been used, resulting in vibrant shades of green for most of the land surface shown. Built-up areas, such as Italy’s capital city of Rome, appear in shades of red and pink. Meanwhile, the structure of the agricultural fields of Altopiano in the Abruzzo region is clearly reflected in a combination of blue and violet hues.

- This radar technology allows us to see the crater lake structures of the volcanic lakes of Nemi and Albano in the bottom left clearly. The same is true for Lago di Vico with the volcano and crater clearly visible in the top left of the image.

- The central region of Italy is an important one for the space industry. For example, ESA’s center for Earth observation, which celebrates its 50-year anniversary this week, is located in this area.

- This region is also prone to earthquakes. In August 2016, a magnitude 6.2 earthquake struck the small towns of Amatrice, Accumoli and Pescara del Tronto. It was followed by two aftershocks. A magnitude 6.6 earthquake in Norcia followed in October the same year. The tremor of this last earthquake was felt across the country. It was the most powerful one to hit Italy since 1980.

Figure 4: Sentinel-1B captured this image of central Italy on 6 July 2018, is also featured on the Earth from Space video program (image credit: ESA, the image contains modified Copernicus Sentinel data (2018), processed by ESA, CC BY-SA 3.0 IGO)

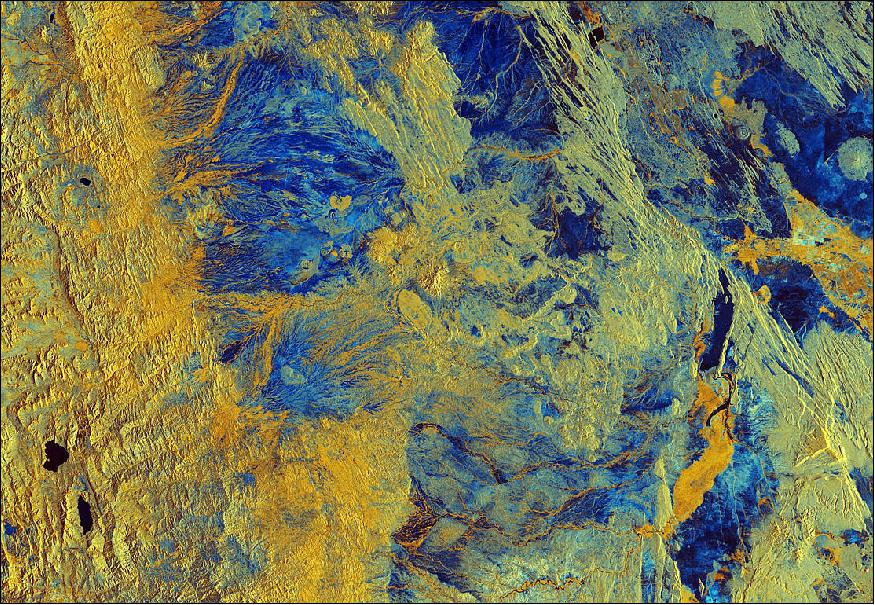
• September 14, 2018: The Copernicus Sentinel-1B satellite takes us over Semera in northeast Ethiopia. Semera is a new town with a population of just over 2600 and serves as the capital of the Afar region. The region spans an estimated 270,000 km2, from close to the border with Eritrea towards the capital of Addis Ababa (also written as Addis Abeba). 5)

- We can see the regional capital in the top right of this false-color image (Figure 5), with the larger urban center of Dubti just south of the town. Both are found in the Great Rift Valley, which lies between the Ethiopian Plateau and the Somalia Plateau.

- The landscape of the Afar region is characterized by desert shrubland and volcanoes, particularly in the north. In this image we can see differences in altitude represented in the variations in color. The left part of the image is dominated by yellow, signifying changes in vegetation found at higher altitudes. Two lakes, Hayk Lake and Hardibo Lake, are shown in the bottom left.

- South of Dubti we can see the Awash River, which flows into the northern salt lakes rather than into the sea. Salt trade is typical of the area, whilst cotton is grown in the Awash River valley. Maize, beans, papaya and bananas are also cultivated in the Afar region. It is thought that 90% of the region’s population lead a pastoral life, rearing animals such as camels, sheep and donkeys.

- Dallol, to the north of Semera in Ethiopia’s Danakil Depression, is frequently cited as one of the hottest inhabited places on Earth. Lying 125 m below sea level, with temperatures in the spectacular hydrothermal fields averaging 34.4 °C year-round, and the area receiving just 100–200 mm rainfall a year, conditions are thought to be amongst the most inhospitable in the world.

Figure 5: This image of Sentinel-1B, which was captured on 5 April 2018, is of northeast Ethiopia (image credit: ESA, the image contains modified Copernicus Sentinel data (2018), processed by ESA, CC BY-SA 3.0 IGO) 6)

• September 13, 2018: In July 2017, one of the largest icebergs on record calved from the Larsen C ice shelf in Antarctica. However, sea ice to the east and shallow waters to the north kept this giant berg, named A68, hemmed in. So for more than a year it wafted to and fro, but never left its parent ice shelf’s side. Strong winds blowing from Larsen C have finally given it the push it was waiting for. In early September 2018, these winds pushed the southern end of the berg out into the Weddell Gyre. This clockwise drift of ocean waters and sea ice flowing north past the Larsen shelf, which can be seen in the animation as a flow from right to left, has rotated A68 out into the Weddell Sea. Here it is freer to float away and be carried further north into warmer waters. 7)

Figure 6: The animation, generated by Adrian Luckman at Swansea University (UK), uses data from the Copernicus Sentinel-1mission – a two-satellite constellation. Each satellite carries an advanced radar instrument that can image Earth’s surface through cloud and rain and regardless of whether it is day or night. This is essential for monitoring the polar regions, which are shrouded in darkness during the long winter months (image credit: ESA, the image contains modified Copernicus Sentinel data (2017–18), processed by Swansea University–A. Luckman)

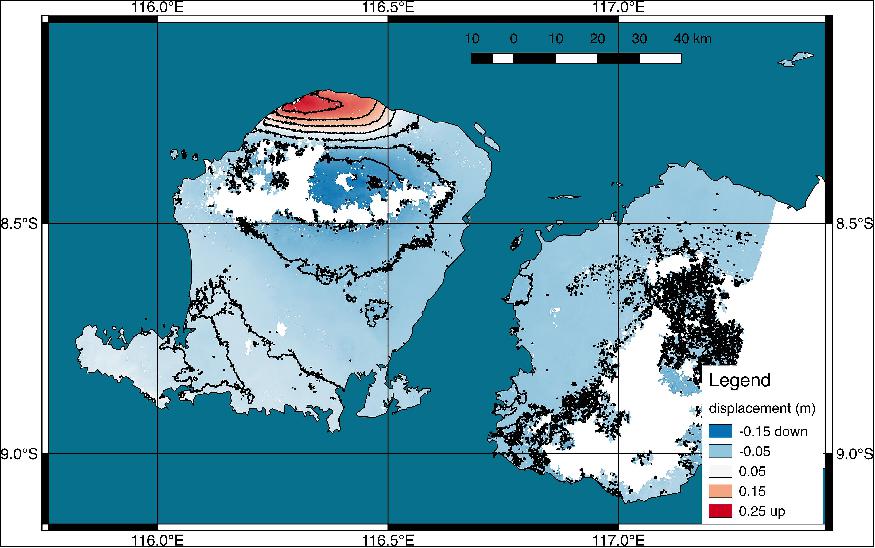
• August 8, 2018: Scientists with the ARIA (Advanced Rapid Imaging and Analysis) project , a collaboration between NASA's Jet Propulsion Laboratory in Pasadena, California, and Caltech, also in Pasadena, used synthetic aperture radar (SAR) data from the European Union's Copernicus Sentinel-1A and -1B satellites, operated by the European Space Agency. They generated a map of the deformation of Earth's surface caused by the Aug. 5, 2018 magnitude 6.9 earthquake under Lombok island, Indonesia (Figure 7). The deformation map is produced from automated interferometric processing of the SAR data using the JPL-Caltech ARIA data system in response to a signal received from the U.S. Geological Survey. The false-color map shows the amount of permanent surface movement that occurred almost entirely due to the quake, as viewed by the satellite, during a 6-day interval between two Sentinel-1 images acquired on July 30 and Aug. 5, 2018. 8)

- From the pattern of deformation in the map, scientists have determined that the earthquake fault slip was on a fault beneath the northwestern part of Lombok Island and caused as much as 25 cm of uplift of the ground surface. The map depicts motion towards the satellite (up and west) in the direction of the radar's line-of-sight, with contours every 5 cm. White areas are places where the radar measurement was not possible, largely due to dense forests in the middle of the islands.

Figure 7: New satellite map shows ground deformation after Indonesian quake. The map shows that the earthquake fault was under the northwest corner of Lombok island, probably extending offshore to the west. Through these maps, NASA and its partners are contributing observations and expertise that can assist with response to earthquakes and other natural or human-produced hazards (image credit: NASA/JPL-Caltech/Copernicus/ESA, the image contains modified Copernicus Sentinel-1 data (2018) processed by ESA and NASA/JPL)

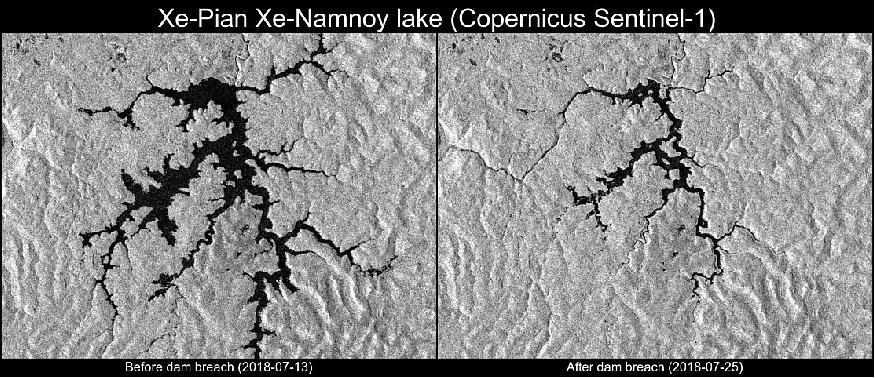
• July 30, 2018: Copernicus Sentinel-1 data are highlighting the collapse of the Xe-Pian Xe-Namnoy dam in the southeastern province of Attapeu in Laos. The collapse has led to flash floods that have claimed several lives and left many more people missing, according to local news reports. 9)

- Sentinel-1’s radar ability to ‘see’ through clouds and rain, and in darkness, makes it particularly useful for monitoring floods. Images acquired before and after flooding offer immediate information on the extent of inundation and support assessments of property and environmental damage.

- The C-band synthetic aperture radar on Sentinel-1 can provide large swath images with a resolution of 20 m and within hours of acquisition to aid emergency response. — With construction starting back in 2013, the dam had been expected to commence commercial operations this year.

- The flood seems to have been caused by a breach in another saddle dam (not the main dam) following heavy rainfall. The effects of this can be seen clearly at larger scale, with the flood following the Vang Ngao river down to the villages. This is shown in the animation here.

Figure 8: Sentinel-1 images show the impact of the dam failure on the Xe-Pian Xe-Namnoy lake area in the southeastern province of Attapeu in Laos (image credit: ESA, the imagery contains modified Copernicus Sentinel data (2018) / processed by CESBIO) 10)

- The catastrophe triggered the International Charter Space and Major Disasters. With 16 members, the Charter takes advantage of observations from several satellites, providing a unified system of space data acquisition and delivery to support disaster management.

- With the ability to mobilize agencies around the world through a single access point that operates 24 hours a day, 7 days a week, the Charter helps civil protection authorities and the international humanitarian community in the face of major emergencies.

- By supplying reliable and accurate information, these entities are better equipped to save lives and limit damage to property, infrastructure and the environment.

- Since its first activation in 2000, the Charter has called on space assets on hundreds of occasions, helping respond to disasters such as floods, hurricanes, tsunamis and earthquakes.

Figure 9: Dam failure in the Xe-Pian Xe-Namnoy lake area (image credit: ESA, the image contains modified Copernicus Sentinel data (2018) processed by CESBIO)

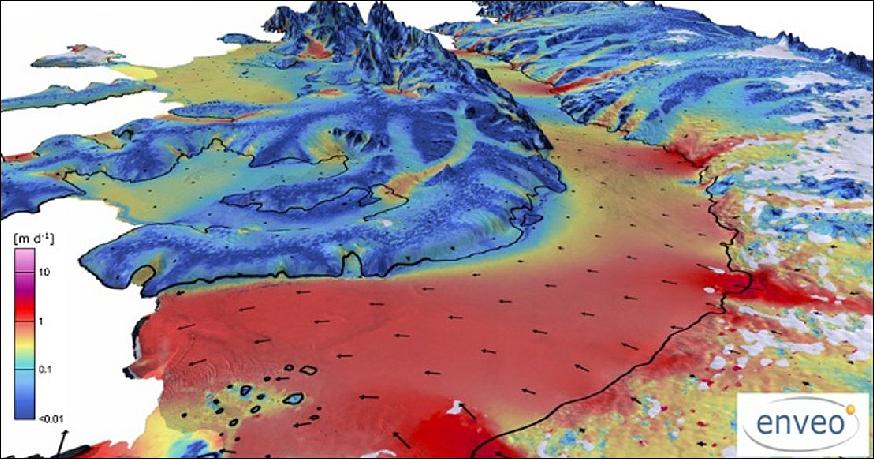
• July 13, 2018: The Copernicus Sentinel-1 mission has revealed that, on average, Greenland’s glaciers are now flowing more slowly into the Arctic Ocean. While glacial flow may have slowed overall, in summer glaciers flow 25% faster than they do in the winter. 11)

- While the general flow has reduced in recent years, during the summer it speeds up, with glaciers flowing up to 25% faster than in the winter.

- A paper published recently in The Cryosphere details the research led by the UK’s CPOM (Centre for Polar Observation and Modelling) where the Copernicus Sentinel-1 mission was used to track Greenland’s four main glaciers: Jakobshavn Isbrae, Petermann, Nioghalvfjerdsfjorden and Zachariae Isstrom between 2014 and 2017. 12)

- We all know that ice melts pretty quickly under the summer sun, but monitoring exactly how glacial flow changes according to the season is important for understanding glacial dynamics. In turn, this is vital to assess the risk of sea-level rise, which is a major concern around the world.

- Together, these four glaciers contain enough water to raise global sea levels by 1.8 m.

- Adriano Lemos from CPOM noted, “Sentinel-1 has real advantages for studying glaciers. We now get more data and more often so we can see the finer detail in even the most inaccessible and fast-moving areas.”

Figure 10: The Copernicus Sentinel-1 mission has revealed that, on average, Greenland’s glaciers are flowing more slowly into the Arctic Ocean. While the general flow has reduced in recent years, in the summer glaciers flow up to 25% faster than in the winter. Jakobshavn Isbrae, which is Greenland’s fastest flowing glacier, reached a peak of 17 km per year in 2013, the result of an unusually warm summer. But satellite data, in particular from Sentinel-1, show that, on average, it has actually slowed down by 10% since 2012. This is overlaid by a seasonal pattern, with the glacier accelerating by up to 14% over a three-month summer period before slowing down again in winter (image credit: ESA, the image contains modified Copernicus Sentinel data (2014–17), processed by CPOM) 13)

- Part of European Union’s fleet of Copernicus missions, Sentinel-1 is a two-satellite constellation that images the entire Earth every six days – important for monitoring rapid change. Each satellite carries an advanced radar instrument that can image Earth’s surface through cloud and rain and regardless of whether it is day or night.

- This is essential for monitoring the polar regions, which are shrouded in darkness during the long winter months.

- “We saw this summer speed-up at all four glaciers and it is important that we continue to monitor this speed throughout the year to fully understand how the glaciers are moving” explained Adriano Lemos.

- Anna Hogg also from CPOM added, “Acquiring all this valuable radar data needed international coordination between multiple space agencies such as ESA and the German Aerospace Center DLR. This paper shows how our efforts are being rewarded through improving our understanding of environmental change in Greenland.”

• June 2018: The Sentinel-1 mission has set a benchmark for achieving a high-quality end-to-end SAR performance, showing almost identical radiometric and geolocation accuracy for Sentinel-1A &-1B. 14)

- In addition, the 6-day repeat orbit interval along with small orbital baselines enables the implementation of cross-InSAR by combining data acquired by Sentinel-1A&-1B from repeat-pass orbits, reducing significantly the temporal surface decorrelation effect. This supports geophysical applications, such as the monitoring of cryosphere dynamics and the mapping of surface deformation.

- The continuous and systematic Sentinel-1 SAR and InSAR data acquisition, while providing an instantaneous wide area coverage, enables the build-up of long data time series. This has triggered a shift from individual image analysis to time-series processing.

• May 29, 2018: In what the UN describes as the world’s fastest growing refugee crisis, almost 700,000 Rohingya Muslims have fled Myanmar for neighboring Bangladesh since August 2017. With the Bangladesh government proposing a vulnerable low-lying island as a relocation site for thousands, Sentinel-1 data have shown how unsuitable this site would be. 15)

- While the Rohingya have faced decades of repression, this recent mass exodus is blamed on large-scale atrocities committed by the Myanmar military. - Not only has the pace of arrivals in Bangladesh made this the fastest growing refugee crisis in the world, but the concentration of displaced people now in Bangladesh’s Cox’s Bazar is amongst the densest in the world. Even before the crisis, Bangladesh was hosting more than 200,000 Rohingya from Myanmar. For a country already struggling to cope with challenges of its own, this has turned into a huge humanitarian tragedy.

- Desperate to find solutions, the Bangladesh government was prompted, unsurprisingly, to revive a much criticized plan to move thousands to Thengar Char, one of several uninhabited and unstable islands in the Bay of Bengal.

- The area is particularly prone to cyclones, with coastal zones and islands at highest risk. Some nearby islands have a tidal range as high as 6 m, meaning that they are at risk of being completely submerged. - Regardless of cyclones, the region is often inundated by heavy rainfall during the South Asian monsoon, which lasts from June to October.

- Information from satellites is often used during humanitarian crises to map, for example, the extent of camps and other temporary settlements. In this case, however, the Earth Observation-based Services for Dynamic Information Needs in Humanitarian Action project used data from the Copernicus Sentinel-1 radar mission to show exactly how precarious Thengar Char is.

Figure 11: The Bangladeshi island of Thengar Char in the Bay of Bengal has been identified as a possible relocation site for Rohingya refugees. Information from the Copernicus Sentinel-1 mission has been used to show that the island is particularly susceptible to inundation. At times, flooding has reduced the island from 76 km2 to less than 40 km2 (image credit: EO4HumEn+)

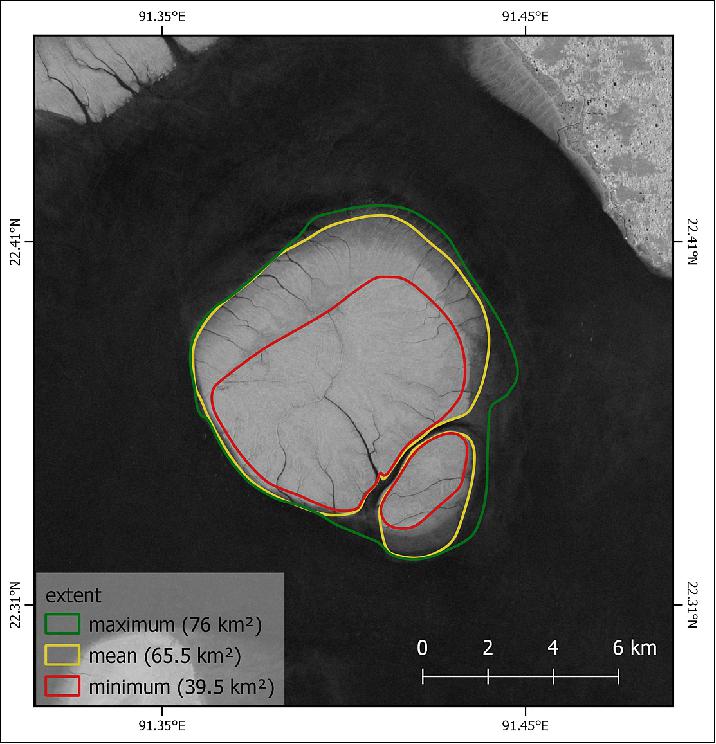
- Andreas Braun from Germany’s University of Tübingen said, “As well as using data from Sentinel-1, we also used data from ESA’s old ERS and Envisat satellites to work out how the size of the island has changed since 1991 (Figure 12).

Figure 12: Barely an island: Based on 178 archived satellite radar images from 1991 to 2018, this image shows how often a pixel was identified as land. During this time, the island of Thengar Char mostly varied between 30% and 80% of its mean extent. This shows how vulnerable the island is to flooding (image credit: EO4HumEn+) 16)

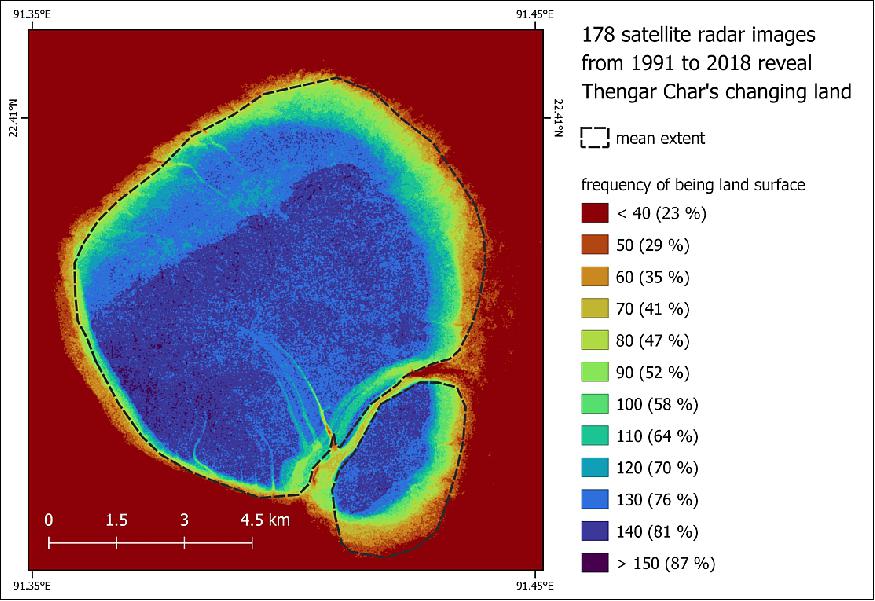
- “It turns out that this set of islands has only been there since 2009, and were formed from silt washing down from the Himalayas into the Bay of Bengal. We calculated how big the island has ever been, how small it has ever been and how big it is on average. Importantly, we could report that since Sentinel-1 became operational in 2014, the island, which is currently about 60 km2, has been inundated several times and at the worst, the land area was reduced to 39 km2.”

- The notion of placing vulnerable people on an inhospitable island that has no existing infrastructure and is two hours away by boat from the mainland is obviously questionable, but thanks to Sentinel-1, the authorities have hard evidence as to its risk of flooding.

- It remains to be seen whether the government of Bangladesh will move forward with their plan, although construction work has apparently begun.
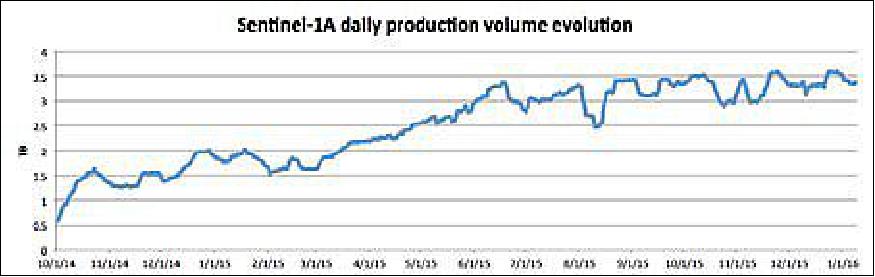
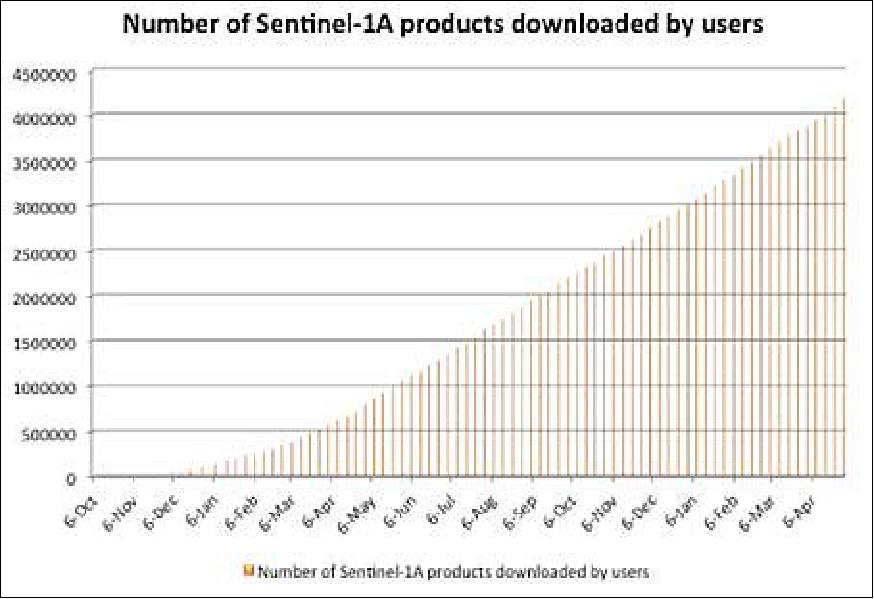
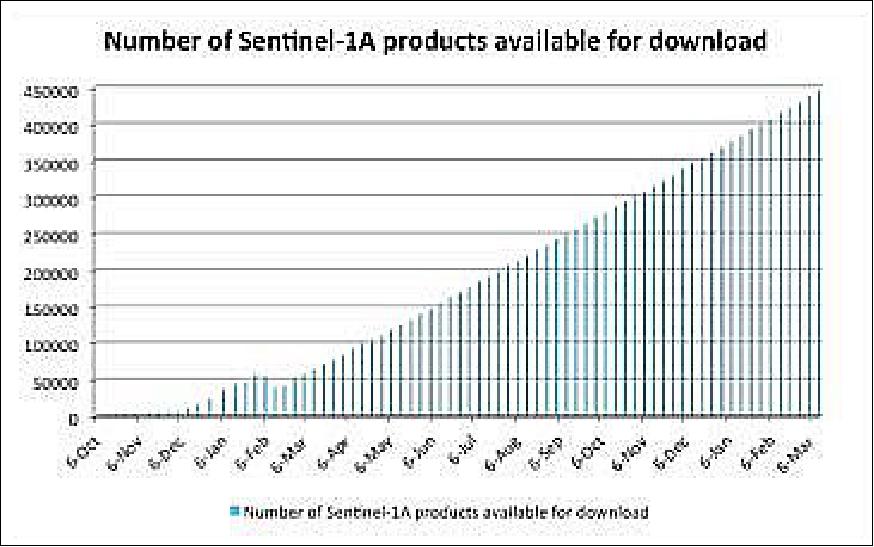
Mission status 22-28 May, 2018: The Sentinel-1 Yearly Mission Review took place on 24 May 2018, at ESA-ESRIN. The overall mission is in a very good shape, and both satellites demonstrate a good health. The occurrence of satellite anomalies and mission unavailability periods has further decreased over the past months. A major increase of the Sentinel-1 operations capacity has been achieved during the past year with the smooth integration of the EDRS service in operations, and a series of improvements were performed (e.g. systematic production of L2 OCN (Level 2 Ocean) products from IW/EW/SM modes). Substantial improvements on the data quality have been achieved (e.g. provision of de-noising information), and will be pursued. Remaining system issues are being addressed, in particular the Level 2 OCN RVL product qualification. The Copernicus operational services have expressed satisfaction on the routine use of Sentinel-1 data. Data and user access statistics, as well as the numerous exploitation activities based on Sentinel-1 data, confirm the great user uptake in various thematic application and scientific fields. 17) 18)

- The Sentinel-1A and Sentinel-1B routine operations are on-going

- The Sentinel-1 observation scenario supports the systematic coverage of Copernicus Services areas of interest, of European land and coastal waters, of global tectonic/volcanic areas, as well as of other areas worldwide for various applications. The observation plan also includes a regular mapping of all land areas worldwide.

- World maps providing a high level description of the Sentinel-1 constellation observation scenario, in terms of SAR modes, polarization, observation geometry, revisit and coverage frequency are available at: https://sentinels.copernicus.eu/web/sentinel/missions/sentinel-1/observation-scenario

- The detailed observation plan in the form of instrument acquisition segments, for both Sentinel-1A and Sentinel-1B is published at: https://sentinels.copernicus.eu/web/sentinel/missions/sentinel-1/observation-scenario/acquisition-segments

- The operational use of Sentinel-1 data by the Copernicus Marine Environment Monitoring Service (CMEMS) for sea-ice and iceberg monitoring activities is on-going.

- The European Maritime Safety Agency (EMSA) operationally uses Sentinel-1 imagery in quasi-real time in the CleanSeaNet services; operations with EMSA service providers local stations are on-going.

- Specific planning was made to support the activation EMSR286 from the Copernicus Emergency Management Service related to monitoring the risk of failure of the Ituango dam in Colombia.

- Specific actions (fast delivery of already planned acquisitions) were implemented to support the activation EMSR287 from CEMS related to floods in Saxony, Germany.

- Both Sentinel-1A and -1B spacecraft are in a stable state, operating in Nominal Mission Mode (NMM). The Flight Operations Segment (FOS) ensuring the monitoring, control and commanding of the satellites is operating nominally. Orbit control maneuvers are performed once a week.

- The use of the EDRS-A service by Sentinel-1A and -1B is on-going as part of the routine operations.

- X-Band data acquisitions are routinely performed over Matera, Svalbard and Maspalomas X-band core stations. The acquired data are circulated within the Payload Data Ground Segment (PDGS), systematically processed to Level-0 and Level-1 products and archived.

- Wave Mode data are regularly acquired over open oceans, systematically processed to Level-2 OCN products and made available. Sentinel-1 IW and EW Level-2 OCN products over regional ocean areas are available on the Data Hubs. The operational qualification of the Level-2 the OCN Radial Surface Velocity (RVL) component is on-going.

- Operations are performed regularly at the Processing and Archiving Centres (DLR-PAC and UK-PAC). All other PDGS operational services (i.e. Mission Performance, Precise Orbit Determination, Wide Area Network) are operating nominally.

- By 24th May 2018, a total of 153,443 users have self-registered on the Sentinels Scientific Data Hub; 14.6 million Sentinel-1 product downloads have been made by users, corresponding to 19 PB of data. 2.6 million Sentinel-1 products are available on-line for download, representing about 4 PB of data. Statistics of last 24 hours are available in real time at the Open Data Hub home page: https://scihub.copernicus.eu

• March 22, 2018: Two giant sinkholes near Wink, Texas, may just be the tip of the iceberg, according to a new study that found alarming rates of new ground movement extending far beyond the infamous sinkholes. That's the finding of a geophysical team from SMU (Southern Methodist University), Dallas that previously reported the rapid rate at which the sinkholes are expanding and new ones forming. - Now the team has discovered that various locations in large portions of four Texas counties are also sinking and uplifting. 19)

- Radar satellite images show significant movement of the ground across a 4000-square-mile area (10 ,360 km2) - in one place as much as 1 m over the past two-and-a-half years, say the geophysicists.

- The West Texas’ Permian Basin, consisting of ancient marine rocks, is underlain by water-soluble rocks and multiple oil-rich formations. In the region that is densely populated with oil producing facilities, many localized geohazards, such as ground subsidence and micro-earthquakes, have gone unnoticed. Here we identify the localized geohazards in West Texas, using the satellite radar interferometry from newly launched radar satellites (Sentinel-1A/1B) that provide radar images freely to public for the first time, and probe the causal mechanisms of ground deformation, encompassing oil/gas production activities and subsurface geological characteristics. Based on our observations and analyses, human activities of fluid (saltwater, CO2) injection for stimulation of hydrocarbon production, salt dissolution in abandoned oil facilities, and hydrocarbon extraction each have negative impacts on the ground surface and infrastructures, including possible induced seismicity. Proactive continuous and detailed monitoring of ground deformation from space over the currently operating and the previously operated oil/gas production facilities, as demonstrated by this research, is essential to securing the safety of humanity, preserving property, and sustaining the growth of the hydrocarbon production industry. 20)

- Geohazards pose a severe threat to humanity, civilian properties, infrastructures, and industries, possibly leading to the loss of life and high economic values. Monitoring areas prone to geohazards is invaluable for locating their precursory signals on the surface, alerting civilians to potential disasters, mitigating the catastrophic outcomes, and facilitating the decision-making processes on the construction and operation of infrastructures and industrial facilities. The United States mid-continent has long been considered geologically stable with no large scale tectonic movements, volcanism, or seismic activities. Therefore, unlike California with its dense GPS networks and frequent survey (aerial, spaceborne, field) campaigns, the mid-continent has garnered less attention from scientific communities and federal/state governments. However, recent studies have revealed that some of the mid-continent, especially the Gulf Coast of the United States including Texas, Louisiana, and Mississippi, is not immune to large-scale and/or localized geohazards.

- The geohazards along the southern United States have been both naturally induced and stimulated by human activities. Besides the occasional, strong tropical storms and flooding in lowlands, natural geohazards include settlement due to sediment loading and glacial isostatic adjustment, which can make the coastline in the Gulf Coast vulnerable to sea-level changes. However, the naturally occurring surface subsidence on the coast displays characteristics of a continuous, slow progression (mm/year) and a large spatial extent (~100 km wide). In contrast, human-induced geohazards are faster growing (up to tens of cm/year) and encompass a varying but generally small area (up to a couple of km wide). The most prominent difference between natural and human-induced geohazards is the correlation between surface instability and anthropogenic activities (e.g., mining, groundwater extraction, hydrocarbon production). Although there can be a time delay of ground deformation after human activities, depending on the geological characteristics (porosity, elasticity, compressibility, pore pressure, permeability) of soils and rocks and types of the operations, human-induced surface subsidence or uplift usually has high proximal and temporal correlation with those activities.

- West Texas is somewhat distant from the Gulf coast, but was inundated by relatively shallow seas during the early part of the Paleozoic Era (approximately 600 to 350 million years ago). The sediments formed during this period contributed to the accumulation of sandstone, shale, and limestone. The seas constituting broad marine environments in West Texas gradually withdrew, and by the Permian Period (approximately 299 to 251 million years ago), thick evaporites (salt, gypsum) accumulated in a hot arid land encompassing shallow basins and wide tidal flats. As a consequence of geological formation in West Texas, the deposited carbonate (reef limestone) and marine evaporite sequences played an important role in the formation of oil reservoirs by helping seal the traps and preserving the hydrocarbons. This resulted in the Permian Basin of West Texas’ massive hydrocarbon reservoirs that became so lucrative to the oil and gas industry.

Figure 13: Locations of ground deformation in West Texas. Six major sites (red stars) in West Texas display the locations influenced by human activities identified based on Sentinel-1A/B multi-temporal interferometry (background image is from Sentinel-2). To estimate 2D (east-west and vertical) deformation, the ascending (path 78; black box) and descending (path 85; white box) track Sentinel-1A/B images were integrated over the overlapped regions. The West Texas’ Permian Basin contains two major aquifer systems under the influence of the Pecos River, the Pecos Valley aquifer and the Edwards-Trinity aquifer (SMU, ESA)

- In West Texas, human activities such as groundwater exploitation, fluid injection, and hydrocarbon extraction have resulted in surface instability, leading to geohazards such as surface heave/subsidence, fault reactivation, induced seismicity, and sinkhole formation. The vastness of West Texas challenges our ability to identify and locate the relatively small spatial scale of the deformation corresponding to human activities, particularly for fluctuations over the course of a month or a year. Without concerted focus, the small-sized signal in a short time window can go easily undetected. There have been a few studies documenting the surge of surface uplift/subsidence, sinkhole formations, and induced seismicity in oil fields. However, the role of human activities on the surface and subsurface deformation has yet to be fully established, particularly regarding the identification of small-scale deformation signals over a vast region from big datasets spanning multiple years and analyzing them with supplementary information.

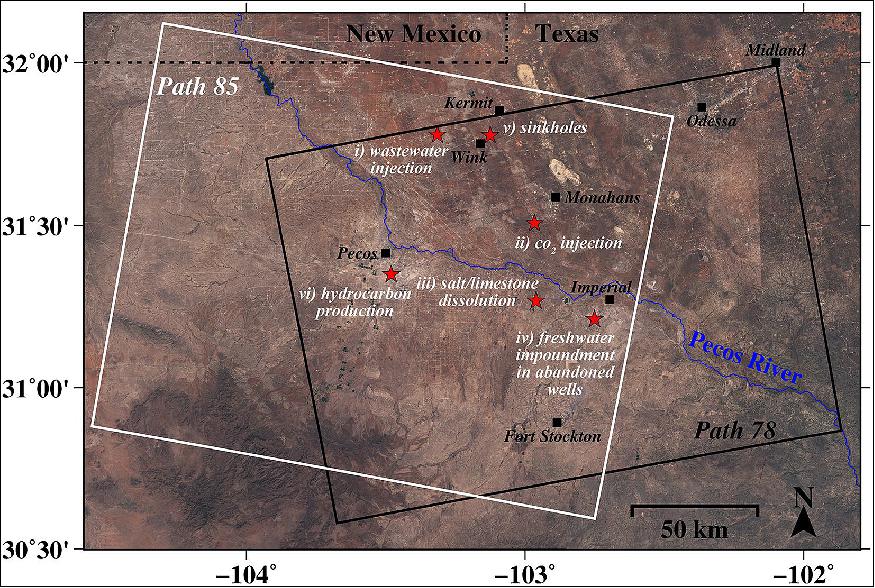
- Challenges to the effective study of the geohazards in West Texas include: identification of their locations in remote and vast regions, measurement of their long-term evolution, and characterization of the causal mechanism with accessible information. Satellite radar interferometry (InSAR) has proven capable of imaging ground surface deformation with a measurement accuracy of centimeters or better at a spatial resolution of meters or better over a large region covering tens of thousands km2. However, satellite radar acquisitions over West Texas have previously been scarce. Here we present the analysis of the ongoing ground deformations induced by various geohazards around Pecos, Monahans, Wink, and Kermit in West Texas (Figure 13), using multi-temporal InSAR observations based on radar imagery from the first free, open-source radar satellites Sentinel-1A/B.

- The objective of our study is to probe the association between the ongoing localized geohazards in West Texas and anthropogenic activities. To achieve the goal, we focus on the localized, small-sized (200 m~2 km wide), and rapidly developing (cm/yr) geohazards in the region, which are categorized based on six possible causes: i) wastewater injection, ii) CO2 injection for enhanced oil recovery (EOR), iii) salt/limestone dissolution, iv) freshwater impoundment in abandoned wells, v) sinkhole formation in salt beds, and vi) hydrocarbon production. In addition, time-series measurements from two different imaging geometries are integrated to decipher the deformation phenomena. Furthermore, through comparative analysis of records of fluid injection, hydrocarbon production, and geological characteristics, we establish the relationship between the possible causes of human activities or natural perturbation and the localized observed geohazards in West Texas.

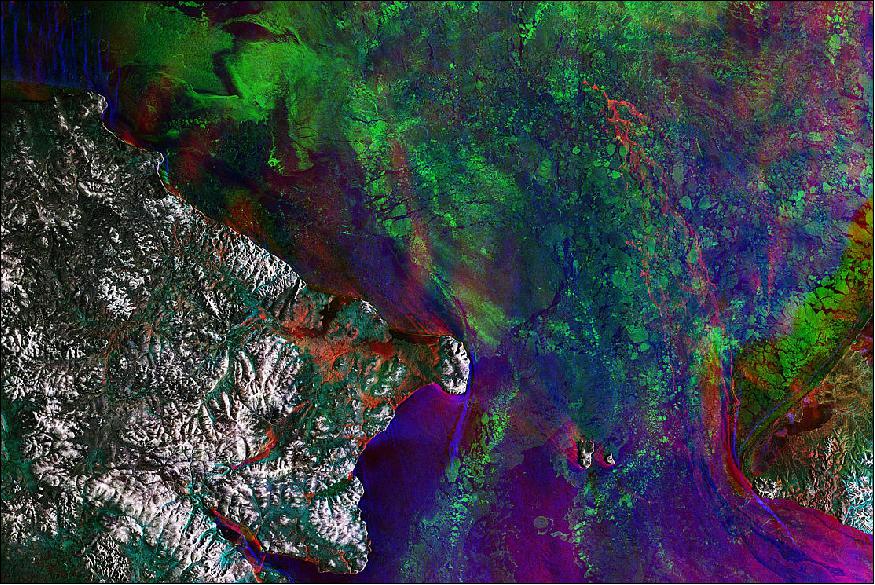
• February 23, 2018: The Copernicus Sentinel-1 mission takes us over the Bering Strait (Figure 14), which connects the Pacific and Arctic Oceans between Russia (Siberia) and the US state of Alaska. 21)

- Since the Bering Strait lies slightly south of the polar circle, days are short during the winter. Thanks to its radar, Sentinel-1 can ‘see’ through clouds and in the dark, making it especially valuable for monitoring parts of the planet that endure relatively dark winter months. Offering this ‘radar vision’, images from Sentinel-1 can be used for charting icebergs and for generating maps of sea ice for year-round navigation.

- Additionally, monitoring changes in the extent of sea ice is critical for understanding the effect of climate change on our environment.

- It has been reported that sea ice in the Bering Strait has been particularly low this winter. This is because unusually warm water streamed up from the south, causing some of the sea ice to melt earlier than usual. As a result, areas that would have remained covered with reflective sea ice were open for much longer. The relatively dark surface of the sea was able to absorb a lot of energy from the Sun, which prevented sea ice forming in the autumn. Also, recent storms have helped to break up much of the sea ice that did manage to form.

Figure 14: The image was created by combining three radar scans of 11 December 2017, 23 December 2017 and 4 January 2018. Each image has been assigned a different color: blue, red and green, respectively. This creates a colorful composite that highlights how the sea ice changed over the four weeks of observation (image credit: ESA, the image contains modified Copernicus Sentinel data (2017–18), processed by ESA, CC BY-SA 3.0 IGO)

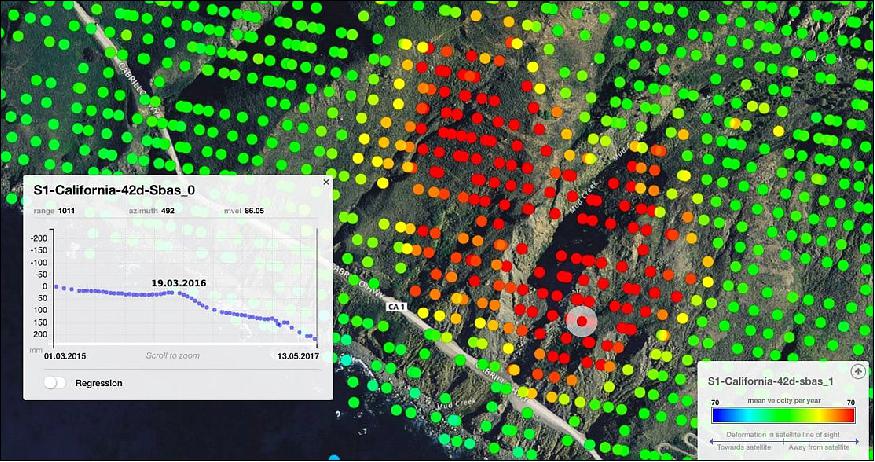
• December 15, 2017: The Sentinel-1 radar satellite mission takes us over Orange County and surrounding areas in the US state of California. 22)

- Two prominent geological features are visible in Figure 15: the coastal plains of the Los Angeles Basin in the upper-central left, and the Santa Ana Mountains running from the upper left to the lower right.

- A typical feature of Pacific Coast mountain ranges like Santa Ana is a moister western slope and drier eastern slope – reflected in this radar image by the more prominent colors on the left side of the mountain range. This is due to air masses from the Pacific bringing precipitation to the land, while the mountains force the clouds to rise and produce rain and block them from moving further east, causing a ‘rain shadow’ and thus drier areas on the other side.

- To respond to dry conditions in California and all over the world, populations rely on dams and reservoirs to control the water supply. In satellite imagery, these water bodies are easy to identify by the straight-cut line of the dam blocking water flow – two of which are visible in the center-right part of the image.

Figure 15: Three passes by Sentinel-1’s radar from 21 December 2014, 2 January 2015 and 14 January 2015 were combined to create this image. Each image was assigned a color – red, green and blue – and changes on the ground that occurred between passes appear as different colors (image credit: ESA, the image contains modified Copernicus Sentinel data (2014-15), processed by ESA , CC BY-SA 3.0 IGO)

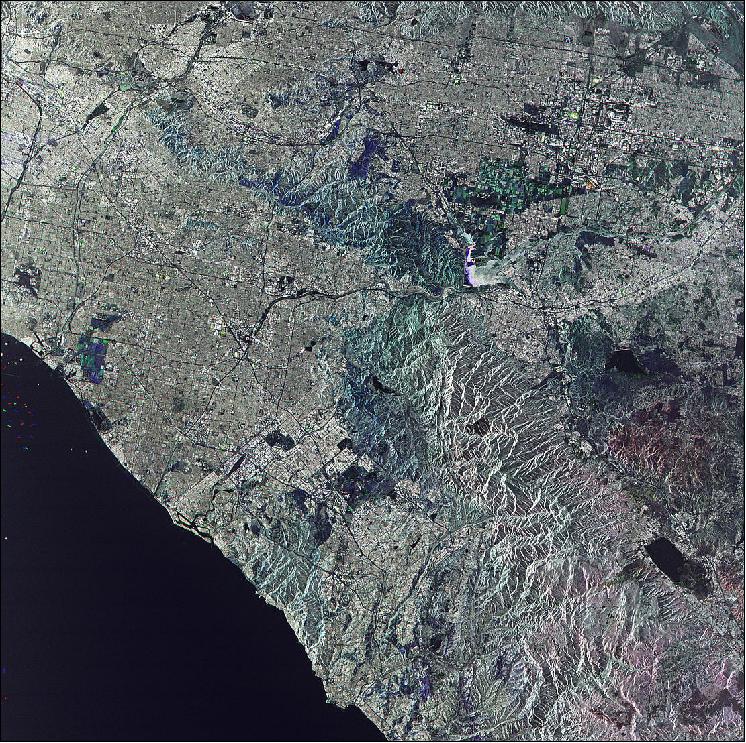
Legend to Figure 15: One obvious example of changes can be seen in the boats in the water on the left side of the image, appearing in the three different colors depending on when they were present. - In other parts of the image we can see colors in agricultural fields showing changes in vegetation between the acquisitions.

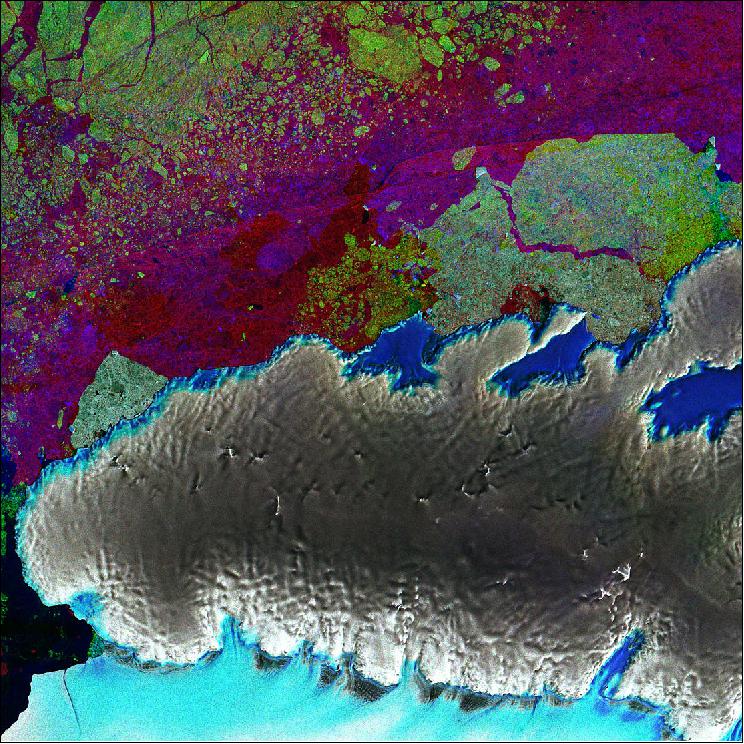
• November 24, 2017: The Copernicus Sentinel-1 mission gives us ‘radar vision’ over part of Antarctica’s third-largest island, Thurston Island. The satellite’s radar can ‘see’ through clouds and in the dark, making it a valuable tool for monitoring polar regions which are prone to bad weather and long periods of darkness – such as Antarctica. 23)

- The image of Figure 16 combined three passes by Sentinel-1’s radar in March, April and May 2017. Each was assigned a color – red, green and blue – and when merged, changes between the acquisitions appear in various colors.

- The ice-covered island appears grey, showing no change over the three-month period. But changes in sea ice in the upper part of the image appear as speckles of green, red and blue. In the lower part of the image we can see part of the Abbot Ice Shelf appearing in light blue.

- Antarctica is surrounded by ice shelves, which are thick bands of ice that extend from the ice sheet and float on the coastal waters. They play an important role in buttressing the ice sheet on land, effectively slowing the sheet’s flow as it creeps seaward.

- The ice sheet that covers Antarctica is, by its very nature, dynamic and constantly on the move. Recently, however, there has been a worrying number of reports about its floating shelves thinning and even collapsing, allowing the grounded ice inland to flow faster to the ocean and add to sea-level rise.

Figure 16: Sentinel-1 ‘radar vision’ over part of Antarctica’s third-largest island, Thurston Island. The image combines three passes by Sentinel-1’s radar in March, April and May 2017 - each was assigned a color – red, green and blue which were merged (image credit: ESA, the image contains modified Copernicus Sentinel data (2017), processed by ESA, CC BY-SA 3.0 IGO)

• November 7, 2017: In late August, the 60 m-long US Coast Guard Cutter Maple completed its navigation through the Arctic’s ice-ridden Northwest Passage (Figure 17). While this was not the first time ships had taken this route, it was the first time that the IIP (International Ice Patrol) had provided iceberg information based exclusively on satellite imagery. — Established in 1914 in response to the sinking of the Titanic, the US Coast Guard IIP monitors iceberg danger in the North Atlantic Ocean for shipping safety. 24)

Figure 17: The US Coast Guard Cutter Maple being escorted by the Canadian Coast Guard Ship Terry Fox (image credit: ESA, the image contains modified Copernicus Sentinel data (2017), processed by Polar TEP)

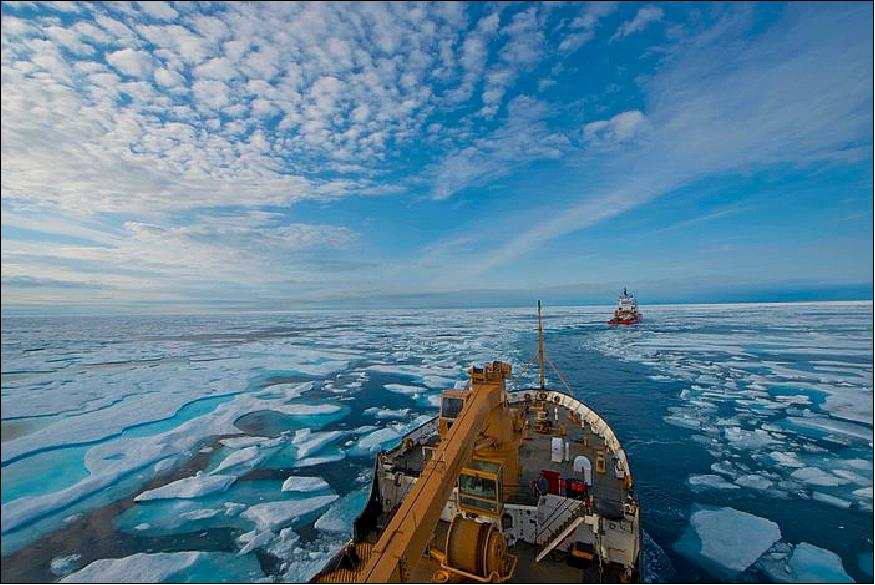
- When the Maple departed from Alaska in mid-July en route through the Arctic to Maryland, USA, the IIP was on guard to assist the crew to navigate through the notoriously icy waters.

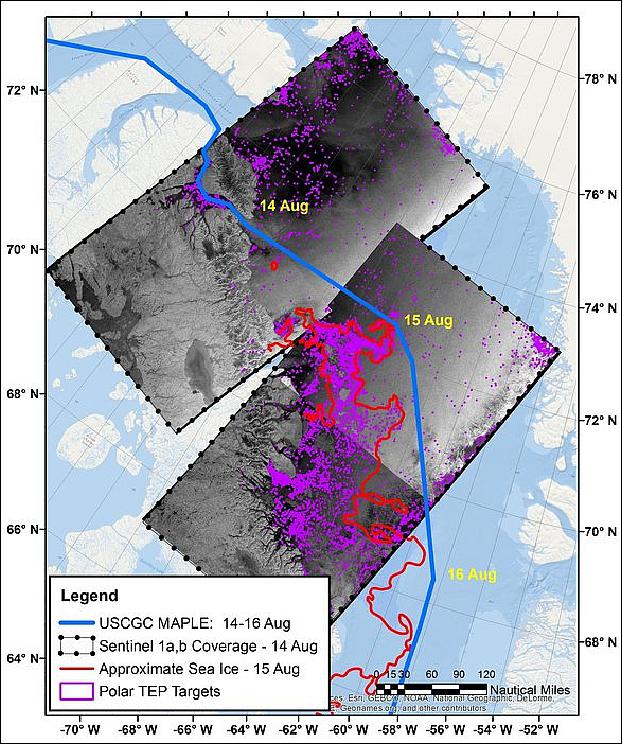
- The IIP used data from the Copernicus Sentinel-1 satellite mission, among others, to create charts showing the risk of encountering icebergs after exiting from the Northwest Passage and during transit through the Baffin Bay, Davis Strait and Labrador Sea.

Figure 18: Maple's course. The region through which the ship Maple transited 14–18 August 2017, with approximate ship locations identified in yellow on each day. The map has been overlaid with images from the Sentinel-1 radar satellite mission (image credit: ESA, the image contains modified Copernicus Sentinel data (2017), processed by Polar TEP)

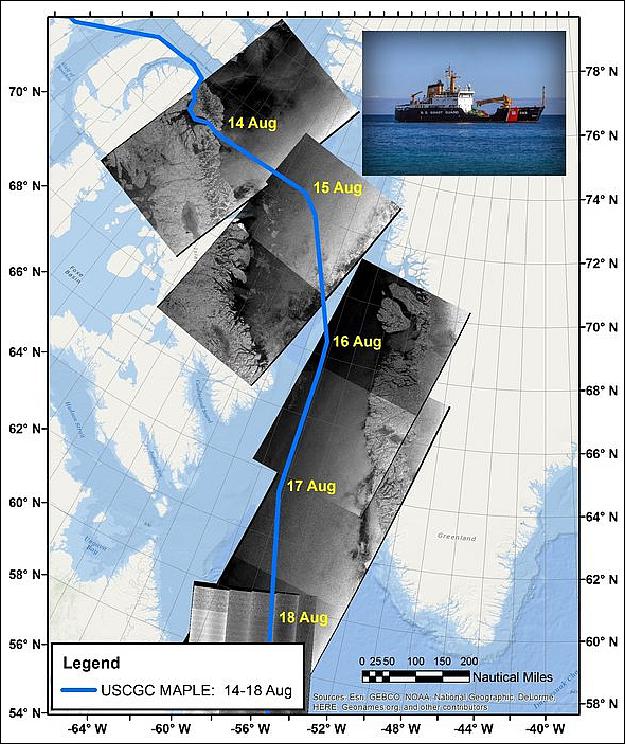
- Sentinel-1 is equipped with radar that can detect icebergs through cloud cover, a capability particularly beneficial in the IIP’s operating area. Sentinel-1 can also distinguish between the thinner, more navigable first-year ice and the hazardous, much thicker multiyear ice to help assure safe year-round navigation in ice-covered Arctic and sub-Arctic zones. These radar images are particularly suited to generating high-resolution ice charts, monitoring icebergs and forecasting ice conditions.

- Scientists at the IIP used iceberg detection software available on ESA’s online Polar TEP (Thematic Exploitation Platform) to access satellite data to detect icebergs and analyze their densities and trajectories.

- “This experience using the Polar TEP cloud-based technology opens the door for future evaluations of a more robust version of the iceberg detection and iceberg trajectory processors,” said Michael Hicks, Chief Scientist of the International Ice Patrol. “Cloud-based technology such as that used by Polar TEP is expected to be an important tool for handling the ever-growing amount of data coming from space.”

- Polar TEP is one of six Thematic Exploitation Platforms developed by ESA to serve data user communities. These cloud-based platforms provide an online environment to access information, processing tools and computing resources for collaboration. TEPs allow knowledge to be extracted from large environmental datasets produced through Europe's Copernicus program and other Earth observation satellites.

Figure 19: Navigating with Polar TEP. Using ESA’s online Polar TEP, the International Ice Patrol accessed satellite data to detect icebergs and analyze their densities and trajectories (image credit: ESA, the image contains modified Copernicus Sentinel data (2017), processed by Polar TEP)

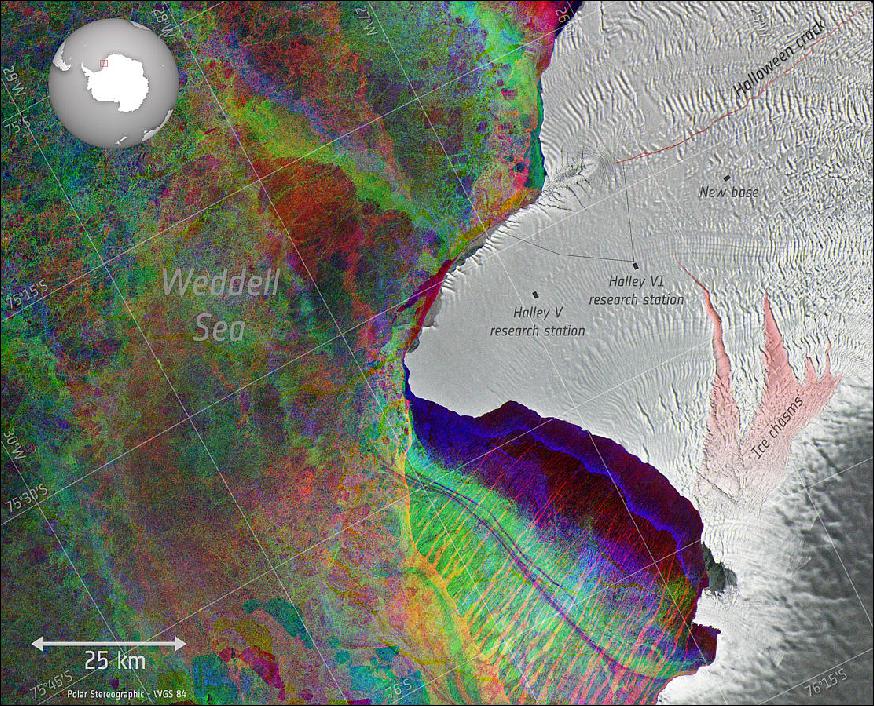
• October 31, 2017: In this image from the Copernicus Sentinel-1 satellite mission, we can see the location of the ‘Halloween crack’ on Antarctica’s Brunt Ice Shelf, highlighted in red. The former and current locations of the British Antarctic Survey’s Halley research stations are also marked. 25)

- Discovered on 31 October 2016, the swiftly lengthening Halloween crack prompted the temporary withdrawal of staff from the Halley VI research station for the duration of the 2017 Antarctic winter. Information from the Copernicus Sentinel-1 and Sentinel-2 satellites helped in making this decision.

- The base had already been moved 23 km inland during last Antarctica’s summer months because another ice chasm (highlighted in red) had begun to show signs of growth.

- In this image of Figure 20, Sentinel-1’s radar was also able to pick up lines in the snow and ice marking the researchers’ routes from the former location of the Halley VI station to the coast and to the Halloween crack. To help us identify them, these lines have been colored in black.

Figure 20: This image was created by combining three Sentinel-1 radar scans in September and October. The colors in the Weddell Sea indicate changes in sea ice between the acquisitions. A ‘polynya’ – an area of open water surrounded by ice – is visible in the lower-central part of the image (image credit: ESA, the image contains modified Copernicus Sentinel data (2017), processed by ESA, CC BY-SA 3.0 IGO)

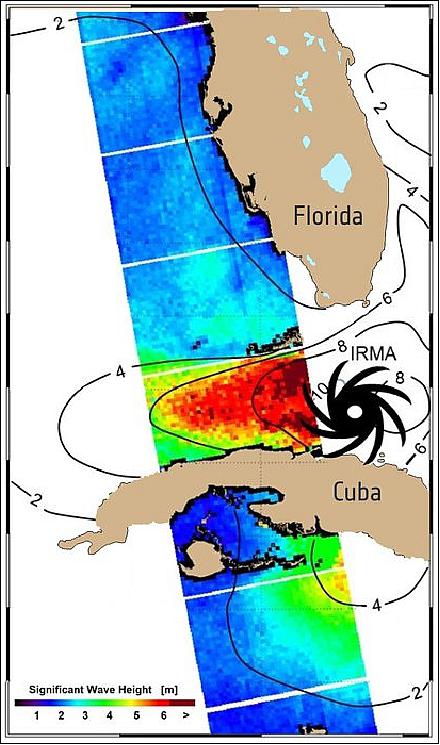
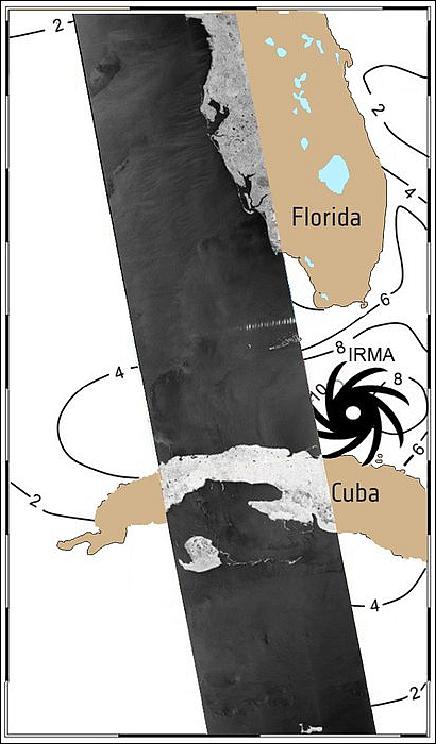
• October 25, 2017: This year’s Atlantic hurricane season has been a harsh reminder of the grief and devastation brought by these vast storms. Imaging the top of hurricanes from space is nothing new, but the Sentinel-1 satellites can see right through these towering spinning weather systems, measuring the sea surface below to help predict the storm’s path. 26)

- The 2017 hurricane season isn’t even over yet, but 10 Atlantic storms in a row have already reached hurricane strength – the first time this has happened in more than a century.

- Since understanding and predicting these powerful weather systems is essential to saving lives and property, scientists have been looking into how the Copernicus Sentinel-1 radar mission can help.

- Information from this state-of-the art mission is used for numerous applications, from monitoring sea ice and marine oil spills to mapping floods and land-surface deformation caused by earthquakes.

- Observing hurricanes wasn’t part of its original remit. Unlike satellites that carry optical instruments, from which we get the familiar images of the top of hurricanes, radar can penetrate clouds to image the sea underneath these powerful and destructive weather systems.

- Taking Sentinel-1 beyond its original scope, scientists at DLR (German Aerospace Center) have developed a technique that allows the radar to probe sea-surface wind and wave heights. - Importantly, this information about the state of the sea can help to assess how destructive a hurricane is and predict its path – and, therefore, where and when it is likely to make landfall. The same information can also be used to warn ships and to issue warnings of coastal flooding.

- This new technique was used for the first time when hurricane Irma struck Cuba and the Florida Keys in early September. Here, waves up to 10 m high were measured.

- Sentinel-1 works in several different operational modes, but it is its ‘wide swath mode’, which is 250 km wide with a resolution of 5 x 20 m, is particularly valuable for understanding ocean waves. This is especially important because in situ measurements of wind and sea state cannot be gained from buoys or dropped probes in such extreme weather or over such a wide area.

- ESA’s Sentinel-1 project manager, Ramón Torres, said, “We see the Sentinel-1 mission being used for many different applications that benefit society, but this is a particularly good example of how the mission could make a real difference to people’s lives. Sentinel-1 is delivering beyond our expectations.”

Figure 21: Wave height during Hurricane Irma. Copernicus Sentinel-1 radar mission images were used to measure waves of up to 10 m high under Hurricane Irma as it struck Cuba and the Florida keys on 9 and 10 September 2017, respectively (image credit: ESA, the image contains modified Copernicus Sentinel data (2017), processed by DLR)
Figure 22: Sentinel-1 radar image under Hurricane Irma (released on 25 Oct. 2017). Scientists at DLR (German Aerospace Center) are using radar images from the Copernicus Sentinel-1 mission to gain information about the wind and waves at the sea surface under hurricanes. This information is not obvious in this image, but novel processing techniques can reveal important information that can be used to assess how destructive a hurricane is and predict its path. This image was acquired on 9 September 2017 under Hurricane Irma as it passed over Cuba (image credit: ESA, the image contains modified Copernicus Sentinel data (2017), processed by DLR)

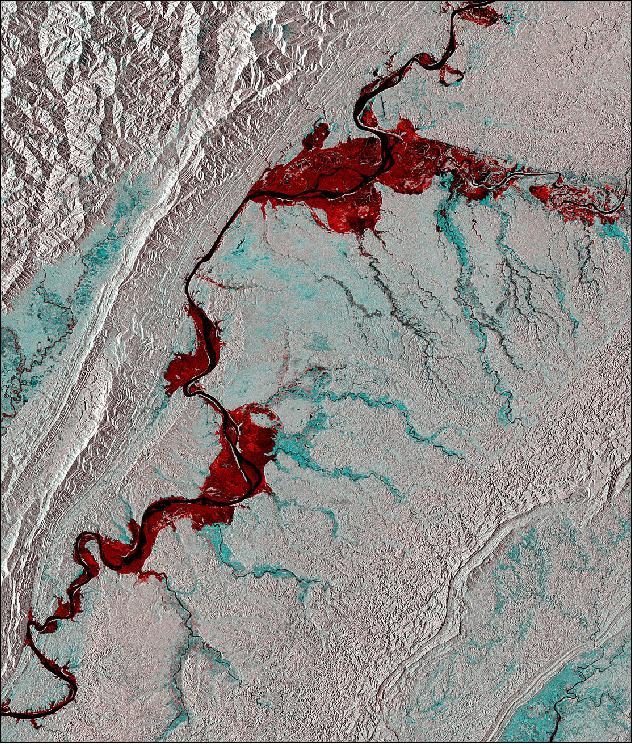
• October 20, 2017: The Copernicus Sentinel-1A satellite brings us over part of the Sagaing Division in northwest Myanmar (formerly Burma), and along the border with India. 27)

- Snaking through the image of Figure 23 is the Chindwin River, which breached its banks during a period of severe flooding in 2015. Monsoon rains beginning that July caused multiple rivers in the region to overflow, causing widespread damage and affecting up to a million people.

- The image was created using two passes by Sentinel-1’s radar. This information was then released in the form of a map under the International Charter Space and Major Disasters to assist relief efforts.

- Currently led by ESA, the Charter is an international collaboration between 16 owners or operators of Earth observation missions. It provides rapid access to satellite data to help disaster management authorities in the event of a natural or man-made disaster.

- Sentinel-1’s radar ability to ‘see’ through clouds, rain and in darkness makes it particularly useful for monitoring floods.

Figure 23: This image was created using two passes by Sentinel-1’s radar: one before the flooding on 20 March 2015 and the other during the event on 4 September 2015. Combining them shows changes between the images, such as the inundation of some 111,000 hectares of land on either sides of the river bank appearing in red (image credit: ESA, the image contains modified Copernicus Sentinel data (2015), processed by ESA, CC BY-SA 3.0 IGO)

• September 28, 2017: A NASA-produced map showing areas of eastern Puerto Rico that were likely damaged by Hurricane Maria has been provided to responding agencies, including FEMA (Federal Emergency Management Agency). The hurricane, a Category 4 storm at landfall on Puerto Rico on Sept. 20, caused widespread damage and numerous casualties on the Caribbean island, an unincorporated U.S. territory with a population of about 3.4 million. 28)

- To assist in disaster response efforts, scientists at NASA's Jet Propulsion Laboratory and Caltech, both in Pasadena, California, obtained and used before-and-after interferometric synthetic aperture radar (InSAR) satellite imagery of areas of Eastern Puerto Rico to identify the areas that are likely damaged. The imagery — acquired before the storm on March 25, 2017 and again one day after landfall on Sept. 21, 2017 — is from the radar instruments on the Copernicus Sentinel-1 satellites operated by the European Space Agency.

- The views indicate the extent of likely damage caused by the hurricane, based on changes to the ground surface detected by radar. The color variations from yellow to red indicate increasingly more significant ground and building surface change. The map is used as guidance to identify potentially damaged areas and may be less reliable over vegetated and flooded areas.

- The radar data were processed by the ARIA (Advanced Rapid Imaging and Analysis) team at JPL and Caltech. ARIA is a NASA-funded project that is building an automated system for demonstrating the ability to rapidly and reliably provide GPS and radar satellite data to support local, national and international hazard-monitoring and response communities. InSAR can "see" through clouds and is sensitive to changes in the roughness of the ground or building surfaces.

- Using space-based radar imagery of disasters, ARIA data products can aid responders in making rapid assessments of the geographic region affected by a disaster, as well as detailed imaging of locations where damage occurred.

Figure 24: NASA/JPL-Caltech-produced map of damage in and around San Juan, Puerto Rico (orange inset box) from Hurricane Maria, based on ground and building surface changes detected by ESA satellites. Color variations from yellow to red indicate increasingly more significant ground and building surface change (image credit: NASA-JPL/Caltech/ESA/Copernicus/Google)

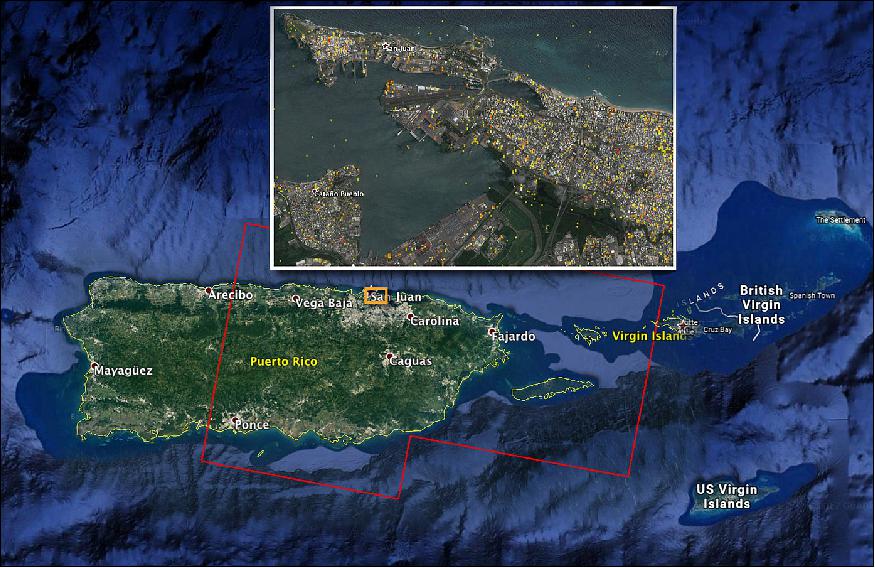
Legend to Figure 24: The map is derived from SAR (Synthetic Aperture Radar) images from the Copernicus Sentinel-1A and Sentinel-1B satellites, operated by the ESA. The images were taken before (March 25, 2017) and after (Sept. 21, 2017) the storm's landfall. The map was delivered to responding agencies, including FEMA (Federal Emergency Management Agency), on Sept. 22, 2017. FEMA combined the map with building infrastructure data to estimate a damage density map, which was sent to its Urban Search and Rescue teams in the field in Puerto Rico. 29)

The map covers an area of 169 x 96 km, shown by the large red polygon in the figure. The inset, denoted by the orange rectangle, shows the extent of damage in and around the capital city of San Juan. Each pixel measures about 30 m across. The color variation from yellow to red indicates increasingly more significant ground surface change. Preliminary validation was done by comparing the map with anecdotal reports of damage. This damage proxy map should be used as guidance to identify damaged areas, and may be less reliable over vegetated and flooded areas. Sentinel-1 data were accessed through the Copernicus Open Access Hub. The image contains modified Copernicus Sentinel data (2017), processed by ESA and analyzed by the NASA-JPL/Caltech ARIA team. This research was carried out at JPL under a contract with NASA.

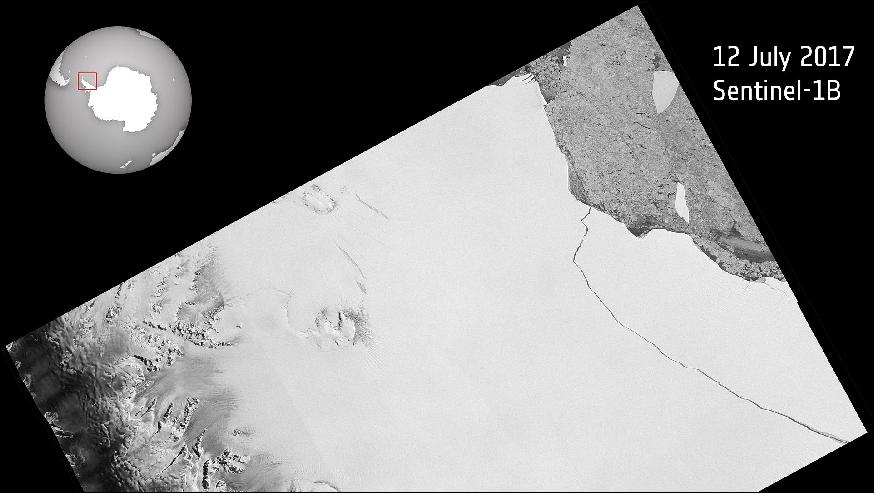
• September 20, 2017: Witnessed by the Copernicus Sentinel-1 mission on 12 July 2017, a lump of ice more than twice the size of Luxembourg broke off the Larsen C ice shelf, spawning one of the largest icebergs on record and changing the outline of the Antarctic Peninsula forever. Over the following two months, systematic observations from Sentinel-1 showed that the A68 berg remained close, buffeting back and forth against the ice shelf. It was unclear what would happen to the berg because they can remain in one place for years. 30)

- However, the mission has revealed that A68 is now on the move and drifting out to sea. Images from 16 September show that there is a gap of about 18 km as the berg appears to be turning away from the shelf.

Figure 25: Until a few days ago, the huge chunk of ice that broke off Antarctica’s ice shelf in July has remained close, buffeting back and forth against the shelf. A68 is now on the move and drifting out to sea (image credit: ESA, the image contains modified Copernicus Sentinel data (2017), processed by ESA, CC BY-SA 3.0 IGO)

• August 17, 2017: For the first time in India, a state government is using satellites to assess lost crops so that farmers can benefit from speedy insurance payouts. — The southern Indian state of Tamil Nadu is home to around 68 million people, of which almost a million are rice farmers. However, Tamil Nadu is facing the worst drought in 140 years, leading to the land being too dry for paddy fields, lost yield, widespread misery and unrest. 31)

- The Copernicus Sentinel-1 radar mission has been used to alleviate a little of the suffering by providing evidence of damaged land and failed crops so that the Agricultural Insurance Company of India can compensate farmers as quickly as possible. So far, more than 200 000 farmers have received payouts.

- Malay Kumar Poddar, the company’s general manager, said, “Assessing damages based on remote-sensing technology is introducing much objectivity into the crop insurance program. “Beyond the area loss assessment, we are also keen to apply the technology to assess actual yields at the end of the season.”

- Satellites carrying optical cameras can provide images of Earth’s surface only in daylight and in the absence of cloud, but the Sentinel-1 satellites carry radar which works regardless. This makes it an ideal mission to use in tropical and subtropical regions, which are often cloudy.

- Sentinel-1 radar imagery combined with rice-yield modelling is at the heart of the German–Swiss RIICE (Remote-Sensing based Information and Insurance for Crops in Emerging Economies initiative). — Francesco Holecz, from sarmap, set up the service in collaboration with the International Rice Research Institute, RIICE partners, Indian authorities and universities. He said, “The reliable repetitiveness of the Sentinels, their short revisit intervals, the free, quick and easy access to the products and the high quality of the data have contributed a lot to the practicability of satellite-based rice monitoring systems.”

- Gagandeep Singh Bedi, agricultural production commissioner and principle secretary to the government in Tamil Nadu added, “RIICE remote-sensing technology allows us to assess crop loss and damages in a more transparent and timely manner. “It was particularly useful during the last cropping season to identify villages that had been hit by drought, and farmers benefited from the technology by getting claims in a record time.”

- The research network is also working with partners in other countries to develop the method further. For example, the Tamil Nadu Agricultural University and the International Rice Research Institute in the Philippines are looking to use it to assess yields at the end of the season. Sellaperumal Pazhanivelan, from the university, said, “We believe that this technology can help the state governments to obtain objective and transparent data on actual rice yields so that farmers affected by natural hazards can be identified quickly.”

Figure 26: Assessing rice crops with Sentinel-1: Using radar data from the Copernicus Sentinel-1 mission, areas where rice is grown in the southern Indian state of Tamil Nadu can be assessed. Light blue to magenta colors represent cultivated fields and light to dark green represents forests (image credit: ESA, the image contains modified Copernicus Sentinel data (2016), processed by RIICE/TNAU)

• July 12, 2017: Over the last few months, a chunk of Antarctica’s Larsen C ice shelf has been hanging on precariously as a deep crack cut across the ice. Witnessed by the Copernicus Sentinel-1mission, a lump of ice more than twice the size of Luxembourg has now broken off, spawning one of the largest icebergs on record and changing the outline of the Antarctic Peninsula forever. 32)

- The fissure first appeared several years ago, but seemed relatively stable until January 2016, when it began to lengthen.

- In January 2017 alone it travelled 20 km, reaching a total length of about 175 km.

- After a few weeks of calm, the rift propagated a further 16 km at the end of May, and then extended further at the end of June.

- More importantly, as the crack grew, it branched off towards the edge of the shelf, whereas before it had been running parallel to the Weddell Sea. With just a few km between the end of the fissure and the ocean by early July, the fate of the shelf was sealed.

- Scientists from Project MIDAS, an Antarctic research consortium led by Swansea University in the UK, used radar images from the Copernicus Sentinel-1 mission to keep a close eye on the rapidly changing situation.

- Since Antarctica is heading into the dark winter months, radar images are indispensable because, apart from the region being remote, radar continues to deliver images regardless of the dark and bad weather.

- Adrian Luckman, leading MIDAS, said, “The recent development in satellite systems like Sentinel-1 has vastly improved our ability to monitor events such as this.”

Figure 27: Witnessed by the Copernicus Sentinel-1 mission on 12 July 2017, a lump of ice more than twice the size of Luxembourg has broken off the Larsen-C ice shelf, spawning one of the largest icebergs on record and changing the outline of the Antarctic Peninsula forever. The iceberg weighs more than a million million tons and contains almost as much water as Lake Ontario in North America. Since the ice shelf is already floating, this giant iceberg will not affect sea level. However, because ice shelves are connected to the glaciers and ice streams on the mainland and so play an important role in ‘buttressing’ the ice as it creeps seaward, effectively slowing the flow. If large portions of an ice shelf are removed by calving, the inflow of glaciers can speed up and contribute to sea-level rise. About 10% of the Larsen C shelf has now gone (image credit: ESA, the image contains modified Copernicus Sentinel data (2017), processed by ESA, CC BY-SA 3.0 IGO)

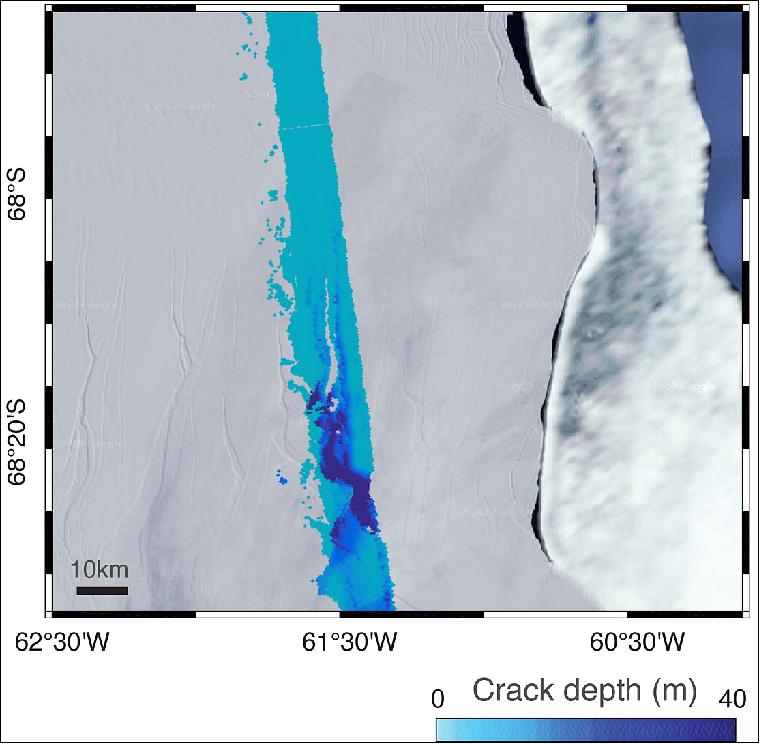
- Noel Gourmelen from the University of Edinburgh added. “We have been using information from ESA’s CryoSat-2 mission, which carries a radar altimeter to measure the surface height and thickness of the ice, to reveal that the crack was several tens of meters deep.”

- As predicted, a section of Larsen C – about 6000 km2 – finally broke away as part of the natural cycle of iceberg calving. The behemoth iceberg weighs more than a million million tons and contains about the same amount of water as Lake Ontario in North America.

- “We have been expecting this for months, but the rapidity of the final rift advance was still a bit of a surprise. We will continue to monitor both the impact of this calving event on the Larsen C ice shelf, and the fate of this huge iceberg,” added Prof. Luckman.

- The iceberg’s progress is difficult to predict. It may remain in the area for decades, but if it breaks up, parts may drift north into warmer waters. Since the ice shelf is already floating, this giant iceberg does not influence sea level.

Figure 28: ESA’s CryoSat-2 mission measured the depth of the crack in the Larsen C ice shelf, which led to the birth of one of the largest icebergs on record. Carrying a radar altimeter to measure the surface height and thickness of the ice, the mission revealed that the crack was several tens of meters deep (image credit: University of Edinburgh) 33)

- With the calving of the iceberg, about 10% of the area of the ice shelf has been removed.

- The loss of such a large piece is of interest because ice shelves along the peninsula play an important role in ‘buttressing’ glaciers that feed ice seaward, effectively slowing their flow.

- Previous events further north on the Larsen A and B shelves, captured by ESA’s ERS and Envisat satellites, indicate that when a large portion of an ice shelf is lost, the flow of glaciers behind can accelerate, contributing to sea-level rise.

- Thanks to Europe’s Copernicus environmental monitoring program, we have the Sentinel satellites to deliver essential information about what’s happening to our planet. This is especially important for monitoring remote inaccessible regions like the poles.

- ESA’s Mark Drinkwater said, “Having the Copernicus Sentinels in combination with research missions like CryoSat-2 is essential for monitoring ice volume changes in response to climate warming. In particular, the combination of year-round data from these microwave-based satellite tools provides critical information with which to understand ice-shelf fracture mechanics and changes in dynamic integrity of Antarctic ice shelves.”

• June 13, 2017: On 20 May, over a million tons of dirt and rock buried part of California’s Highway 1 along the Pacific coastline in the state’s Big Sur region. In addition to cutting off the route, the landslide added some 5 hectares of land to the shoreline. — Sentinel-1’s radar shows that the ground that slid down the mountain was moving in the two years before the landslide. 34)

Figure 29: The Sentinel-1 radar data were processed using Small Baseline Subset interferometry (SBAS), a technique that can detect and monitor movements over wide areas with high sensitivity. In this image, red dots represent points where the ground was moving away from the satellite at a rate of more than 70 mm per year. Green dots show stable ground in the surrounding area (image credit: ESA, the image contains modified Copernicus Sentinel data (2015–17), processed by Norut)

• May 12, 2017: Rapid acceleration of an Arctic glacier over the past year has been detected by the Copernicus Sentinel-1 satellites. Sitting on Norway’s Spitsbergen island in the Svalbard archipelago, the Negribreen glacier has recently seen a surge in ice surface speed, increasing from 1 m to 13 m a day over the winter. 35)

- When a glacier ‘surges’ a large amount of ice flows to the end in an unusually short time. While the causes are not completely understood, they are believed to be linked to changes in the amount of heat or water in the lowest layers of the glaciers.

- The last time Negribreen experienced a surge like this was in the 1930s, as documented in aerial photographs. At that time, it advanced almost 12 km into the fjord in one year along a 15 km-wide section of the front. Since then the front of the glacier had been steadily retreating, with large icebergs breaking off.

- This latest jump in speed began in July 2016 and has been climbing ever since – even over the cold winter months. - Monitoring glaciers in areas prone to bad weather and long periods of darkness – like the Arctic – was difficult before the advent of satellites. Radar satellites can ‘see’ through clouds and in the dark, and Sentinel-1 offers frequent and systematic coverage of the Arctic.

- A team of scientists working under ESA’s Climate Change Initiative in the Glaciers_cci project are using satellite radar and optical coverage to map glaciers at different times and determine their changes in extent, elevation and speed.

Figure 30: Radar images from the Copernicus Sentinel-1 mission show the sudden advance of the Negribreen glacier in Norway in early 2017 [image credit: ESA, the image contains modified Copernicus Sentinel data (2016–17), processed by T. Strozzi (Gamma)]

- A team of scientists working under ESA’s Climate Change Initiative in the Glaciers_cci project are using satellite radar and optical coverage to map glaciers at different times and determine their changes in extent, elevation and speed.

- “Sentinel-1 provides us with a near-realtime overview of glacier flow across the Arctic, remarkably augmenting our capacity to capture the evolution of glacier surges,” said Tazio Strozzi from Swiss company Gamma Remote Sensing and scientist on Glaciers_cci.

- “This new information can be used to refine numerical models of glacier surging to help predict the temporal evolution of the contribution of Arctic glaciers to sea-level rise.”

Figure 31: Radar images from the Copernicus Sentinel-1 mission were used to create these two ice speed maps of the Negribreen glacier in Norway. In October 2015, only the front of the glacier was moving by more than 300 m a year. By late 2016, the entire glacier was advancing at this accelerated rate.

• May 2, 2017: Over two decades of observations by five radar satellites show the acceleration of ice loss of 30 glaciers in Antarctica’s Western Palmer Land in the southwest Antarctic. 36)

- Radar is particularly suited for monitoring polar regions that are prone to bad weather and long periods of darkness because it can collect information regardless of cloud cover, day or night. Mapping 30 glaciers in the region, the research team found that between 1992 and 2016, most of the glaciers sped up by 20 and 30 cm per day. This is equivalent to an average 13% increase in flow speed across the area as a whole (Figure 32).

- The study in Geophysical Research Letters combines over 24 years of radar data from satellites including ESA’s Envisat and ERS missions, as well as from the Copernicus Sentinel-1 mission. 37)

- A decrease in the mass and volume of Western Palmer Land has raised the prospect that ice speed has increased in this marine-based sector of Antarctica. To assess this possibility, we measure ice velocity over 25 years using satellite imagery and an optimized modelling approach. More than 30 unnamed outlet glaciers drain the 800 km coastline of Western Palmer Land at speeds ranging from 0.5 to 2.5 m/day, interspersed with near-stagnant ice. Between 1992 and 2015, most of the outlet glaciers sped up by 0.2 to 0.3 m/day, leading to a 13 % increase in ice flow and a 15 km3/yr increase in ice discharge across the sector as a whole. Speedup is greatest where glaciers are grounded more than 300 m below sea level, consistent with a loss of buttressing caused by ice shelf thinning in a region of shoaling warm circumpolar water.

- The two-satellite Sentinel-1 mission for Europe’s Copernicus program routinely monitors polar areas at a high resolution, continuing the long-term data record from European satellites.


Figure 32: Ice speed in the Western Palmer Land measured by the Copernicus Sentinel-1 mission between 2014 and 2016 (image credit: ESA, the image contains modified Copernicus Sentinel data (2014-16), processed by J. Wuite, ENVEO)

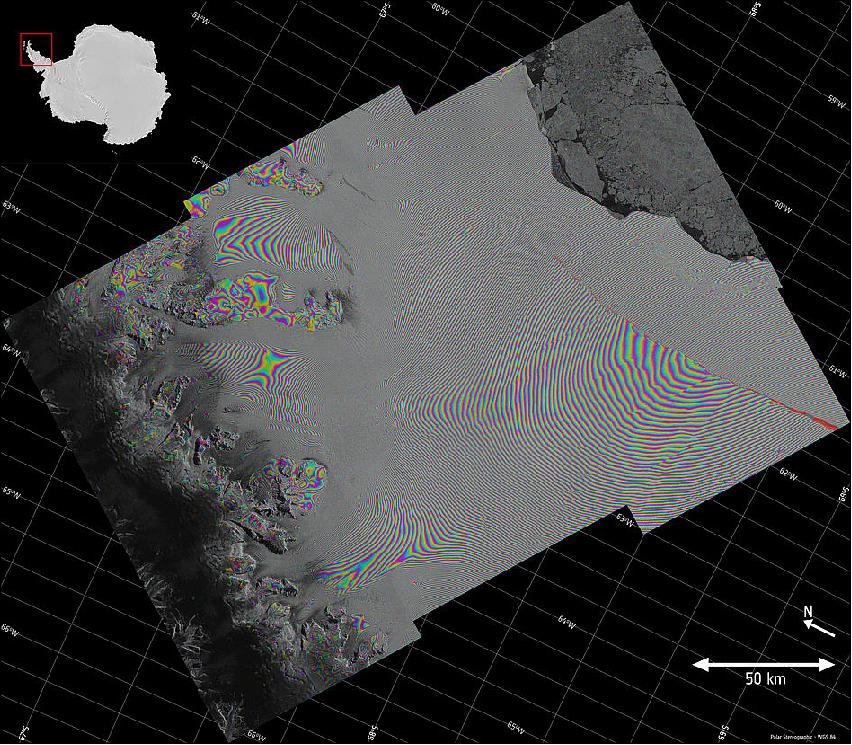
• April 20, 2017: Two Sentinel-1 radar images from 7 and 14 April 2017 were combined to create this interferogram showing the growing crack in Antarctica’s Larsen-C ice shelf (Figure 33). Polar scientist Anna Hogg said: “We can measure the iceberg crack propagation much more accurately when using the precise surface deformation information from an interferogram like this, rather than the amplitude – or black and white – image alone where the crack may not always be visible.” 38)

- When the ice shelf calves this iceberg it will be one of the largest ever recorded – but exactly how long this will take is difficult to predict. The sensitivity of ice shelves to climate change has already been observed on the neighboring Larsen-A and Larsen-B ice shelves, both of which collapsed in 1995 and 2002, respectively.

- These ice shelves are important because they act as buttresses, holding back the ice that flows towards the sea.

Figure 33: Larsen-C crack interferogram of Sentinel-1 showing the growing crack of the Larsen-C ice shelf (image credit: ESA, the image contains modified Copernicus Sentinel data (2017), processed by A. Hogg/CPOM/Priestly Centre, CC BY-SA 3.0 IGO)

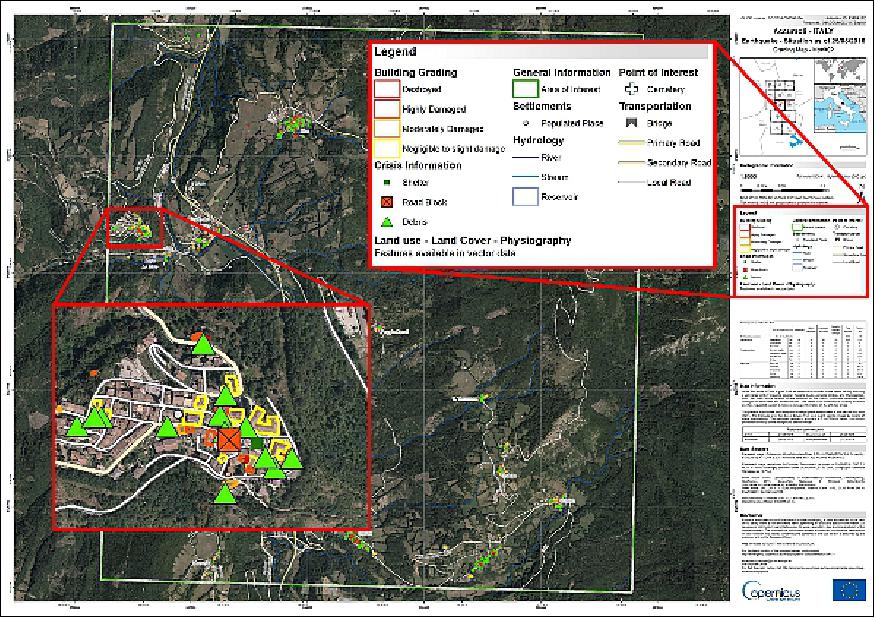
• April 21, 2017: Earthquake Emergency Management Service in Italy. — A series of strong earthquakes struck Central Italy starting in August 2016, killing over 300 people, injuring some 360 and leaving over 2000 without homes. The Copernicus Emergency Management service was activated by the Italian Civil Protection authorities during this period and produced a total of 120 maps of the damaged areas, supporting their decision-making, rescue and aid delivery activities during these disastrous events. 39)

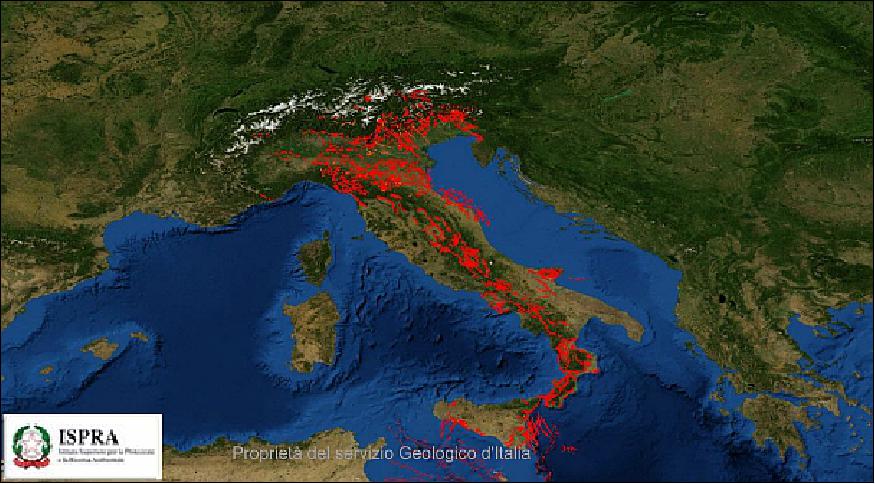
- Susceptible tectonics: Italy’s tectonic and geological characteristics make it a country which is particularly susceptible to the risk of major earthquakes. It straddles the boundary between the Eurasian and African tectonic plates in the south, and a complex series of fault lines run down the entire length of the country along the Apennine mountain chain, collectively known as the Apennine fault. This geological “spine” is clearly visible in the map below, produced by the Italian National Institute for Environmental Protection and Research, ISPRA (Istituto Superiore per la Protezione e la Ricerca Ambientale).

Figure 34: Map of capable fault lines in Italy. “Capable” faults are defined as having “significant potential for displacement at or near the ground surface”(image credit: ISPRA)

- A series of major earthquakes: During the period between the end of August 2016 and January 2017, a series of significant earthquakes ravaged Central Italy:

1) 24 August 2016: A large earthquake measuring 6.2 Mw (Moment magnitude scale) struck Central Italy in the early hours of the morning.

2) 26 October 2016: Two months later, the Marche region was hit by two major earthquakes on the same day, measuring 5.4 and 5.9 Mw, respectively. Within a week, Umbria suffered a massive 6.5 Mw earthquake.

3) 18 January 2017: A set of large earthquakes struck Lazio and Abruzzo, of which the largest measured 5.7 Mw.

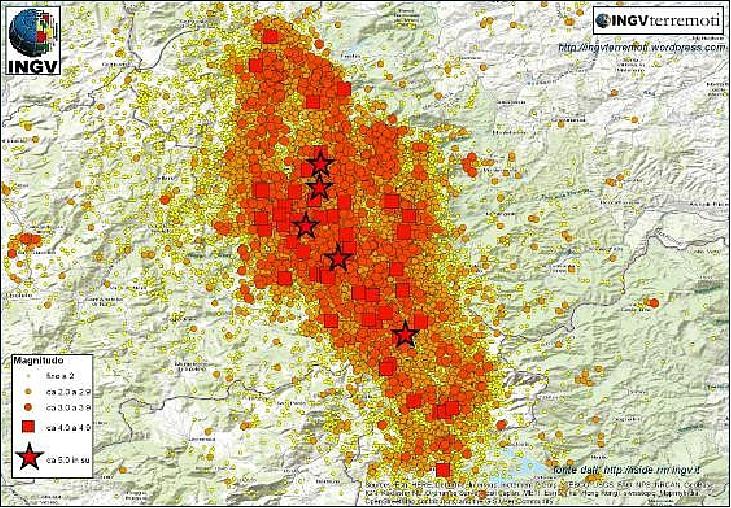
Large earthquakes are usually accompanied by large numbers of smaller shocks of varying intensity, some occurring prior to the main quake. These smaller events can amplify the destruction of the main tremor by further weakening already damaged buildings and infrastructure. The Italian Institute for Geophysics and Volcanology, INGV (Istituto Nazionale di Geofisica e Vulcanologia) maintains a network of sensors across Italy to measure earthquakes. The map (Figure 35) shows the earthquakes recorded by INGV in the regions of Central Italy between August 2016 and February 2017; the total number registered exceeds 45.000, and the sheer quantity and density of the events is overwhelmingly apparent.

Figure 35: Map of the over 45.000 seismological events recorded by INGV over Central Italy between August 2016 and February 2017. In total, these earthquakes claimed the lives of over 300 people, injured around 360, and caused the temporary displacement of some 2000 citizens from their damaged homes (image credit: INGV)

The earthquake on 24 August 2016 struck at 1:36 (CET) in the morning, with its epicenter closest to the towns of Amatrice, Accumoli and Pescara del Tronto. It sent shock waves rippling over a very large area spanning several of Italy’s regions (Lazio, Abruzzo, Umbria, Perugia) and municipalities. Almost 300 people lost their lives, and thousands of buildings were damaged.

The Italian Civil Protection Department, DPC (Dipartimento della Protezione Civile) activated the Copernicus EMS (Emergency Management Service) Rapid Mapping component a few hours later. The quake and its aftershocks had unleashed waves of destruction over a very large rural area, dotted with small towns and remote settlements of varying sizes. These villages are not very well-connected, in many cases accessible only via one or two roads. Several of them lie on the slopes of the Apennine mountains, which further complicates access.

The immediate challenges facing the authorities were to understand the severity of the damages in the various settlements, so as to be able to direct rescue services where they would be most needed, to assess whether people would be able to return safely to their homes, and to locate blocked roads and access routes, to which clearance teams should be urgently dispatched.

In support of this kind of decision-making, the Copernicus EMS provides “grading” maps: rapid assessments of the impact of damages, made by comparing pre- and post-event satellite images. The map below is an example of one of the grading maps produced in the area around the village of Accumoli and delivered to local emergency management authorities rapidly after the quake. This map, along with some 60 others of its type produced during the activation, supported the authorities in making informed decisions about the locations in the most urgent need of intervention (Figure 36). Debris and roadblocks are indicated, as are damaged buildings, marked to show the extent of the damage. The small settlements scattered across the landscape are notable, as are the few roads which connect them.

To be able to inform citizens about whether their homes are safe or not, it was necessary for the authorities to conduct ground surveys to establish that buildings comply with safety standards. The satellite imagery made it possible to prioritize ground survey deployments: if damage to a building is visible from a satellite, then it is not safe for habitation, but ground surveys can then be dispatched to nearby buildings to check whether they are compliant. Visual inspection of potentially damaged buildings must be carried out before they can be declared safe and habitable.

Along with re-homing citizens, the Civil Protection Authorities needed to plan for setting up temporary camps at appropriate locations, which should be large enough to accommodate displaced families in the area. Satellite images can be used for this purpose, and Copernicus Emergency Management Service products include a short report alongside the damage maps with estimates of the affected population, roads and settlements.

A range of tools at the service of the citizen: Satellite imagery is very well-suited for quickly making broad assessments of damage, for calculating requirements for temporary accommodation, and, in general, for taking stock of an unfolding situation over large areas. But there are limitations to what can be seen from a satellite, which usually captures images from directly overhead. Damage to the roofs of buildings is identifiable, as is debris lying next to buildings or in the roads – which is an indicator of structural damages. But damage to the facades of a building, for example, cannot be directly perceived. Factors such as cloudiness and atmospheric haze can also prevent the effective use of satellite imagery, and if the structures being examined are too small, this places a limit on the accuracy of the damage assessment which can be obtained using satellite imagery. For these reasons, a pilot study is currently underway for the Copernicus Emergency Management Service, investigating the potential of deploying manned and unmanned aerial systems (UAS) for acquiring imagery in support of emergency management actors. The use of aerial images can supplement satellite data, providing higher resolution imagery and, since they can fly underneath the cloud line, mitigating the problems associated with bad weather.

In summary, the Copernicus EMS activations over Central Italy generated 120 maps for the Italian Civil Protection Department to guide their decision-making, aid delivery and rescue efforts throughout the course of the unrelenting series of earthquakes which tore through the region starting in August 2016.

In the days and weeks following the quakes, Copernicus Sentinel-1 data was used by researchers at the Italian National Research Council and at the National Observatory of Athens to generate deformation maps of two of the affected regions, showing the extent of the Earth’s movement during the earthquakes and providing valuable insights into the cause of their origins.

Table 1: Rapidly mapping the damages: the Copernicus Emergency Management Service (Ref. 39)
Figure 36: Copernicus EMS Grading Map (Monitoring) of Accumoli, Italy. The village of Accumoli is shown in the zoomed inset, and the map legend has been enlarged for readability. The small, widely spaced settlements are visible (image credit: Copernicus Emergency Management Service)

• April 7, 2017: EMSA (European Maritime Safety Agency), based in Lisbon, Portugal, provides technical assistance and support to the European Commission and Member States, amongst others, in the development and implementation of EU maritime legislation. Its mission is to ensure a high, uniform and effective level of maritime safety, maritime security, prevention of and response to pollution from ships, as well as response to marine pollution caused by oil and gas installations. 40)

- Satellites, with their sophisticated sensors, provide routine, cost-effective, wide-area surveillance over maritime zones. Furthermore, they can be pointed to a targeted location for monitoring specific operations and gather material in response to intelligence information. Earth observation contributes to maritime surveillance to help manage the actions and events that can have an impact on maritime safety and security, including marine pollution, accident and disaster response, search and rescue, as well as fisheries control.

- EMSA also operates CleanSeaNet, a satellite-based oil spill surveillance and vessel detection service. It offers assistance to participating States for the following activities:

1) identifying and tracing oil pollution on the sea surface

2) monitoring accidental pollution during emergencies

3) contributing to the identification of polluters.

- The CleanSeaNet service is based on radar satellite images, covering all European sea areas, which are analyzed in order to detect possible oil spills on the sea surface. When a possible oil spill is detected in national waters, an alert message is delivered to the relevant country. Analyzed images are available to national contact points within 30 minutes of the satellite passing overhead. Approximately 2,000 images are ordered and analyzed per year.

- The service, which is integrated into national and regional pollution response chains, aims to strengthen operational responses to accidental and deliberate discharges from ships, and assist participating States to locate and identify polluters in areas under their jurisdiction.

- Each coastal State has access to the CleanSeaNet service through a dedicated user interface, which enables them to view ordered images. Users can also access a wide range of supplementary information through the interface, such as oil drift modelling (forecasting and backtracking), optical images, and oceanographic and meteorological information.

- SAR satellite images cannot provide information on the nature of a spill (for instance whether it is mineral oil, fish or vegetable oil, or other), but spills from vessels often appear as long, linear dark lines (indicating a substance discharging as the vessel is moving), with a bright spot (the vessel) at the tip. Vessel detection is also available through the CleanSeaNet service. If a vessel is detected in a satellite image, its identity can often be determined by correlating the satellite data with vessel positioning reports from the European monitoring systems operated at EMSA, such as SafeSeaNet.

- The Sentinel-1 mission supports detection of illegal oil spills. 41)

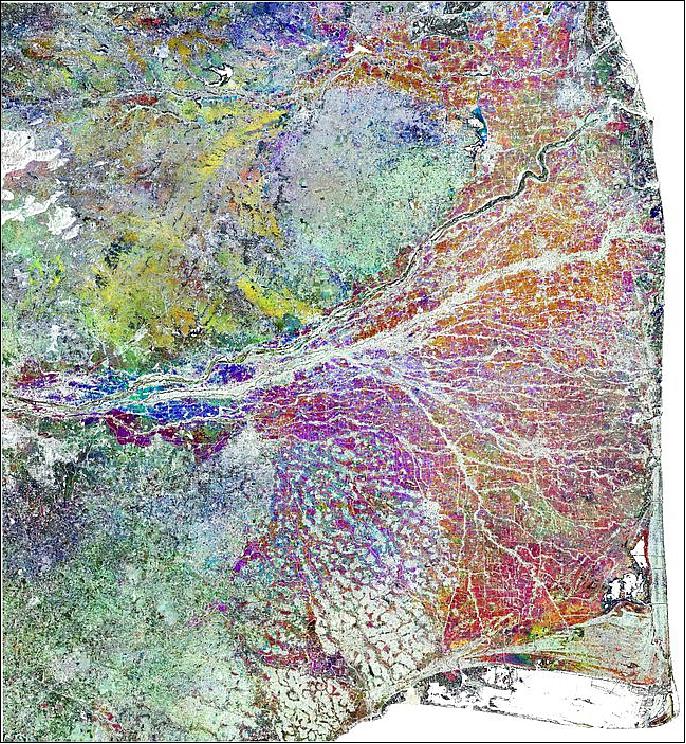
• April 4, 2017: A new processing tool has been developed to bundle information contained in large amounts of satellite data, paving the way for the wealth of Copernicus Sentinel satellite data to be more easily incorporated into online environment-monitoring services. ESA’s online U-TEP (Urban Thematic Exploitation Platform) makes information from satellite data available for the non-expert user for urban environment monitoring.

To do this, it processes hundreds of terabytes of data gathered by Earth-observing satellites, and translates them into easy-to-use products for scientists, urban planners and decision-makers.

U-TEP reached a milestone recently with the integration of some 450 000 scenes from the US Landsat-8 mission acquired between 2013 and 2015. The 500 TB was reduced to about 25 TB thanks to the TimeScan processor developed by the DLR (German Aerospace Center). The resulting TimeScan Landsat 2015 product is already available on the U-TEP geobrowser.

This novel tool that distils a single information product from a multitude of satellite scenes is a step towards more efficient access, processing and analysis of the massive amount of high-resolution image data provided by the latest satellites.

The Copernicus Sentinel satellites, for example, are supplying an unprecedented wealth of measurements. By the end of 2017, the operational Sentinel-1, -2 and -3 satellites alone will continuously collect a daily volume of about 20 TB of open and free satellite imagery.

In the past, users had to individually download and process data on their own computers. Now, mass data can be directly archived and processed at the point of reception for maximum speed and efficiency.

Within U-TEP, user algorithms are brought to the data where they run in cloud computing environments. This avoids the transfer of large amounts of input data and makes it unnecessary for the individual user to set up inhouse computing services.

In the near future, the TimeScan approach will be used by the U-TEP team to process both Landsat optical imagery and Sentinel-1 radar data to automatically map human settlements with unprecedented precision: 10 m resolution. This will help entities such as scientists, urban planners, environmental agencies or development banks to better understand urbanization, as well as respond to the challenges posed by growing cities, population increase, climate change and loss of biodiversity.

The data processed by TimeScan will not only benefit urban monitoring, but also land use/land cover mapping, agriculture, forestry, the monitoring of polar and coastal regions, risk management and disaster prevention, or natural resource management.

The TimeScan processor is being used at the DLR, IT4Innovation and Brockmann Consult processing centers to create products based on Sentinel-1, Sentinel-2 and Landsat data.

U-TEP is one of six Thematic Exploitation Platforms developed by ESA to serve data user communities. These cloud-based platforms provide an online environment to access information, processing tools and computing resources for collaboration. TEPs allow knowledge to be extracted from large environmental datasets produced through Europe's Copernicus program and other Earth observation satellites.

Table 2: Urban monitoring boosted by new data processor 42)
Figure 37: Sentinel-1 TimeScan product: of Germany derived from more than 1500 scans by Sentinel-1 between May 2014 and July 2016 (image credit: DLR, the image contains modified Copernicus Sentinel data (2014-16), processed by DLR) 43)

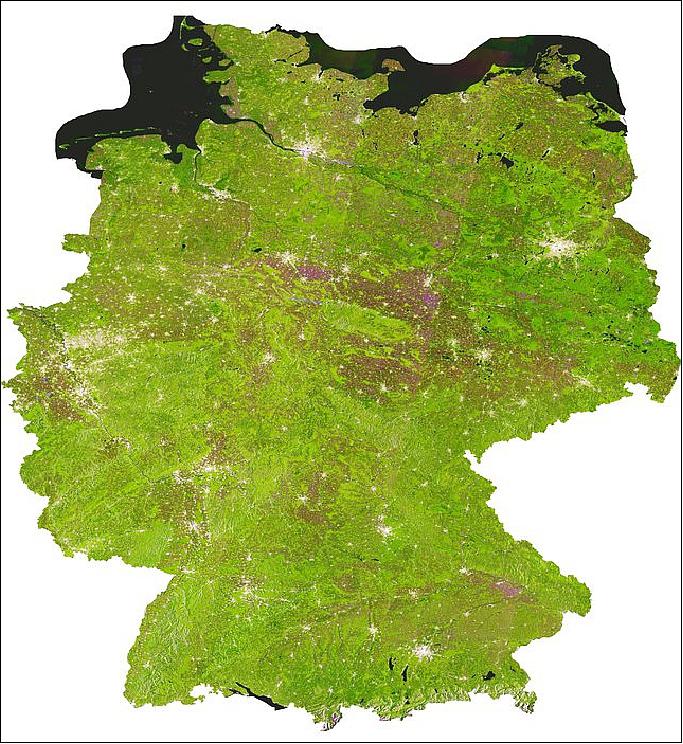
Legend to Figure 37: In the false-color image, the temporal average, minimal and maximal backscattering values are represented for every pixel in the red, green and blue bands. Urban conglomerations, for example, reflect strongly and appear as prominent, bright areas. Water bodies deflect a large proportion of the oblique synthetic aperture radar beams from the satellite and are therefore dark. Vegetated regions are distinguished by comparatively high minimal backscatter, which causes forests and meadows to appear in green tones. Temporally dynamic land cover types, such as crop acreage, have changed considerably during the acquisition period and appear lilac in the data product.

Figure 38: TimeScan product: Pearl River Delta (image credit: DLR) 44)

Legend to Figure 38: This animation shows the TimeScan Landsat data derived for the Pearl River delta in China for 2002–03 and 2014–15. The illustrated TimeScan RGB images are composed of the temporal maximum built-up index in red, the maximum vegetation index in green and the temporal mean value of the water index in blue. A specific image analysis algorithm developed by DLR in ESA’s SAR4Urban project uses the TimeScan data to map the extent of the built-up area (highlighted in black in the animation) in order to finally pinpoint the urban growth that took place in the region over the last 10 years.

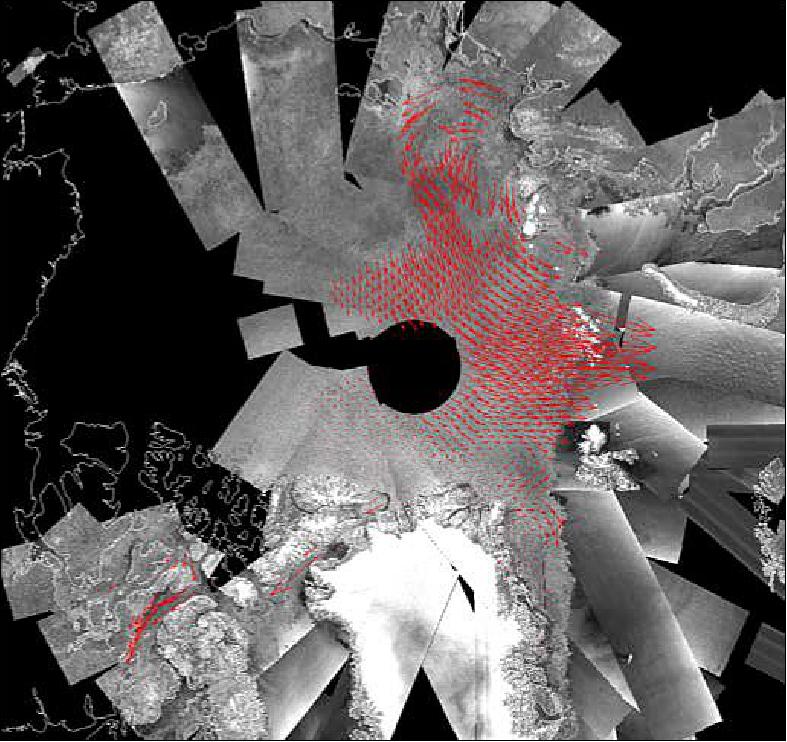
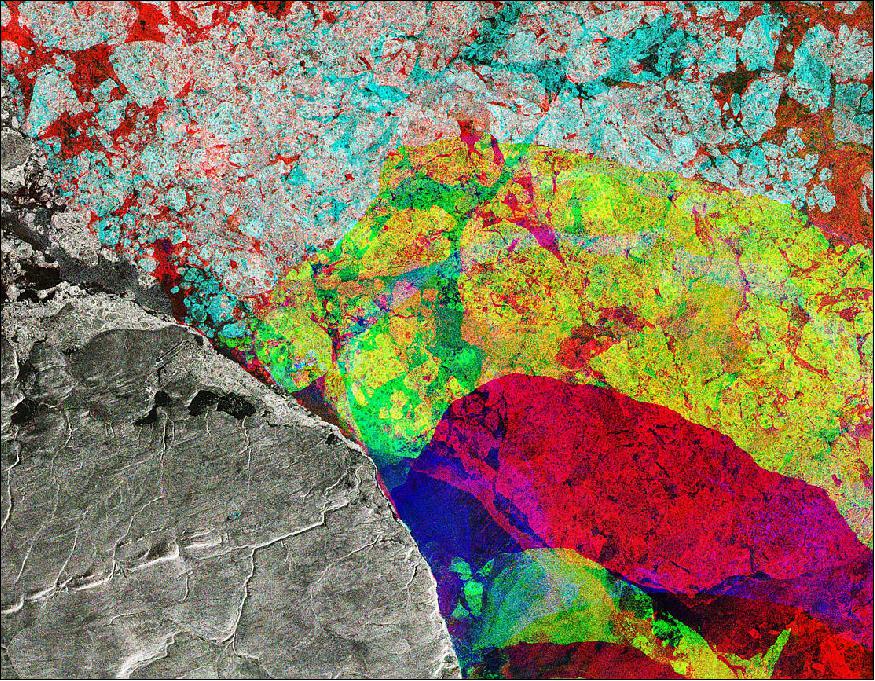
• March 31, 2017: This Sentinel-1 radar composite image (Figure 39) takes us to the northeastern tip of Ellesmere Island (lower-left), where the Nares Strait opens up into the Lincoln Sea in the Canadian Arctic. 45)

- The image was created by combining three radar scans from Copernicus Sentinel-1 captured in December, January and February. Each image has been assigned a color – red, green and blue – and create this colorful composite when combined. Colors show changes between acquisitions, such as the movement of ice in the Lincoln Sea, while the static landmass is grey. - The obvious distinction between the red and yellow depicts how the ice cover has changed over the three months.

- The maximum extent of Arctic sea ice hit a record low this winter. Scientists attribute the reduced ice cover to a very warm autumn and winter, exacerbated by a number of extreme winter ‘heat waves’ over the Arctic Ocean.

- In the center-left on the land, we can see a straight, dark link with a circle at its left end. This is the runway for Alert – the northernmost known settlement in the world. Inhabited mainly by military and scientific personnel on rotation, Alert is about 800 km from the North Pole.

- A team of researchers on the CryoVex/Karen campaign was recently in Alert validating sea-ice thickness measurements from the CryoSat-2 satellite and testing future satellite mission concepts. 46)

- Taking off from Alert, the team flew two aircraft equipped with instruments that measure sea-ice thickness at the same time the CryoSat-2 satellite flew some 700 km overhead. The measurements from the airborne campaign will be compared to the satellite measurements in order to confirm the satellite’s accuracy.

- A team will also make ground measurements of snow and ice along a CryoSat-2 ground track in April. Ground campaigns like this provide a wealth of data that help scientists better understand how the Arctic is changing and, ultimately, how climate is changing.

Figure 39: Sentinel-1 composite radar image of Ellesmere Island, Canada, acquired in December 2016, and in January and February 2017 (image credit: ESA, the image contains modified Copernicus Sentinel data (2016-17), processed by ESA)

• March 5, 2017: Since the 1920s, excessive pumping of groundwater at thousands of wells has caused land to subside, or sink, by as much as 8.5 meters in sections of California’s San Joaquin Valley. This subsidence is exacerbated during droughts, when farmers rely heavily on groundwater to sustain one of the most productive agricultural regions in the United States. 47)

- Subsidence is a serious and challenging concern for California’s water managers, putting state and federal aqueducts, levees, bridges and roads at risk of damage. Already, long-term land subsidence has damaged thousands of public and private groundwater wells throughout the San Joaquin Valley. Furthermore, the subsidence can permanently reduce the storage capacity of underground aquifers, threatening future water supplies. It’s also expensive. While there is no comprehensive estimate of damage costs associated with subsidence, state and federal water agencies have spent an estimated $100 million on related repairs since the 1960s.

- To determine the extent to which additional groundwater pumping associated with California’s recent historic drought has affected land subsidence in the Central Valley, California’s Department of Water Resources (DWR) commissioned NASA/JPL ( Jet Propulsion Laboratory) to use its expertise in collecting and analyzing airborne and satellite radar data. An initial report from JPL in August 2015 analyzed radar data from several different sensors collected between 2006 and early 2015. Due to the continuing drought, DWR subsequently commissioned JPL to collect and analyze new radar images from 2015 and 2016 to update DWR.

- Several trouble spots that were identified in 2015 have continued to subside at rates as high as 0.6 m per year. Significant subsidence was measured in subsidence bowls near the towns of Chowchilla, south of Merced; and Corcoran, north of Bakersfield. These bowls cover hundreds of square kilometers and continued to grow wider and deeper between May 2015 and September 2016. Subsidence also intensified near Tranquility in Fresno County, where the land surface has settled up to 51 cm in an area that extends 11 km.

- The map of Figure 40 shows the total subsidence in part of the San Joaquin Valley between May 2015 and September 2016 as observed by the ESA (European Space Agency) Sentinel-1A satellite and analyzed by scientists at JPL. The areas of most extensive subsidence appear in shades of yellow and bright green.

- JPL scientists plotted the history of subsidence of several sites in the mapped areas and found that for some areas in the San Joaquin Valley, subsidence slowed during the winter of 2015-16 when rainfall matched crop water needs. “While we can see the effect that rain has on subsidence, we know that we’ve run a groundwater deficit for some time, so it will take a long time to refill those reservoirs,” said JPL report co-author Tom Farr. 48)

- Cathleen Jones, a co-author and scientist from JPL, said being able to pinpoint where subsidence is happening helps water resource managers determine why it is happening. “If you see a subsidence bowl, then something is going on at the center of the bowl that is causing the land to sink—for example, high levels of groundwater pumping,” she said. “We can locate problem spots so the state can focus on those areas, saving money and resources. We find the needle in the haystack, so to speak.”

- The researchers compared multiple satellite and airborne interferometric synthetic aperture radar (InSAR) images of Earth’s surface to show how subsidence varies over space and time. InSAR is routinely used to produce maps of surface deformation with approximately centimeter-level accuracy. The 2015 and 2017 reports included data from Sentinel-1A, NASA’s UAVSAR (Uninhabited Aerial Vehicle Synthetic Aperture Radar), Japan’s PALSAR on ALOS-2, and Canada’s RADARSAT-2.

- “The rates of San Joaquin Valley subsidence documented since 2014 by NASA are troubling and unsustainable,” said DWR Director William Croyle. “Subsidence has long plagued certain regions of California. But the current rates jeopardize infrastructure serving millions of people. Groundwater pumping now puts at risk the very system that brings water to the San Joaquin Valley. The situation is untenable.”

Figure 40: NASA Earth Observatory map by Joshua Stevens, using ESA Sentinel-1 SAR data courtesy of Tom Farr and Cathleen Jones, NASA/JPL, caption by Alan Buis of JPL and Ted Thomas of DWR, edited by Mike Carlowicz

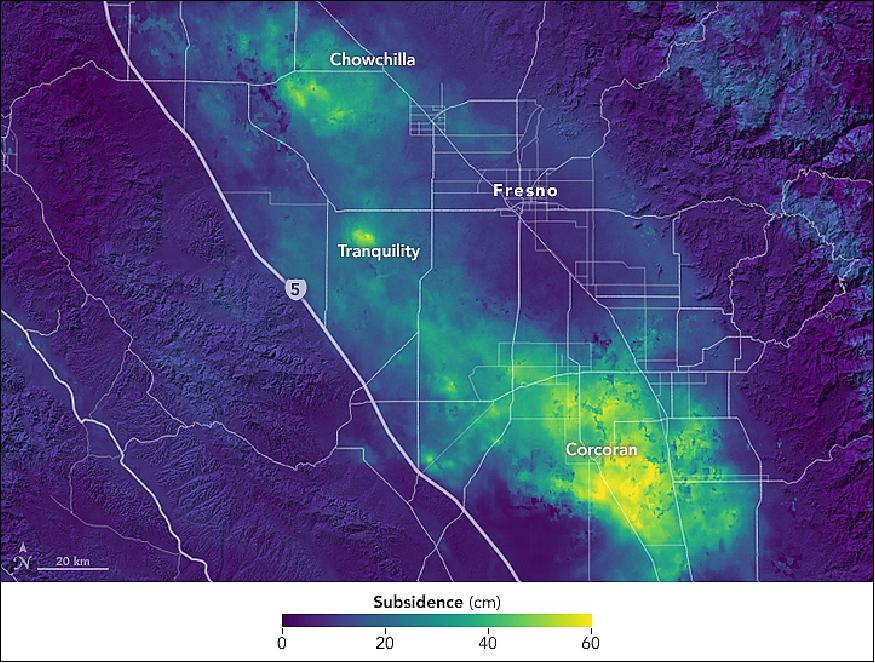
• February 24, 2017: California has seen some heavy rains recently after years of drought, filling many of the state’s reservoirs. The rising waters are evident in this radar image from the Copernicus Sentinel-1 satellite mission over part of the San Joaquin Valley. 49)

- The three water bodies pictured in Figure 41 are Lake Kawhea (in Tulare County) in the upper right, Bravo Lake to its left and Lake Success (near Porterville on the Tule River) in the lower right. This image was created by combining two scans from Sentinel-1’s radar on 15 December and 26 January, and assigning each scan a color. Combined, the colors reveal changes, such as the red coloring in the reservoirs showing the water level increase.

- Officials have begun to release water from Lake Success as heavy rains have nearly filled it to capacity, and the outflow is sometimes exceeding the inflow in these days.

- The problem of too much water is in stark contrast from the situation in previous years, when drought led to water shutoffs and cutoffs, severely hindering yields in the San Joaquin Valley – a major agricultural region. Major crops include grapes, cotton, nuts and fruits, with productivity relying on irrigation from surface water diversions and groundwater pumping from wells.

- Agricultural structures dominate this radar composite image. Like the reservoirs, colors reveal changes between December and January such as vegetation growth or harvests.

- Along the right side of the image, we can see the foothills of the Sierra Nevada mountains.

Figure 41: A Sentinel-1 radar image of water reservoirs in California as of Dec. 15, 2016 and of Jan. 26, 2017 (image credit: ESA, the image contains modified Copernicus Sentinel data, processed by ESA)

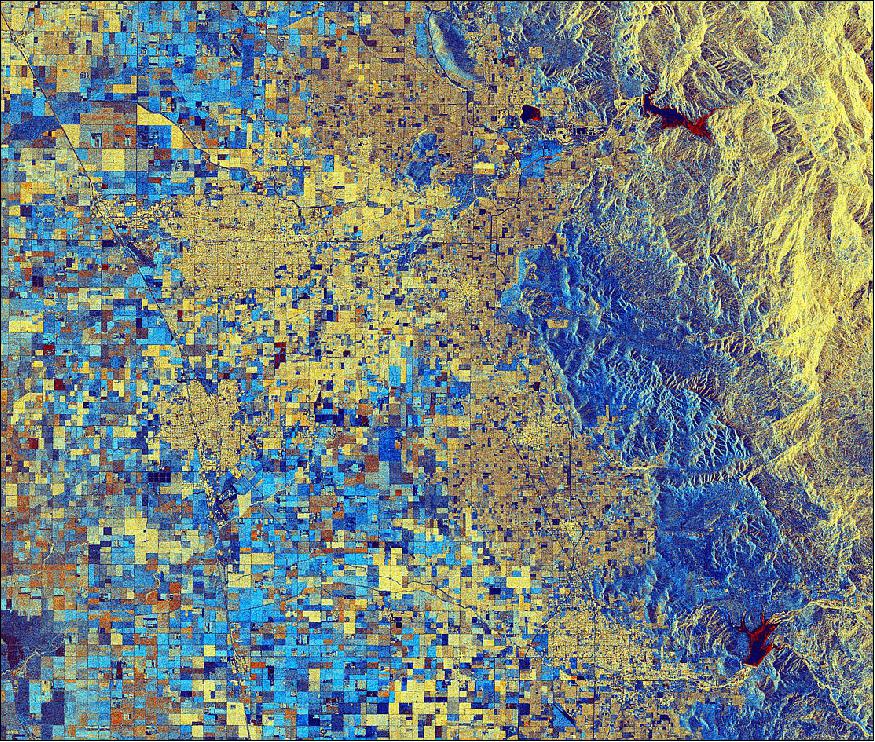
• February 16, 2017: Following the appearance of a large crack in the ice shelf close to the Halley VI research station of BAS (British Antarctic Survey) in Antarctica, information from the Copernicus Sentinel-1 and Sentinel-2 satellites helped to decide to close the base temporarily. 50)

- Nourished by an inflow of ice from grounded glaciers and snow accumulating on its surface, Brunt Ice Shelf is a floating ice sheet in the Weddell Sea Sector of Antarctica. The floating ice moves steadily towards the ocean, where it occasionally calves off as icebergs. Cracks often appear on shelves as the ice deforms. However, rapidly expanding cracks indicate impending calving.

- Since the Halley VI base of BAS was only 17 km from the crack that appeared last October, ENVEO – a company that uses satellite data for cryosphere studies – and the Survey used radar images from Sentinel-1 and optical images from Sentinel-2 to monitor the situation.

- Dubbed Halloween Crack, it was lengthening inland as fast as 600 m a day in November and December 2016. Halley was designed to be relocated if the ice becomes dangerous. In fact, it had already been moved 23 km inland during last Antarctica’s summer months because another ice chasm had begun to show signs of growth. 51)

- The station sits on Antarctica’s 150 m thick Brunt Ice Shelf. This floating ice shelf flows at a rate of 0.4 km per year west towards the sea where, at irregular intervals, it calves off as icebergs. Halley is crucial to studies into globally important issues such as the impact of an extreme space weather event, climate change, and atmospheric phenomena. It was scientific investigations from this location that led to the discovery of the Antarctic Ozone Hole in 1985.

- Normally, around 70 people live and work at the base during the summer and fewer than 20 during the winter. However, this is the first winter that the base has been completely closed.

- Thomas Nagler, ENVEO CEO, said, “We get Sentinel-1 and Sentinel-2 data shortly after acquisition so we are able extract information on the crack’s progression and deliver this information to our Survey colleagues very quickly.” Hilmar Gudmundsson, Survey lead scientist, added, “The frequency of Sentinel-2 images and Sentinel-1 radar products allows us to follow in detail and almost in real time the development of the crack as it grows week by week. This also provides us with essential information for ice-deformation models, leading to a deeper understanding of such events.”

- Mark Drinkwater, head of ESA’s Earth observation mission, added “Routine Antarctic summer observations by the combination of Copernicus Sentinel-2A and Sentinel-1A and -1B are now demonstrating their value for monitoring rapid environmental change and providing information crucial to informed decisions on matters of safety and security in Antarctica.

Figure 42: The Sentinel-1A and Sentinel-1B interferogram uses images from 14 and 20 January 2017. It shows a discontinuity all along the Halloween crack and a distinct deformation pattern at its tip. The interferogram is laid on a Sentinel-2 optical image from 5 February 2017 (image credit: ESA, the image contains modified Copernicus Sentinel data (2016–17), processed by ENVEO)

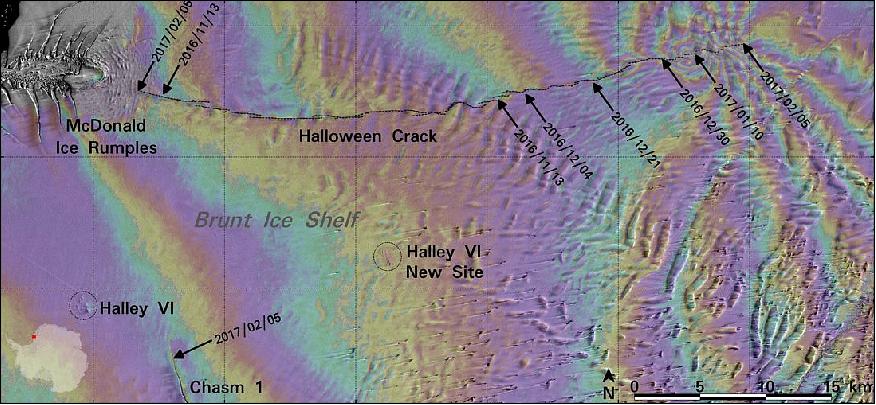
• February 3, 2017: Climate change-driven glacial melt is causing landslides in alpine regions. Data from the Sentinel-1 satellite mission are being inserted into a new cloud computing system to monitor such hazards globally. 52)

- The Aletsch Glacier, the largest in the Alps, is experiencing an average retreat of about 50 m a year. The adjacent rocks that were previously constrained by the ice mass are progressively being released, generating slope instabilities. For this reason, the Aletsch region is a unique place where scientists can investigate how changes in glaciers affect the long- and short-term evolution of rock slope stability.

- To monitor the progressive changes occurring throughout a 2 km2 area southeast of the glacier – called the Moosfluh slope – the Chair of Engineering Geology at the Swiss Federal Institute of Technology in Zurich (ETHZ) installed ground-based instruments in 2013.

- Between September and October 2016, Moosfluh experienced an abnormal acceleration. The deformation generated several deep cracks and rock failures, hindering access to hiking paths visited by tourists, and affecting a cable car station located near the crest of the slope.

Figure 43: Moosfluh slope instability of the Aletsch Glacier (image credit: Geohazards-TEP, the image contains modified Copernicus Sentinel-1 data (2016), processed by Geohazards-TEP)

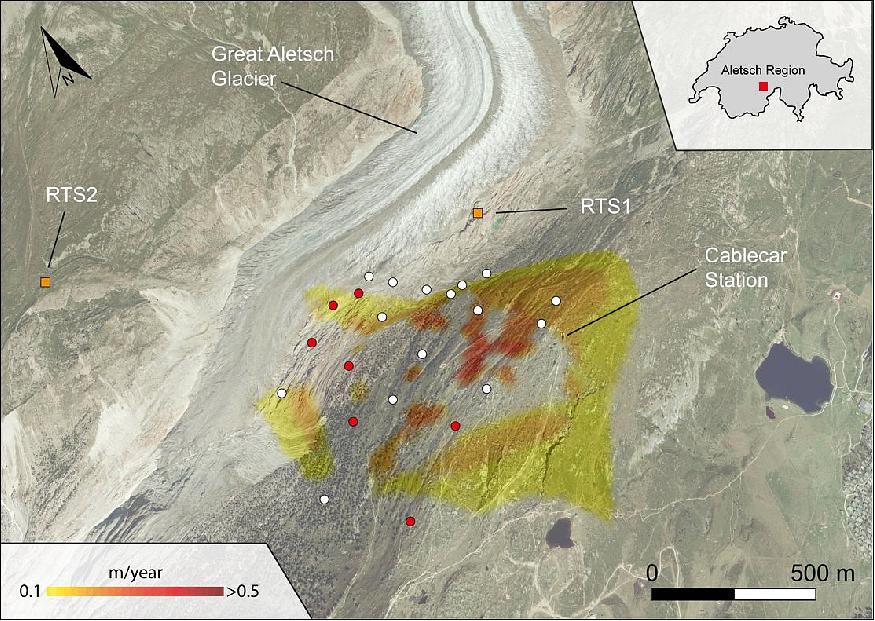
Legend to Figure 43: Land deformation speed of the Moosfluh area observed by the Sentinel-1 satellite from August to November 2016. The monitoring system installed by the Chair of Engineering Geology at ETHZ includes two Robotized Total Stations (RTS1 and RTS2), which monitor the evolution of surface displacements at point targets located on the unstable area (white and red dots). The results obtained from satellite data helped scientists to define the extension of the most active area and identify locations to place additional monitoring targets (red dots),

• January 30, 2017: A crack in the Larsen-C ice shelf in on the Antarctic Peninsula first appeared several years ago, but recently it has been lengthening faster than before. Carrying radar that can ‘see’ through the dark, the Copernicus Sentinel-1 satellites are monitoring the situation. The animation shows that the fissure has opened around 60 km since January last year. And, since the beginning of this January it has split a further 20 km so that the 350 m-thick shelf is held only by a thread. The crack now extends around 175 km. 53)

- When the ice shelf calves this iceberg it will be one of the largest ever recorded – but exactly how long this will take is difficult to predict. The neighboring Larsen-A and Larsen-B ice shelves suffered a similar fate with dramatic calving events in 1995 and 2002, respectively. —These ice shelves are important because they act as buttresses, holding back the ice that flows towards the sea.

Figure 44: Larsen Crack evolution in Antarctica: The Sentinel-1 two-satellite constellation is indispensable for discovering and monitoring events like these because it continues to deliver radar images when Antarctica is shrouded in darkness for several months of the year (image credit: ESA, the image contains modified Copernicus Sentinel data (2016–17), processed by ESA)

• November 25, 2016: The Sentinel-1 satellites have shown that the Millennium Tower skyscraper in the center of San Francisco is sinking by a few centimeters a year. Studying the city is helping scientists to improve the monitoring of urban ground movements, particularly for subsidence hotspots in Europe. 54)

- Completed in 2009, the 58-storey Millennium Tower has recently been showing signs of sinking and tilting. Although the cause has not been pinpointed, it is believed that the movements are connected to the supporting piles not firmly resting on bedrock. - To probe these subtle shifts, scientists combined multiple radar scans from the Copernicus Sentinel-1 twin satellites of the same area to detect subtle surface changes – down to millimeters. The technique works well with buildings because they better reflect the radar beam.

- It is also useful for pinpointing displacement hotspots over large areas, thanks to Sentinel-1’s broad coverage and frequent visits. Working with ESA, the team from Norut, PPO.labs and Geological Survey of Norway have also mapped other areas in the wider San Francisco Bay Area that are moving. These include buildings along the earthquake-prone Hayward Fault, as well as subsidence of the newly reclaimed land in the San Rafael Bay.

- An uplift of the land was detected around the city of Pleasanton, possibly from the replenishment of groundwater following a four-year drought that ended in 2015.

Figure 45: Data from the Sentinel-1 satellites acquired between 22 February 2015 and 20 September 2016 show that Millennium Tower in San Francisco is sinking by about 40 mm a year in the ‘line of sight’ – the direction that the satellite is ‘looking’ at the building. This translates into a vertical subsidence of almost 50 mm a year, assuming no tilting. The colored dots represent targets observed by the radar. The color scale ranges from 40 mm a year away from radar (red) to 40 mm a year towards radar (blue). Green represents stable targets (image credit: ESA, the image contains modified Copernicus Sentinel data (2015–16) / ESA SEOM INSARAP study / PPO.labs / Norut / NGU) 55)
Figure 46: Sentinel-1 radar data show ground displacement of downtown San Francisco. While green indicates no detected movement, points in yellow, orange and red indicate where structures are subsiding, or sinking (image credit: ESA, the image contains modified Copernicus Sentinel data (2015–16) / ESA SEOM INSARAP study / PPO.labs / Norut / NGU) 56)
Figure 47: Sentinel-1 radar data show ground displacement of the San Francisco Bay Area. Hot spots are clearly observed, including the Hayward fault running north–south of the central-right side of the image. Subsidence of the newly reclaimed land in the San Rafael Bay on the left is also visible, while an uplift of land is visible in the lower right, possibly a result of a recovering groundwater level after a four-year long drought that ended in autumn 2015 (image credit: ESA, the image contains modified Copernicus Sentinel data (2015–16) / ESA SEOM INSARAP study / PPO.labs / Norut / NGU) 57)

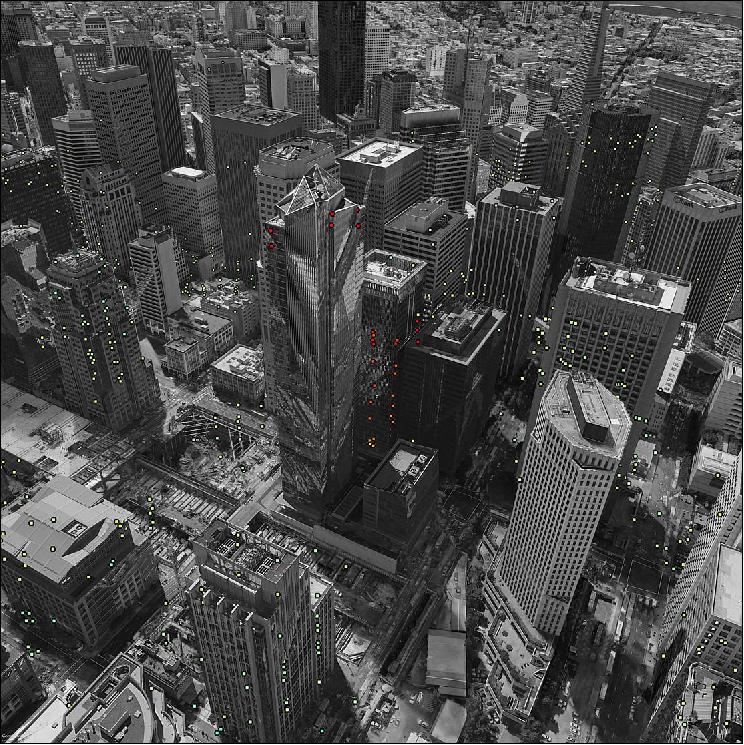
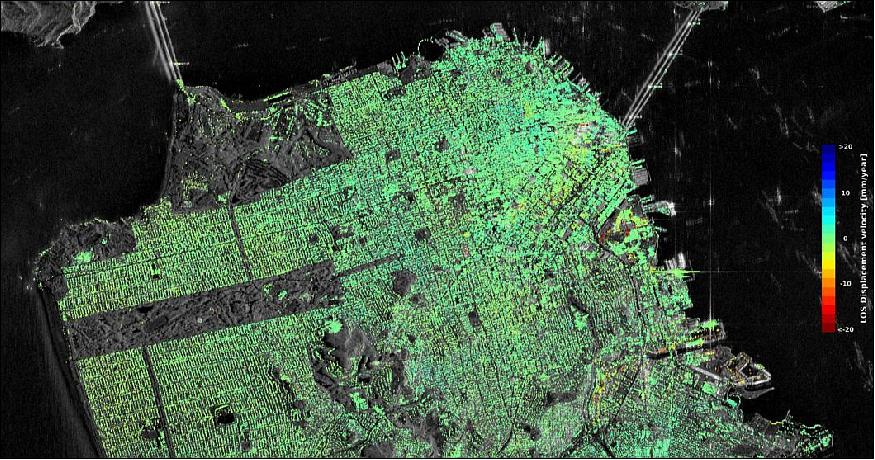
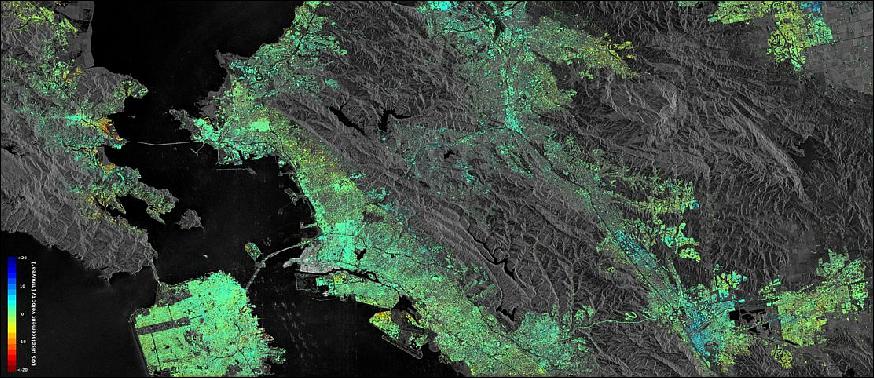
- European cities experience similar subsidence, and the San Francisco study is helping because it contains a multitude of features (Ref. 54).

- For example, the area around Oslo’s train station in Norway is reclaimed land. Newer buildings, such as the nearby opera house, have proper foundation into bedrock, but the older parts of the station experience severe subsidence.

- “Experience and knowledge gained within the ESA’s Scientific Exploitation of Operational Missions program give us strong confidence that Sentinel-1 will be a highly versatile and reliable platform for operational deformation monitoring in Norway, and worldwide,” noted John Dehls from the Geological Survey of Norway.

- The studies of San Francisco and Oslo are paving the way for moving from targeted case studies to a nationwide or even continental-scale land deformation service.

- “The Copernicus Sentinel-1 mission is, for the first time, making it possible to launch operational national deformation mapping services,” said Dag Anders Moldestad from the Norwegian Space Center. The open data policy and regular coverage plan of Copernicus promise cost-efficient and reliable services. “In Norway, we have already initiated a framework project to provide nationwide basic deformation products to the public, with a free and open data policy. Many other countries in Europe are also working towards setting up similar services,” noted Dr. Moldestad.

- The Sentinel-1 twins provide ‘radar vision’ for Europe’s Copernicus environment monitoring program. In addition to watching land movements, they feed numerous other services for monitoring Arctic sea ice, routine sea-ice mapping, surveillance of the marine environment, mapping for forest, water and soil management, and mapping to support humanitarian aid and crisis situations.

Figure 48: Data from the Sentinel-1 satellites acquired between 26 December 2014 and 28 October 2016 show that parts of the Oslo train station are sinking by 10–15 mm a year in the ‘line of sight’ – the direction that the satellite is ‘looking’ at the building. This translates into a vertical subsidence of 12–18 mm a year. It can also be observed that the new opera house – the white structure located by the fjord south of the subsiding area – has not moved (image credit: ESA, the image contains modified Copernicus Sentinel data (2015–16) / ESA SEOM INSARAP study / PPO.labs / Norut / NGU) 58)

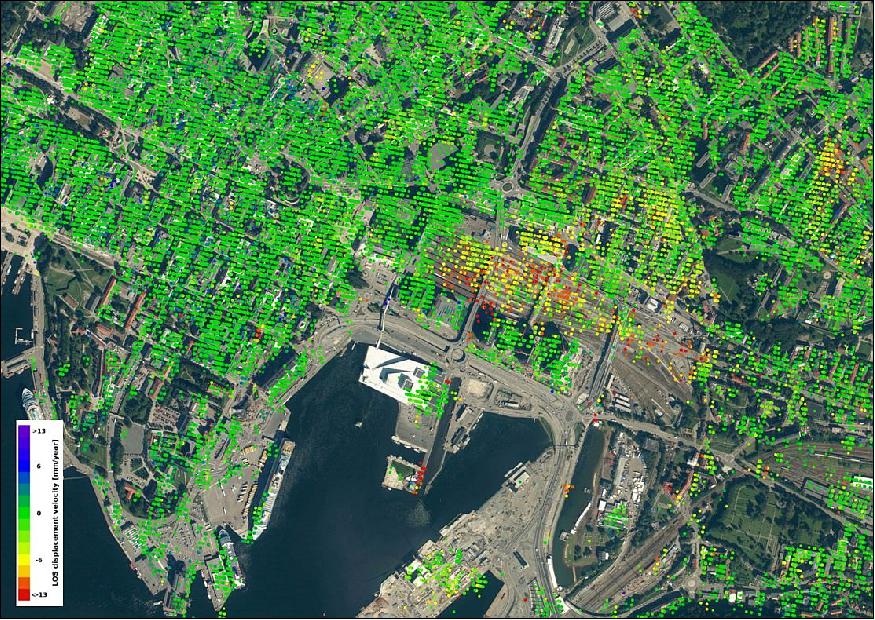
• November 11, 2016. The Sentinel-1 image of Figure 49 shows the Virunga Mountains in East Africa and their volcanoes. While most are dormant, two of the eight volcanoes are active, with the most recent eruptions in 2006 and 2010. 59)

- The mountains are on the Albertine Rift, where the Somali Plate is splitting away from the rest of the African continent. The area is one of Africa’s most biologically diverse regions, but high human population density, poverty and conflict pose a challenge to conservation. Across the mountain range, however, a series of national parks has been established to protect the fauna and flora.

- In this image, we can easily identify the delineation between the protected and non-protected lands – the green, orange and yellow dots indicate changes in the surface of non-protected lands between the radar scans that make up this composite image. These changes are primarily in vegetation as the land surrounding the mountains is blanketed with agricultural plots. In particular, we can see the grid-like pattern of agriculture is visible in the green and yellow square at the center of the image.

Figure 49: This Sentinel-1 radar composite image features the Virunga Mountains in East Africa: a chain of volcanoes stretching across Rwanda’s northern border with Uganda and east into the Democratic Republic of the Congo (image credit: ESA, the image contains modified Copernicus Sentinel data (2016), processed by ESA)

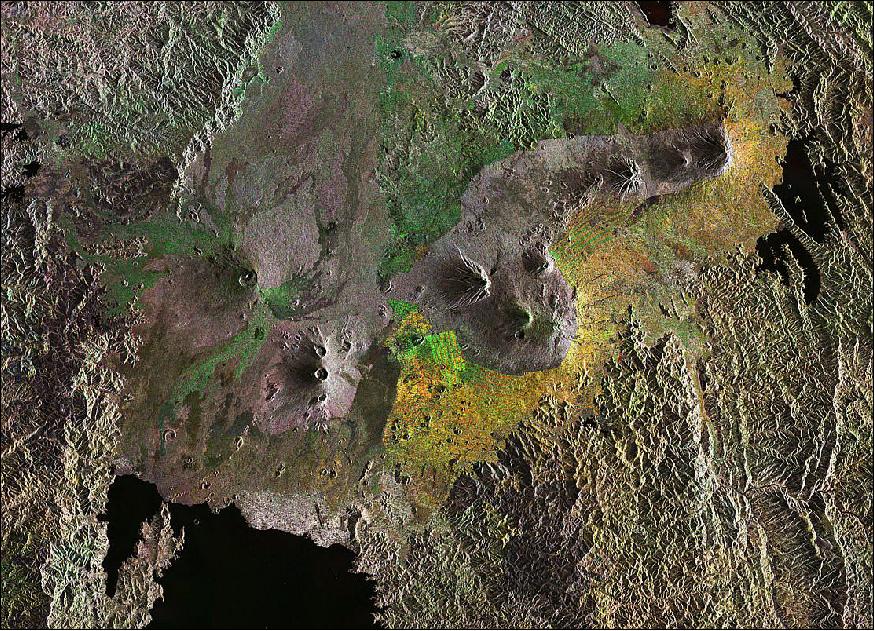
• November 3, 2016: In the early hours of 30 October 2016, a 6.5 magnitude earthquake struck central Italy. The team od scientists combined several pairs of Sentinel-1 radar images acquired between 25 October and 1 November 2016 to analyze the ground displacements caused by the quake. 60)

- New information on the effects of the 30 October earthquake that struck central Italy continues to emerge as scientists analyze radar scans from satellites. Using radar imagery from the Copernicus Sentinel-1 satellites, Italian experts have identified significant east–west displacements of the ground in the area struck by the earthquake. An eastwards shift of about 40 cm was mapped in the vicinity of Montegallo, while a westwards shift of about 30 cm is centered in the area of Norcia (Figure 50).

- The team of scientists from the Institute for Electromagnetic Sensing of the Environment of the National Research Council and the National Institute of Geophysics and Volcanology combined radar scans taken before and after the event to map centimeter-scale changes. Vertical displacement is also evident, with the ground sinking 60 cm around Castelluccio but rising by about 12 cm around Norcia (Figure 51).

Figure 50: East-West displacements: The results of the analysis show an eastwards shift of about 40 cm in the vicinity of Montegallo, while a westwards shift of about 30 cm is centered in the area of Norcia (image credit: ESA, the image contains modified Copernicus Sentinel data (2016)/ESA/CNR-IREA)
Figure 51: Vertical displacements: The results show ground subsiding or sinking down to 60 cm around Castelluccio. Around Norcia, there is an uplift of about 12 cm (image credit: ESA, the image contains modified Copernicus Sentinel data (2016)/ESA/CNR-IREA)

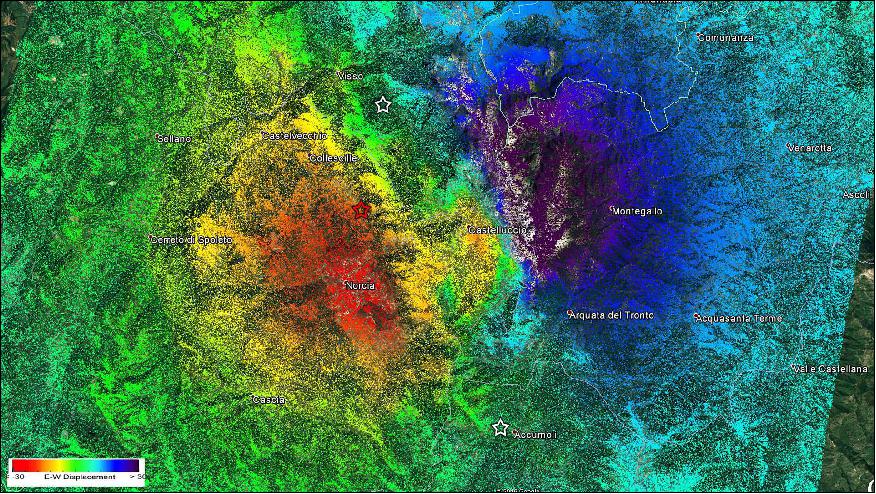
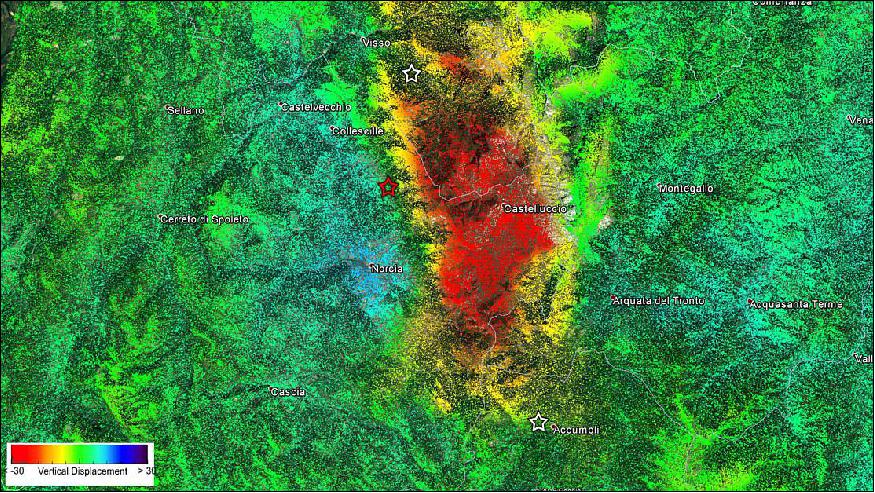
• October 28, 2016: The Geohazards Exploitation Platform gives users direct access to large Earth-observation datasets for areas at risk of geohazards such as earthquakes and volcanic activity. Radar ‘interferometry’ involves taking successive radar images of the same location and combining them to produce rainbow-hued ‘interferograms’. Like playing spot the difference, the slightest shift between images gives rise to distinct interference fringes, resembling contour lines on a map. 61)

- Pairs of Sentinel-1A radar images from consecutive passes over the same spot on Earth’s service are processed continuously and automatically to provide medium-resolution (200 m) images. This, and related interferograms, allows users to identify ground movement and other changes that may have occurred between satellite acquisitions. The service currently covers tectonic areas in Europe. Covering three million km2, this represents 360 interferometric pairs every 12 days.

Figure 52: An overview of seismic zones in Europe provided by the Sentinel-1 twin radar satellites (image credit: ESA, the image contains modified Copernicus Sentinel data (2016), processed by DLR/ESA/Terradue)

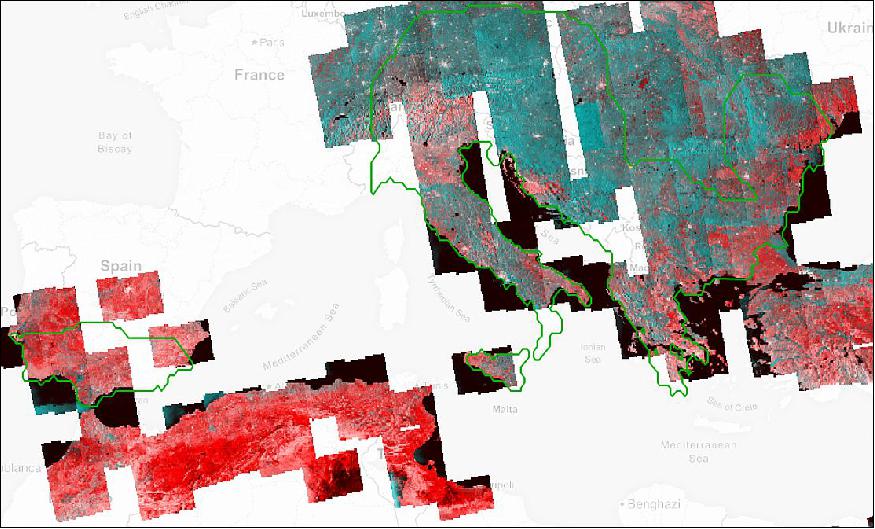
- The image of Figure 53 was generated automatically on the Geohazards Exploitation Platform and combines images captured by Sentinel-1A before and after the quakes. The Geohazards Exploitation Platform gives users direct access to large Earth-observation datasets for areas at risk of earthquakes or volcanic activity, for example. 62)

Pairs of Sentinel-1A radar images from consecutive passes over the same spot on Earth’s service are processed continuously and automatically to provide medium-resolution (200 m) images. These interferograms allow users to identify ground movement and other changes that may have occurred between satellite acquisitions. Although the service only covers Europe, this illustrates how information on major events can be made available to users. Over the next months, the browse service will be ramped up gradually to cover the global tectonic ‘mask’. This mask corresponds to regions where the shape of the ground is deforming because of tectonic activity and prioritised by the geohazards user community.

“The quick-browse service has been under way across European tectonic regions since January, harnessing automated processing developed by the DLR German Aerospace Center,” explains Fabrizio Pacini of Terradue, overseeing the Platform. “Our plan next year is to gradually scale up to cover the entire world’s tectonic regions, which adds up to a quarter of Earth’s land surface. Such wide-area coverage is really unprecedented. It is a crucial step towards empowering society at large to reduce the risk from earthquakes and volcanoes.”

Figure 53: This interferogram of Sentinel-1 data shows how the ground moved as a result of the earthquakes that struck Amatrice in Italy on 24 August 2016 (image credit: ESA, the image contains modified Copernicus Sentinel data (2016), processed by DLR/ESA/Terradue)

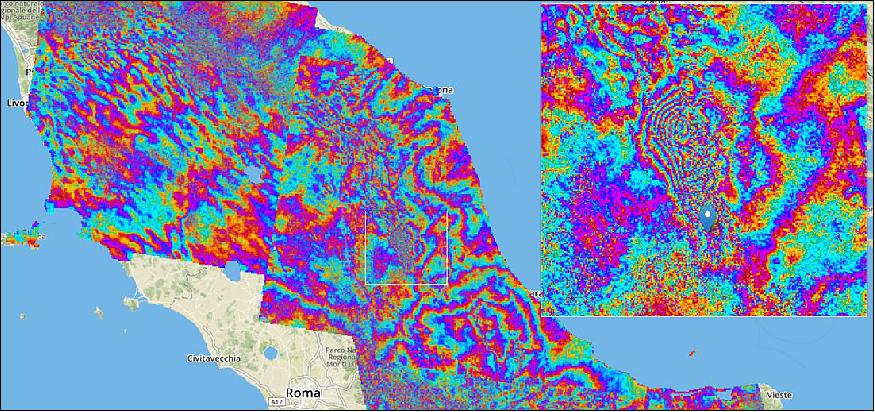
- Today, it is a well-established technique used to give authoritative snapshots of ground movements following events such as the recent earthquakes in central Italy. — Earth scientists were surprised in the 1980s when centimeter-accuracy GPS networks revealed previously unsuspected motion along tectonic plates, occurring between larger-scale seismic events. 63)

Combined radar scans are sensitive down to a level of millimeters and over wide areas, compared to point-by-point GPS measurements, but the process demands heavy computing power. “The real step change here is that they are being produced across extended areas on an entirely automated basis,” adds Fabrizio.

- The service is processing an average 50 image pairs per day across Europe from the Sentinel-1A and Sentinel-1B satellites, with six days between coverage.

- Next year, this will increase to 130 pairs per day, with a maximum of 24 days and potentially 12 days between acquisitions outside Europe, involving the daily processing of 1 terabyte of data, with additional higher resolution produced on request.

Processing on such a grand scale is enabled by the online, cloud-based Geohazards Exploitation Platform, specifically tailored for working with vast amounts of satellite data.

Figure 54: Scientists from Italy’s Institute for Electromagnetic Sensing of the Environment combined Sentinel-1 radar acquisitions over central Italy from before and after the 24 August 2016 earthquake: 15 August, 21 August and 27 August 2016. The result shows vertical ground subsidence, reaching about 20 cm in correspondence to the Accumoli area, and lateral movement of up to 16 cm. The blue line indicates the location of the fault trace (image credit: ESA, the image contains modified Copernicus Sentinel data (2016)/ESA/CNR-IREA)

• Sept. 16, 2016: Sentinel-1B was declared operational. On 14 September, project manager Ramón Torres who led the development team, handed over the satellite to the mission manager, Pierre Potin in the presence of Volker Liebig, Senior Advisor to ESA’s Director General. — Following liftoff on 25 April 2016, the Copernicus Sentinel-1B satellite has been commissioned and handed over for mission operations. It joins its identical twin, Sentinel-1A, which has been systematically scanning Earth with its radar since October 2014. Orbiting 180° apart, the two satellites optimize coverage and data delivery for the Copernicus services that are making a step change in the way our environment is managed. More than 45,000 users have registered to access Sentinel data, under the free and open data policy data framework of Europe’s Copernicus environmental monitoring program. 64)

- Both satellites carry a radar that images Earth’s surface through cloud and rain and regardless of whether it is day or night. These images are used for many applications, such as monitoring ice in the polar seas, tracking land subsidence, and for responding to disasters such as floods.

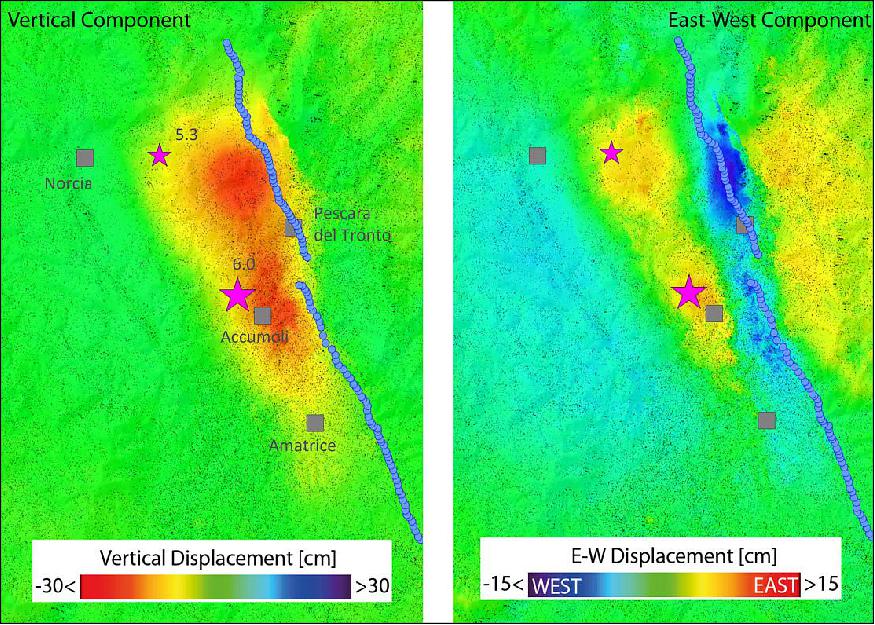
• Sept. 16, 2016: Southern China’s Poyang Lake is the largest freshwater lake in the country. Located in Jiangxi province, this lake is an important habitat for migrating Siberian cranes, many of which spend the winter there. The lake is also home to the endangered finless porpoise, a freshwater mammal known for its high level of intelligence. Amid fears that it would soon become extinct, the porpoise made headlines last year when the Chinese government moved eight of them from Poyang Lake to two secure habitats in an effort to increase the population over the coming years. 65)

- One study found that, without action, the current rate of population decrease would likely mean extinction by 2025.

- For the human population, Poyang is one of China’s most important rice-producing regions, although local inhabitants must contend with massive seasonal changes in water level.

- Local scientists collaborating with ESA through the Dragon program have identified an overall drop in water level in the lake over the last decade, but the El Niño weather phenomenon earlier this year caused precipitation levels to increase and water levels of the lake to rise.

Figure 55: Radar images from the Copernicus Sentinel-1 mission have been used to monitor the evolution of the lake, including this image which combines two radar scans from 7 and 19 March, 2016 (image credit: ESA, the image contains modified Copernicus Sentinel data (2016), processed by ESA)

• August 31, 2016: ESA engineers have discovered that a solar panel on the Copernicus Sentinel-1A satellite was hit by a millimeter-size particle in orbit on 23 August. Thanks to onboard cameras, ground controllers were able to identify the affected area. So far, there has been no effect on the satellite’s routine operations. 66)

- A sudden small power reduction was observed in a solar array of Sentinel-1A, orbiting at 700 km altitude, at 17:07 GMT on 23 August. Slight changes in the orientation and the orbit of the satellite were also measured at the same time. Following a preliminary investigation, the operations team at ESA’s control center in Darmstadt, Germany suspected a possible impact by space debris or micrometeoroid on the solar wing.

- Detailed analyses of the satellite’s status were performed to understand the cause of this power loss. In addition, the engineers decided to activate the board cameras to acquire pictures of the array. These cameras were originally carried to monitor the deployment of the solar wings, which occurred just a few hours after launch in April 2014, and were not intended to be used afterwards.

- Following their switch-on, one camera provided a picture that clearly shows the strike on the solar panel. The power reduction is relatively small compared to the overall power generated by the solar wing, which remains much higher than what the satellite requires for routine operations.

- “Such hits, caused by particles of millimeter size, are not unexpected,” notes Holger Krag, Head of the Space Debris Office at ESA’s establishment in Darmstadt, Germany. “These very small objects are not trackable from the ground, because only objects greater than about 5 cm can usually be tracked and, thus, avoided by maneuvering the satellites. In this case, assuming the change in attitude and the orbit of the satellite at impact, the typical speed of such a fragment, plus additional parameters, our first estimates indicate that the size of the particle was of a few millimeters.

- “Analysis continues to obtain indications on whether the origin of the object was natural or man-made. The pictures of the affected area show a diameter of roughly 40 cm created on the solar array structure, confirming an impact from the back side, as suggested by the satellite’s attitude rate readings.” This event has no effect on the satellite’s routine operations, which continue normally.

Figure 56: Solar panel image of the Sentinel-1A spacecraft hit by a space particle (image credit: ESA)

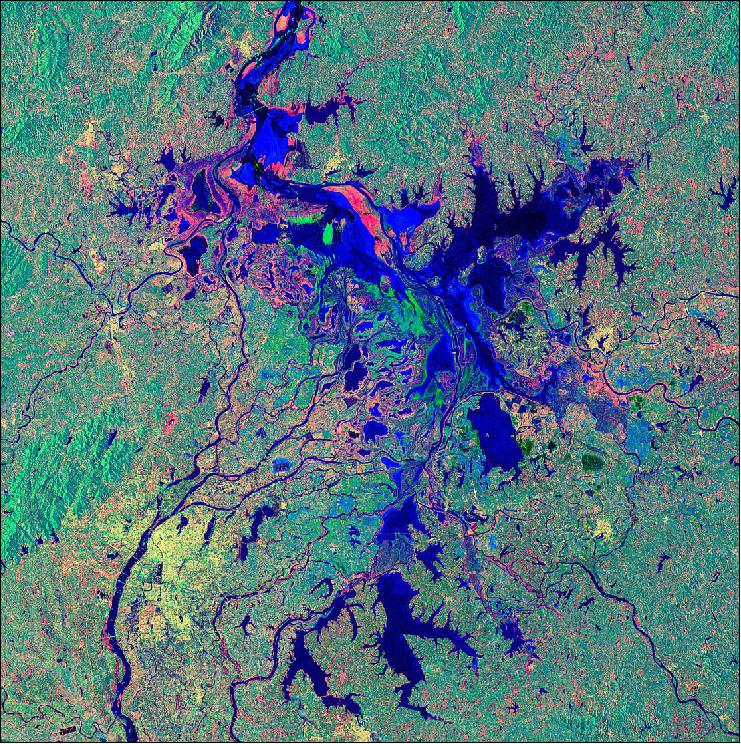
• June 22, 2016: The twin Sentinel-1 satellites have – for the first time – combined to show their capability for revealing even small deformations in Earth’s surface. Following its orbital maneuvers, the recently launched Sentinel-1B satellite reached its designated orbit position on 15 June. The satellite is now orbiting Earth 180° apart from its twin, Sentinel-1A, at an altitude of almost 700 km. With both satellites finally in the same orbit, together they can cover the whole globe every six days. — It has now been demonstrated that future images acquired by the pair can be merged to detect slight changes occurring between scans. 67)

- The rainbow-colored patterns (Figure 57) are related to topography, and they demonstrate that the two satellites’ identical radars are accurately synchronized, pointing in the same direction and that the satellites are in their correct orbits.

- Once commissioning is completed in mid-September, the pair will be ready to deliver data for the systematic and routine monitoring of Earth surface deformation and ice dynamics.

Figure 57: This ‘interferogram’ combines a Sentinel-1A radar scan from 10 June 2016 over northwestern Romania with a Sentinel-1B acquisition from 16 June over the same area – shortly before Sentinel-1B reached its designated orbit. The city of Cluj-Napoca is at the center of the image. The color pattern is related to local terrain topography (image credit: the image contains modified Copernicus Sentinel data (2016)/ESA/DLR)

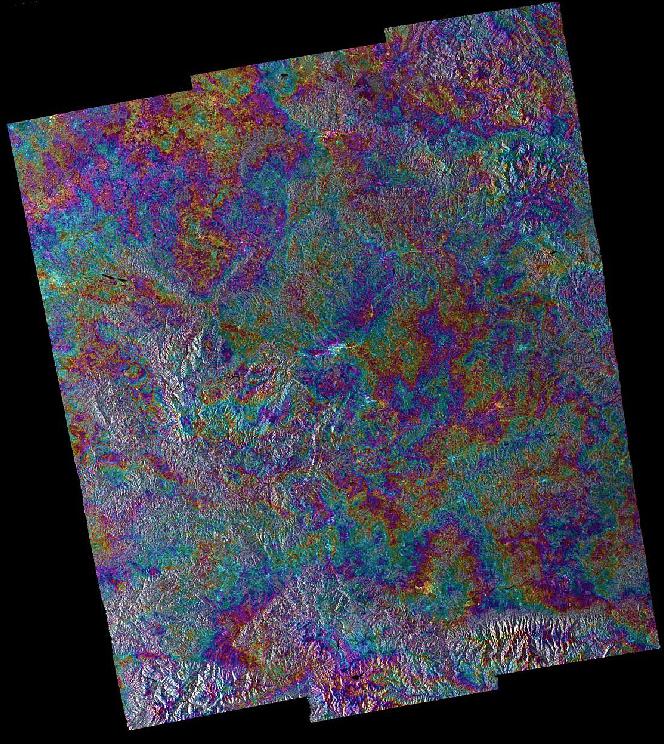
Sentinel-1 is based on a constellation of two SAR satellites that ensures continuity of C-band SAR observations. Sentinel-1A was launched on 3 April 2014, the second Sentinel-1 satellite, Sentinel-1B, was launched on 25th April 2016.

The operational nature of the Sentinel-1 mission represents a game changer in a number of application domains, thanks to the large-scale mapping capability and revisiting frequency of the two identical satellites, together with a high capacity ground segment that systematically processes, archives and makes available all the generated data products to users online, in a routine operational way.

Sentinel-1 Operations Strategy: The main objective of the Sentinel operations strategy is to ensure a reliable provision of data to Copernicus users, with systematic and routine operational activities. The Sentinels are operated via a pre-defined observation plan. All Sentinels acquired data are systematically downlinked and processed to generate a predefined list of core products within specific timeliness. For Sentinel-1, the goal is to minimize the number of potential conflicts during operations, therefore solve anticipated conflicts a priori, in particular in the elaboration of optimized mission observation scenarios. This concept allows on the service and user side to guarantee the observations required for stable and sustained value-added activities.

Organization of Operations Activities: The Sentinel-1 operations are based on a range of activities tightly coordinated, involving the satellite and the ground segment. The satellite is routinely monitored and controlled by the FOS (Flight Operations Segment) managed by ESA/ESOC. The FOS ensures overall satellite safety, routine tasks include the execution of all platform activities and the commanding of the payload schedules. The mission operations, flight dynamic operations and collision avoidance monitoring operations are performed routinely, involving the various facilities and teams of the FOCC (Flight Operations Control Centre) at ESOC, including: Mission Control, Mission Scheduling, the use of the specific Sentinel-1 Spacecraft Operational Simulator, Flight Dynamics operations and the activities of the SDO (Space Debris Office).

The so-called PLS (Post-Launch Support) activities, managed by ESA/ESTEC, are related to the satellite and started at the end of the satellite commissioning phase, with the support of expertise from the satellite industrial team gained during the development and integration phase of the satellite. The main activities include satellite preventive maintenance, support to satellite operations, anomaly investigations & analysis, on-board software maintenance, and maintenance of relevant test facilities.

As part of the PDGS (Payload Data Ground Segment) managed by ESA/ESRIN, satellite tasking and downlink activities are daily defined at the Payload Data Management Center in ESRIN and provided to the FOS for satellite uplink. X-band data acquisitions are routinely performed over Matera, Svalbard and Maspalomas X-band core stations. The acquired data are circulated within the PDGS, systematically processed to the various products levels, archived and disseminated. Operations are regularly performed at the PACs (Processing and Archiving Centers), DLR-PAC and UK-PAC. The other PDGS operational services include the Mission Performance monitoring, the Precise Orbit Determination and the Wide Area Network operations. Through its high performance network configuration, the Sentinel-1 PDGS is a unique virtual center interfacing a cluster of physically separated sites and providing an overall operations performance, centrally monitored.

Sentinel-1 Observation Scenario: The Sentinel-1 observation plans are defined based on a process that includes the collection of observation requirements from the various user groups (Copernicus and National services from ESA and EU Member States, scientific communities, international partners or initiatives, etc.). Extensive simulations are then performed to elaborate and optimize the Sentinel-1 observation scenarios, from which the detailed instrument planning and data downlink plans are derived. Regular revisions and adaptations of the observation scenario are necessary during operations and will continue for the full operations phase, based on the evolution of the requirements, the system capacity increase, in particular with the second satellite and the use of the EDRS (European Data Relay System).

The implementation of the ramp-up observation scenario included among others the coverage of a first set of Copernicus Services areas of interest, of European land and coastal waters, of a large set of global tectonic/volcanic areas, as well as of other specific targets worldwide for various applications. During ramp-up these observations were gradually complemented with observations outside the above areas to achieve a full mapping of all land areas worldwide at the time of the ramp-up phase completion. Observations were then further increased during the routine operations. Today, beyond the global areas very frequently observed, global landmasses has been mapped several times. Specific observation campaigns have been performed for the Greenland and Antarctica icesheets.

The resources allocated to the CMENS Copernicus Marine Environment Monitoring Service) for sea-ice and iceberg monitoring are quite substantial, this service having a high priority for accessing Sentinel-1 resources. Many applications have been developed in Europe based on the available time series, considering that a full mapping of EEA-38 (European Environment Agency) countries is performed systematically every repeat cycle of 12 days, in both ascending and descending passes, dual-polarization VV+VH. The coverage will be increased by a factor 2 once Sentinel-1B will enter in operations.

Processing & Dissemination Concept: The processing scenario is based on the systematic generation, archiving and dissemination of Level-0, Level-1 and Level-2 products, in NRT (Near Real Time) or within 24h from sensing, with no user ordering required. The set of products to be systematically generated responds to the requirements of the Copernicus services and allows generating several products with different characteristics for the same data take.

The scenario foresees the systematic availability of Level-0 products and Level-1 GRD (Ground Range Detected) products for all data acquired in SM, IW and EW instrument modes within 24h from sensing and within NRT 3h from sensing for a subset of data acquired over specific regional areas.

It also foresees the systematic availability of Level-2 OCN (Ocean) products for all data acquired in WV mode, as well as from data acquired in IW and EW modes over regional ocean areas.

Although the original Sentinel-1 operations concept foresaw the generation of SLC (Single Look Complex) over a limited set of areas over land, since 21 July 2015, 100% of the IW and SM data acquired over land are systematically produced to level 1 SLC, to support interferometric applications.

This has represented a major evolution of the initial processing and dissemination concept, with a huge increase in the overall ground segment operations load and user data access volumes. This global SLC production scenario enables to foster the exploitation of Sentinel-1 data for an increasing number of InSAR based applications worldwide.

Operational performance: The overall operations capacity has been regularly increasing since October 2014 in line with the increase of the observation scenario and the increase of the systematic SLC production over land masses.

Figure 58 shows the evolution of the volume of Sentinel-1 products generated on a daily basis since the end of the satellite commissioning phase in September 2014. To date more than 3.5 TB of Sentinel-1 products are daily generated and available for user download.

Operational User Products qualification: Sentinel-1 operational user products have been progressively qualified since the Sentinel-1A launch. By the end of the satellite commissioning phase, the Level-0 operational qualification and the Level-1 preliminary qualification were completed as planned, enabling the start of the Level-0 and Level-1 products dissemination to users.

Level-1 product quality has been continuously improved since October 2014 and available products are operationally qualified since end 2015, achieving the target geometric and radiometric quality.

Level-2 OCN products preliminary qualification was completed in July 2015, enabling the operational user data access to Sentinel-1 Level-2 products. Level-2 OCN products are currently operationally qualified except for the radial velocity component

Precise Orbit performance: The Sentinel-1 precise orbit determination operations provide restituted orbit information within 3 hours from sensing which is nominally used for the systematic processing of Fast24 products. The quality of the restituted orbits has proven to be in 95% of the cases twice better than expected, resulting in the very good absolute geolocation accuracy of Sentinel-1 products. The precise orbit information is available 21 days after sensing and used operationally only in case of data reprocessing.

Data Access: Under the free and open Sentinel data policy framework of the Copernicus program, the opening of the Sentinel-1A data flow to all users took place on 3rd October 2014 on the so-called scientific data hub: https://scihub.copernicus.eu/

Other data hubs have been set up to allow customized access by specific user categories and include: Copernicus Services data hub, Collaborative data hub (for collaborative ground segment partners having signed an agreement with ESA), International data hub (for International partners having signed an agreement with ESA).

All Sentinel-1 core products (Level-0, Level-1 and Level 2) are routinely made available for download upon simple self-registration. By end April 2016, more than 32,000 users have self-registered, and since the opening of the regular data flow on 3 October 2014, more than 4 million product download have been made by users (see Figure 59), representing about 5 PB (Petabyte) of data. More than 500,000 products are today available online for download (see Figure60). The scientific data access service relies on a high capacity dissemination network of 10 Gbit/s. The user download activity is closely monitored and the highest observed peak download by users has never reached the maximum available capacity, meaning that it is currently not a limiting factor to the user data access. The user download capacity may be however constrained by the user available Internet capacity.

Examples of mission results: During its first 2 years in orbit, Sentinel-1A has contributed to a number of Copernicus services, to the support of emergency management of natural disasters, as well as to a number of scientific results. Only very few of them are presented below. The great potential of the mission for various operational and scientific applications domains has been demonstrated by many concrete results.

The operational use of Sentinel-1 data by CMEMS (Copernicus Marine Environment Monitoring Service) for sea-ice and iceberg monitoring started on 30 September 2014, with the provision of data in near-real time for an agreed set of priority areas. Sentinel-1 provides unprecedented radar coverage of the polar regions (an example is in Figure 61) and constitutes a major source of data for the CMEMS operational monitoring activities.

Sentinel-1A responded to 17 activations from CEMS (Copernicus Emergency Management Service) and to 16 calls from the International Charter on Space and Major Disasters. These activations were mainly related to large floods and major earthquakes. In some cases no dedicated satellite tasking was necessary, thanks to the pre-defined observation plan that ensures large scale systematic mapping (e.g. Europe and global tectonic areas), with the 250 km swath of the Interferometric Wide swath mode.

Perspectives: With Sentinel-1A in orbit since 2 years, the huge demand of Sentinel-1 data demonstrates the success of the mission, characterized by a large-scale regular mapping and a very high and systematic throughput in terms of product generation and delivery. Today Sentinel-1A operations generate about 3.5 TB of data per day. With the inclusion of Sentinel-1B, and in particular the use of the EDRS (European Data Relay System), it is expected, once the Full Operations Capacity will be reached, that more than 10 TB of data will be available daily. The Sentinel-1 mission is seen as a game changer in operational SAR missions for the decades to come.

Table 3: Overview of the overall Sentinel-1 mission status in June 2016 with focus on the Sentinel-1A routine operations activities that started in June 2015 following the operational qualification phase, in terms of mission achievements, mission observation scenario, ground segment operations, throughput and data access. 68)
Figure 58: Sentinel-1A production volume evolution (image credit: ESA)
Figure 59: Evolution of number of Sentinel-1A products downloaded by users since opening in Oct 2014 (image credit: ESA)
Figure 60: Evolution of number of Sentinel-1A products available for download since opening in Oct 2014 (image credit: ESA)
Figure 61: Mosaic of Sentinel-1A data acquired on October 27-29, 2015. Daily ice drift is derived from consecutive overlapping scenes (image credit: ESA, the image contains modified Copernicus Sentinel data (2015)/ ESA/DTU/CMEMS)

• June 2016: The Sentinel-1B spacecraft has been launched on 25 April 2016, two years after Sentinel-1A to complete the Copernicus Sentinel-1 constellation. After its launch, the LEOP Phase was successfully completed in less than three days when all subsystems were checked. The SAR instrument was switched on, checked up and acquired the first images that were downloaded and processed by the operational Ground Segment. At present, the four-month Commissioning Phase is on-going; it includes the in-orbit Calibration and Characterization and the verification of the satellite, in order to deliver a full functional and well performing satellite to the mission operations mid September 2016. 69)

- The on-going IOCP (In-Orbit Commissioning Phase) comprises the commissioning of all spacecraft (i.e. platform subsystems, SAR payload, and the Optical Communication Payload interface) and Ground Segment components. It will conclude with the IOCR (In-Orbit Commissioning Review) in September.

- For the SAR instrument switch-on and check-out, some SAR acquisitions in IW (Interferometric Wideswath) mode were performed. These first images were taken just 56 hours after lift-off, two hours after SAR instrument switch-on (see Figure 65) and revealed already an excellent instrument performance. They were processed by the Sentinel-1 operational processor and adjusted to the non-nominal orbital parameters by the Ground Segment Team.

- Commissioning phase: Being the Ground System already commissioned during the Sentinel-1A commissioning phase and subsequent ground segment rump-up phase, the Sentinel-1B System Commissioning comprises only the commissioning of all Spacecraft components. This includes the following activities:

a) Spacecraft in-orbit verification (i.e. platform and payload)

b) SAR calibration and system performance verification

c) SAR cross-calibration with Sentinel-1A

d) Functional verification of the Sentinel-1B basic SAR products (i.e. L0 and L1b products w.r.t. SAR instrument performance and parameter settings

e) Functional verification of the OCP (Optical Communication Payload) interface. OCP is a laser communication terminal that is designed to send and receive data from a similar terminal located on another satellite, such as the geostationary EDRS.

- IOC main activities: The Sentinel-1B commissioning is planned for a period of 6 repeat orbit cycles (12 days each) once the reference orbit is reached. The commissioning phase will, therefore, have two sub-phases corresponding to the period determined to acquire such final reference orbit (Orbit Acquisition Phase) and once the reference orbit is acquired (Reference Orbit Phase).

• June 2016: Performance results of Sentinel-1A & Sentinel-1B repeat-pass SAR interferometry (InSAR) verification, using data acquired with the novel IW (Interferometric Wide-swath) mode. The IW mode, operational for the first time, utilizes ScanSAR-type burst imaging with an additional antenna beam steering in azimuth referred to as TOPS (Terrain Observation with Progressive Scans). 70)

- The Sentinel-1 SAR instrument with its active phased array antenna supports four exclusive imaging modes providing different resolution and coverage: Interferometric Wide Swath (IW), Extra Wide Swath (EW), Stripmap (SM), and Wave (WV). All modes, except the WV mode can be operated in dual polarization.

- Both the IW and EW mode use the TOPS technique to provide large swath width of 250 km at ground resolution of 5 m x 20 m and 400 km at ground resolution of 20 m x 40, respectively with enhanced image performance as compared to the conventional ScanSAR mode.

- The characteristic of the TOPS SAR imaging mode is that, besides the scanning in elevation, the antenna azimuth beam is steered from aft to the fore at a constant rate. As a result and in contrary to ScanSAR, all targets on ground are observed by the entire azimuth antenna pattern. This eliminates almost entirely the scalloping effect and also leads to constant azimuth ambiguities and SNR (Signal-to-Noise Ratio) along azimuth. - However, the fast azimuth beam steering reduces the target dwell time causing a lower spatial azimuth resolution than is achievable in Stripmap mode.

- The Sentinel-1 A& Sentinel-1B SAR constellation mission enables the build-up of long and equidistant InSAR IW mode data time series with a 6-day repeat-pass interval for geophysical applications, such as surface change detection monitoring.

• May 26, 2016: Cyclone Roanu has claimed over 100 lives in Sri Lanka and Bangladesh, and has left tens of thousands in need of aid. Officials are looking to the sky for information on flooded areas to analyze the cyclone’s aftermath and support emergency response activities. On May 23, the Sentinel-1A satellite captured about 80% of the country of Bangladesh during a single pass. The images were quickly delivered to the Copernicus EMS (Emergency Management Service) to create flood maps, revealing over 170,000 hectares of land to be inundated. 71)

- The response to the request for data was quick, as was the generation of flood information by EMS: less than 30 hours from activation to the delivery of the first flood map. A ‘rush mode’ to process and make Sentinel-1 data available for EMS has been set up in order to reduce the response time as much as possible.

- The Sentinel-1 mission for Europe’s Copernicus program is revolutionizing the use of satellites in managing risk assessment and emergency response with the provision of large-scale radar data in a systematic fashion. Sentinel-1A can map a 250 km-wide strip while achieving a ground resolution of 20 m per pixel. The radar on Sentinel-1 is able to ‘see’ through clouds, rain and in darkness, making it particularly useful for monitoring floods, usually connected to bad weather conditions. Images acquired before and after a flood offer immediate information on the extent of inundation and help to assess property and environmental damage.

- The International Charter for Space and Major Disasters also requested data for flood maps in western Sri Lanka – hit by the precursor of the cyclone on 16 May. The Charter was triggered by the Disaster Management Center of Sri Lanka on 17 May, channelled through the Asian Disaster Reduction Center.

- In response to Cyclone Roanu, additional Sentinel-1A radar scans are planned for the coming days to help the relief activities further. Once the twin satellite – Sentinel-1B – is operational, the mission’s potential revisit time will be cut in half, further improving the response time to disasters.

Figure 62: Sentinel-1A flood map of Barguna, Bangladesh, acquired on May 23, 2016; showing over 85,000 hectares of flooded areas in light blue (image credit: Copernicus Service information (2016) / Copernicus EMS / e-GEOS)

• May 11, 2016: The Antarctic Peninsula is a narrow mountainous finger or spine of land extending northwards away from the Central Antarctic ice sheet and comprises the northernmost arm of the Antarctic ice sheet (Figure 63). 72)

- The color scale indicates the speed of ice movement in meters per day, ranging from 1 cm/day or less in dark blue to up to 1 m/day in red. The vivid colors trace a complex network of channels along which streams of ice flow from the high mountains down towards the coast where the ice flow speeds up and spreads out into floating ice shelves. The white area on the western flank of the peninsula is where snowfall is likely to have concealed features and so prevented tracking between the image pairs.

- As one of the most dynamic glacial environments on Earth, this region has been experiencing rapid climate warming over recent decades. Since 1991, satellites such as ESA’s ERS and Envisat have observed the disintegration of various ice shelves, including the northern portion of the Larsen ice shelf and the Wilkins ice shelf.

- This example shows the spectacular potential of the Sentinel-1 mission for routine mapping and monitoring the surface velocity of glaciers and ice sheets. The combination of Sentinel-1A and -1B will support comprehensive and long-term monitoring of changes in ice sheet velocity and how they respond to climate change.

Figure 63: Successive radar images captured by the Copernicus Sentinel-1A satellite during December 2014 – March 2016 were used to create this spectacular map showing how fast the ice flows on the Antarctic Peninsula. The map was constructed by tracking the movement of ice features in pairs of radar images taken 12 days apart (image credit: ESA, contains modified Copernicus Sentinel data (2015), processed by Enveo)

• May 6, 2016: Figure 64 of the Sentinel-1A SAR instrument shows the Zachariae glacier on the northeast cost of Greenland. The shades of grey on the left side of the image depict the static landmass, while the colors on the right show changes in sea-ice type and cover between the three radar scans. Near the center-left we can see the Zachariae Isstrom (Isstrφm is Danish for ice stream) glacier, which began its "accelerated retreat" in 2012 and is currently losing about five billion tons of ice a year to the ocean. 73)

- Zachariae’s dynamics have been changing over the last few years, calving high volumes of icebergs, which will inevitably affect sea levels. It is estimated that the entire Zachariae Isstrom glacier in northeast Greenland holds enough water to raise global sea levels by more than 46 cm.

- Scientists have determined that the bottom of Zachariae Isstrom is being rapidly eroded by warmer ocean water mixed with growing amounts of meltwater from the ice sheet surface. 74)

- Zachariae and the nearby Nioghalvfjerdsfjorden to its north are two of six glaciers being monitored in near-real time by Sentinel-1 through a new web portal by the UK’s CPOM (Center for Polar Observation and Modelling). The portal provides frequent maps of ice velocity of key glaciers in both Greenland and Antarctica.

- The polar regions are some of the first to experience and visibly demonstrate the effects of climate change, serving as barometers for change in the rest of the world. It is therefore critical that polar ice is monitored comprehensively and in a sustained manner.

Figure 64: SAR image taken over part of northeast Greenland’s coast combines three images from Sentinel-1A’s radar observed on 15 February, 10 March and 3 April 2016 (image credit: ESA, the image contains modified Copernicus Sentinel data (2016), processed by ESA)

• April 28, 2016: Sentinel-1B has produced its first images only two hours after the radar was switched on – a record time for a space radar. The first observations were taken a little more than two days after launch, after Sentinel-1B had followed a complicated routine to deploy its 12 m-long radar and two 10-m long solar wings, as well as passing a series of initial checks. The first image (Figure 65), 250 km wide and 600 km long, captured Svalbard, the Norwegian archipelago in the Arctic Ocean, with the Austfonna glacier clearly visible. 75)

- At ESA’s operations center in Darmstadt, Germany, mission controllers thoroughly checked the satellite’s control, navigation and power systems, among others, during the intense first few orbits. The team also conducted the complex unfolding of the radar wings and solar arrays.

- When Sentinel-1B reaches its final orbit, on the other side of Earth from Sentinel-1A, the radar vision constellation will be complete, meeting the coverage and revisit needs of Copernicus. In the coming months, the satellite will be tested and calibrated before it is declared to be operational.

Figure 65: Sentinel-1B’s first data strip stretches 600 km from 80ºN through the Barents Sea. The image, which shows the Norwegian Svalbard archipelago on the left, was captured on 28 April 2016 at 05:37 GMT - just two hours after the satellite’s radar was switched on (image credit: ESA, contains modified Copernicus Sentinel data [2016], processed by ESA)
Figure 66: This full resolution subset of the first Sentinel-1B image shows Norway’s Nordaustlandet island in the Svalbard archipelago, covered by the Austfonna ice cap ((image credit: ESA, contains modified Copernicus Sentinel data [2016], processed by ESA)

• April 27, 2016: Following liftoff on 25 April from Europe’s Spaceport in French Guiana, Sentinel-1B has opened its large solar wings and radar antenna. 76)

- After its launch, Sentinel-1B has followed a carefully planned sequence over 10 hours to open its large radar antenna and solar wings. During ascent, the satellite’s 12 m-long radar antenna and two 10 m-long solar wings were folded up to fit into the Soyuz rocket’s protective fairing. They opened together in a specific sequence, which also allowed power from the solar panels to be available as soon as possible, so that the satellite no longer depends on batteries.

- ESA’s Sentinel-1 project manager, Ramón Torres, said, “The launch last night meant that we were able to forget the disappointment of the delays of the last few days in the blink of an eye. “We had a long night, staying awake to make sure the radar and solar panels deployed properly after the satellite had separated from the rocket. All of this was commanded by the team at ESA ’s mission control in Germany. “The deployment is particularly complicated because of the sizes involved but all went well and the teams and I are extremely happy that we now have two Sentinel-1 satellites safely in orbit.”

Figure 67: Artist's rendition of the Sentinel-1B satellite delivery into orbit (image credit: ESA)

• April 26, 2016: The launch of Sentinel-1B went according to plan; the spacecraft was placed into its orbit (altitude = 693 km) 23 minutes and 35 seconds after launch (launch mass of 2164 kg). Sentinel-1B is the fourth in a series of Sentinel satellites for the European Copernicus program, a joint project of the EC (European Commission) and ESA (European Space Agency).

Deployment sequence of the secondary payloads: 77) 78)

- The trio of "Fly Your Satellite!" student-built CubeSats were released into space at 23:50 GMT (2 hours 48 minutes after liftoff). Transmissions from the Fregat upper stage show that the door on the CubeSat deployer opened regularly, around 2 hours and 48 minutes after launch. Now the CubeSats are travelling in their final orbits, and their university teams are waiting for them to establish contact. - In the first hour of flight, the CubeSats will be working autonomously in order to stabilize their motion, perform an internal health check, and deploy their antennae. Then they will establish communication with Earth.

Figure 68: Artist's rendition of the CubeSats orbiting Earth (image credit: ESA, Medialab)

- The CubeSats were deployed into an elliptical orbit of 665 km x 453 km. From this orbit they will re-enter Earth’s atmosphere in approximately 8 years, preventing they become space junk after their missions are over.

- The MicroSCOPE minisatellite of CNES was the last deployment in the launch sequence at 01:02 GMT (4 hours into the flight) on April 26.

• April 22, 2016: The swirling landscape of Iran’s salt desert, Dasht-e Kavir, is reminiscent of an abstract painting in this Sentinel-1 image (Figure 69). With temperatures reaching about 50ºC in the summer, this area sees little precipitation, but runoff from the surrounding mountains creates seasonal lakes and marshes. The high temperatures cause the water to evaporate, leaving behind clays and sand soils with a high concentration of minerals. The ‘brushstroke’ patterns are geological layers eroded primarily by wind. 79)

- Iran is one of the world’s most important mineral producers. Earth-observing satellites are useful for finding and monitoring natural resources like minerals.

- Along the left side of the image we can see part of an area known as the ‘devil’s dunes’ because it was believed to be haunted by evil spirits. This belief likely originated from its hostile conditions, and the early travellers who did attempt to cross it probably never returned due to starvation or dehydration.

Figure 69: This image combines three scans from Sentinel-1A’s radar, acquired on 21 January, 14 February and 9 March 2016. Changes between the acquisitions appear in vibrant bright colors – such as the blues, reds and greens we see primarily on the left half of the image. These areas are salt lakes and the colors show fluctuations in the amount of water present over time (image credit: ESA, contains modified Copernicus Sentinel data [2016], processed by ESA)

• April 21, 2016: Images from the Sentinel-1A satellite are being used to monitor aquaculture in the Mediterranean, in another example of the mission’s contribution to food security, as fisheries become the main source of seafood. The satellite counted nearly 4500 fish cages over six months, mainly of mussel racks or finfish, along the western Mediterranean’s coastline (Figures 70 and 71). The number of fish hatching cages in the Mediterranean was not known before this survey. Farming finfish, shellfish and aquatic plants is one of the world’s fastest growing food sectors, which already provides the planet with about half of the fish we eat. 80)

- Aquaculture surpassed wild fisheries as the main source of seafood in 2014, according to the UN FAO (Food & Agriculture Organization). This reflects the earlier transformation of land from hunting to farming. The EU’s aquaculture furnishes a fresh, local supply of healthy seafood, following strict rules that protect the consumer, the fish and the environment.

- ESA is promoting the innovative use of satellite data for aquaculture through its SMART (Sustainable Management of Aquaculture through Remote sensing Technology) project. Remote sensing of oceans is a window into the marine ecosystem, providing essential information for their governance. Satellites can cover site locations, map aquaculture facilities, monitor meteorological events, provide early flood warnings and track water pollution.

- Giuseppe Prioli, President of the European Mollusc Producers’ Association, says: “The services being tested in SMART could be very useful for supporting shellfish industry in Italy. In particular, near-realtime data on water quality parameters at each farm, such as sea-surface temperature, chlorophyll content and turbidity, are important for farmers because they affect shellfish growth. “Short-term forecasting of shellfish biomass will also help in planning the harvest. The assessment of the potential biomass yield in a given area, based on Earth observation data, could also be useful for reallocating farms or starting the farming of new species, such as oysters, along the Emilia-Romagna coast.”

- The mission benefits numerous services, which relate to the monitoring of Arctic sea-ice extent, routine sea-ice mapping and surveillance of the marine environment. This includes oil-spill monitoring and ship detection for maritime security, monitoring land-surface for motion risks, mapping for forest, water and soil management, and mapping to support humanitarian aid and crisis situations.

- Its twin Sentinel-1B will soon create a constellation of two satellites orbiting 180° apart. The mission will be able to revisit a point on Earth in less than six days, providing more frequent coverage for aquaculture.

Figure 70: The ESA SMART (Sustainable Management of Aquaculture through Remote sensing Technology) poster features the nearly 4500 fish cages detected in the western Mediterranean Sea by Sentinel-1 and other satellites (image credit: ESA, contains modified Copernicus Sentinel data [2016] / ESA / ACRI / Bluefarm / Ifremer)
Figure 71: Sentinel-1 detected fish cages in the Western Mediterranean Sea (image credit: ESA, contains modified Copernicus Sentinel data [2016] /ESA/ACRI) 81)

• April 15, 2016: The Sentinel-1A satellite takes us over to Ireland, in this multi-temporal color composite of land coverage across the island (Figure 72). With a coastline of 7500 km, Ireland is home to some 4.8 million people and a wealth of history and tradition. Stretching 486 km from north to south and 275 km from east to west, Ireland is washed by abundant rainfall all year, coating the country in omnipresent emerald-green grasslands. 82)

- The coastal mountain fringes in the west, northwest and east are composed mainly of granite, while old red sandstone predominates in the south. Many lakes, large bog areas and low ridges make up the very scenic lowland, as seen throughout the image.

Figure 72: This Sentinel-1 image was stitched together from 16 radar scans by the satellite during May 2015, and gives us an idea of the island’s land cover and use. Different colors show changes that occurred within the 12 days’ coverage. The blues across the entire image represent strong changes in bodies of water or agricultural activities such as ploughing. The yellows represent urban centers, with the capital city of Dublin very distinct on the far middle right. An interesting feature is the many yellow ‘spots’ scattered throughout the entire island, visible even more clearly when zooming in. These clusters all represent farmhouses. Vegetated fields and forests appear in green. The reds and oranges represent unchanging features such as bare soil or possibly rocks that border the forests, as is clear on the left side of the image, along the tips of the island (image credit: ESA, Contains modified Copernicus Sentinel data [2015], processed by ESA)

• April 14, 2016: Multiple satellites, including Europe’s Sentinels, have captured images of two large icebergs that broke away from Antarctica’s Nansen ice shelf on 7 April. The icebergs are drifting to the northeast, propelled by wind, tides and currents. Experts say they do not pose any immediate threat of blocking supply routes to research stations such as the Italian Mario Zucchelli and South Korean Jang Bogo Stations in Terra Nova Bay. 83)

- Nonetheless, the icebergs may pose a threat to sea-floor moorings in the region that have been used by Italy’s National Antarctic Program since the 1990s, and more recently by New Zealand ocean scientists. The Nansen ice shelf, around 50 km long and 25 km wide, developed a fracture over recent years. Ice shelves are particularly sensitive to climate change because they can melt from warm air at the surface and warming ocean waters below.

- “The crack was first observed during fieldwork in 1999 and was progressively growing, and then accelerating during 2014,” said Massimo Frezzotti from Italy’s ENEA research organization. “The events following were typical for a cycle of ice-shelf calving. Last century, a first calving event is known to have occurred between 1913 and the 1950s, with a second between 1963 and 1972.”

- As winter weather began to set in during early March this year, optical images from Europe’s Sentinel-2A satellite and radar images from Sentinel-1A, together with images from the Italian Cosmo-SkyMed mission, indicated that the ice front was only tenuously attached to the shelf.

- By 6 April, the fracture had reached about 40 km long before it severed the portion of the ice front between Inexpressible Island to the north and the Drygalski Ice Tongue – the floating end of the David Glacier – to the south.

- Verified by NASA’s Terra satellite, the calving took place on 7 April during persistent strong offshore winds. Two days later, Sentinel-1A’s radar confirmed the separation.

- “The area of the fracture was still negligible at the beginning of 2014, but between April 2015 and March 2016 it expanded from 11.68 sq km to 25.87 sq km, signalling a coming calving,” said Flavio Parmiggiani of Italy’s ISAC-CNR research organization.

- The fracture split the ice shelf along its length, resulting in two large icebergs measuring about 10 km and 20 km in length and 5 km across. Published research indicates that the bergs are likely to be around 250–270 m thick.

- Massimo Frezzotti explained, “History has shown that major calving typically occurs about every 30 years. The crack opened because of a difference in the velocity of ice between the northern Priestley Glacier and southern Reeves Glacier fed portions of the ice shelf, caused by the southern part being hooked and pulled along by the faster moving Drygalski Tongue.”

Figure 73: Sentinel-1A captured radar images of the Nansen Ice Sheet on 2 and 9 April 2016, before and after the calving event that gave birth to two large icebergs measuring about 10 km and 20 km in length and 5 km across (ESA, Contains modified Copernicus Sentinel data [2016], processed by ESA)

• April 8, 2016: The SAR image of Figure 74 shows part of the Swiss Alps (Bernese Alps). Near the center of the image are the lakes Thun (left most) and Brienz, with the city of Interlaken between them. In the upper-right section is Lake Lucerne. 84)

- In the lower-central part of the image we can see the Aletsch Glacier, the largest in the Alps. The glacier originates in a large, flat area of snow and ice high in the mountains called Concordia, where three smaller glaciers converge. Switzerland’s three famous Eiger, Mönch and Jungfrau mountains rise north of Concordia. The Aletsch Glacier extends south, and its meltwater creates the Massa River in the valley below.

- The glaciers in this region are showing long-term retreat from climate change. The melting ice has given birth to new lakes, which pose risks such as flooding and landslides to communities below.

- The radar imagery can be used to generate precise elevation models, and can also detect deformation over landslide, seismic or subsidence areas. Radar can also support impact assessment for many types of hazard such as geological events.

- Sentinel-1’s radar ability to ‘see’ through clouds, rain and in darkness makes it particularly useful for monitoring floods. Images acquired before and after a flood offer immediate information on the extent of inundation and support assessments of property and environmental damage.

Figure 74: Sentinel-1A image of the Swiss Alps, acquired on September 11, 2015 (image credit: ESA, Contains modified Copernicus Sentinel data [2015], processed by ESA)

• February 5, 2016: Figure 75 is a composite of radar scans by Sentinel-1A on different dates of the Siljan Ring, located in the province of Dalarna in central Sweden. Dalarna, a historical province known for its deep forests, beautiful fishing lakes and lush green landscapes, is a holiday residence for many Swedes and a favorite tourist attraction. 85)

- Sweden’s sixth largest lake, Siljan covers an area of 290 km2. Its particular shape comes from the location around the southwestern perimeter of the Siljan Ring, a circular geological formation created almost 400 million years ago by a major meteorite impact.

- Mainly eroded today, the original crater is estimated to have been some 50 km in diameter. It is the largest known impact crater in Europe and one of the 18 largest known impact craters on Earth.

- Given the location and the time of year, it is safe to infer that the landscape was dominated by vegetated areas, partly or completely frozen lakes and lots of snow. It is probably also safe to assume that most changes are related to variations in snow cover and snow condition.

- Focusing on the Siljan Lake, towards the central right part of the image, it is easy to make out the bright red and green lines, which come from changes in the ice edge and cover on the lake, in early spring.

- Southwest of the lake area, the town of Borlänge is clearly visible along the Dal River, appearing as bright white. Famous for its medieval cathedral of Stora Tuna and its important rail and bus junction, it became a commercial center for the surrounding agricultural and industrial areas. The town has paper mills, sawmills, engineering works, foundries, printing establishments and factories.

- The strikingly sharp blue to the east of Borlänge probably represents fresh snow, which fell sometime around the end of March and covered the flat agricultural fields, thus changing the ground properties.

Figure 75: The composite radar images, three scans of the same area of Sentinel-1A, were acquired on different dates and overlaid, with different colors assigned to each: red (7 February 2015), green (15 March 2015) and blue (27 March 2015). The colors represent changes on the ground between the various acquisitions (image credit: Copernicus Sentinel data (2015)/ESA)

• December 15, 2015: ESA has ensured the continuation of the Sentinel-1 Earth observation satellite series for Europe’s Copernicus environmental program by ordering two more satellites. The contract was signed today Thales Alenia Space of Italy to build Sentinel-1C and -1D. Thales Alenia Space will lead a consortium of 60 European companies, including Germany’s Airbus Defence and Space, responsible for the radar instrument. 86)

- The huge success of Sentinel-1A is highlighted by the number of users and downloads of data: more than 15 000 users have registered on the Sentinels scientific data hub, 2.5 million products have been downloaded – corresponding to 3 million GB of data – and 350 000 products are available online for download. With this new contract, ESA and its partners take on the commitment to prepare the replacements for Sentinel-1A and -1B, ensuring that users will have the data to feed the Copernicus services in the future.

• December 4, 2015: The SAR image of Figure 76 features the Netherlands as observed by Sentinel-1A in March 2015. The Netherlands borders the North Sea to the north and west, Germany to the east, and Belgium to the south. Home to some 17 million inhabitants, the country is extremely low-lying and remarkably flat, with large stretches of lakes, rivers and canals. With over 400 people/km2 , it is one of the most densely populated countries in the world. 87)

- With an eighth of the country lying below sea level,and half of the country below 1 meter above sea level, the North Sea is regarded as a threat to the country and the people. Following the huge flood of 1953, the whole area has been built up with a network of dikes and protective dams, which are clearly visible in the image. If the country were to lose the protection of its dunes and dikes, the most densely populated part of the Netherlands would be inundated, mainly by the sea, but also partly by the rivers.

- Clearly visible in the image are the typical, narrow and long green fields between Utrecht and Rotterdam, scattered with canals and smaller villages. The artificial island of Flevoland, which has been reclaimed from the Zuiderzee, an inland sea, is also visible.

- On the left side of the image is a river delta formed by the confluence of the Rhine, the Meuse and the Scheldt rivers, resulting in a multitude of islands. Rotterdam, Europe’s largest harbor, is visible at the northern edge, with ships waiting to enter the port in the North Sea.

Figure 76: This image is a mosaic based on Sentinel-1A satellite coverage of the Netherlands in three scans during March 2015 (image credit: Copernicus Sentinel data (2015)/ESA

• Oct. 30, 2015: The image of Figure 77 is the Manicouagan Crater which was carved out by an asteroid strike some 214 million years ago. This crater in Quebec, Canada is known to be one of the oldest and largest impact craters on the planet. Experts believe that glaciers have since played a large part in its erosion. Its concentric structure results from the shock waves transmitted by the impact. These somewhat resemble the rings that form when a pebble is dropped into water. So big and distinct, the crater can easily be observed from space. 88)

- The multiple-ring structure is some 100 km across, with the 70 km-diameter inner ring its most prominent feature. The annular Manicouagan Reservoir lake stretches more than 550 km from the source of its longest headstream.

- This image was taken by Sentinel-1A, illuminating the landscape with horizontal and vertical radar pulses, from which the artificial color composite was generated. Diverse colors highlight variations of land cover. The varying tones of the same color represent a difference in the land’s condition. Hence, while the blue tones represent bodies of ice and some water, the yellow and orange tones denote ageing vegetation of different types, mixed with patches of snow and ice.

Figure 77: This false-color SAR image, featuring the Manicouagan Crater, was captured by the Sentinel-1A satellite on 21 March, 2015 (image credit: Copernicus Sentinel data (2015)/ESA)

• October 9, 2015: This Sentinel-1A radar image of Figure78 was processed to depict water in blue and land in earthen colors. It features some of the Azore islands about 1600 km west of Lisbon, Portugal, including the turtle-shaped Faial, the dagger-like Sao Jorge and Pico Island, with Mount Pico reaching over 2351 m in height. The image highlights the differences in the relief of the islands, with volcanoes and mountains clearly standing out. 89)

- Faial is part of the central group of the Azores. The surface area covers 173 km2. It has some 15,000 inhabitants and its main municipal seat is the city of Horta. Different shades of blue decorate the houses, which divide the fields and line the roads, giving Faial the name ‘Blue Island’.- In the 18th century, the development of whale hunting brought whaling fleets to Horta. By the 19th century, Horta had become an important seaport and a layover for a large number of yachts crossing the Atlantic. Along with other islands in the archipelago, Faial is of volcanic origin. In 1957, a big eruption about 1 km from the coast ejected large quantities of lava and ash, forming an islet that later became connected to Faial island by an isthmus.

- Unique among the islands of the Azores, São Jorge is uncharacteristically long and slender, and so susceptible to ocean erosion. The island is 55 km in length, with a mountain range forming its backbone. At 1053 m, Pico da Esperança is its highest peak. The island has an area of 246 km2, with an obvious difference in the relief between the western and eastern sections: the western coast is lined with cliffs, while the east is smoother. Similarly, the northern coast has sharp cliffs, while the southern side is less inclined. The island’s 9500 residents have lived in relative isolation for many years. Disturbed only by seldom visits from the authorities, commercial boats from the local islands, or the occasional aristocrat who comes to contemplate the local scenery, life on São Jorge is very relaxed.

- Named after its imposing mountain, Pico Island is one of the most beautiful and underrated islands of the Azores. Its history was forged on whaling and wines. The famous Pico wines and the UNESCO world patrimony designated vineyards, as well as wooden boat building, are contemporary features of Pico. Whale hunting gave way to a movement of study and observation of whales, dolphins and other sea mammals. Since volcanic eruptions ended 300 years ago, Pico is considered dormant, adding to the island’s mystery and making it a magnet for scientists.

Figure 78: The Sentinel-1A radar image of the Azore islands was captured on March 16 and release on October 9, 2015 (image credit: Copernicus Sentinel data (2015)/ESA)

There are nine major Azorean islands and an islet cluster, in three main groups. These are Flores and Corvo, to the west; Graciosa, Terceira, São Jorge, Pico, and Faial in the center; and São Miguel, Santa Maria, and the Formigas Reef to the east. They extend for more than 600 km and lie in a northwest-southeast direction.

Figure 79: Distribution of the islands of the Azore archipelago (image credit: Wikipedia)

• Sept. 21, 2015: On 16 September 2015, an 8.3 magnitude earthquake struck the coast of central Chile, triggering tsunami warnings and coastal evacuations. Lasting three minutes, this powerful earthquake occurred along the boundary of the Nazca and South American tectonic plates. 90)

- By combining Sentinel-1A radar scans from 24 August and 17 September, the rainbow-colored patterns in the image show how the surface has shifted as a result of the quake. ‘Interferograms’ such as these allow scientists to quantify ground movement. By counting the ‘fringes’, it is estimated that the earthquake caused a displacement of 1.4 m along the viewing direction of the radar observation. In addition, a 0.5 m horizontal movement is estimated along the flight direction of the satellite.

Figure 80: Interferogram of the Chile earthquake on Sept. 16, 2015, generated from two Sentinel-1A radar scans on Aug. 24 and Sept. 17, 2015 (image credit: Copernicus Sentinel data (2015)/ESA SEOM INSARAP study PPO.labs/NORUT)

• August 2015: The Sentinel-1A routine operations are on-going. The observation scenario supports the systematic coverage of a first set of Copernicus Services areas of interest, of European land and coastal waters, of global tectonic/volcanic areas, as well as of other specific targets worldwide for various applications. The observation plan also includes regular mapping of all land areas worldwide. The dedicated campaign for Antarctica ice sheet monitoring is on-going and will run till early October 2015 indicatively. 91)

A pre-defined observation plan necessitates solving, a priori, the potential conflict among users (e.g. different SAR operation modes or polarization schemes required over same geographical area). During the ramp-up exploitation phase, the Sentinel-1 observation plan gradually evolves in line with the increasing operational capacity. Accordingly, the observations and volume of data available to Sentinel-1 operational users gradually increase during this period. Within the predefined observation plan, the Sentinel-1 mission ensures observations fulfilling the following two main categories of services:

1) Monitoring services related to oceans, seas and sea-ice. These services require quasi real-time or near real-time data, typically in less than 3 hours, and in some cases in less than 10 minutes. Quasi real-time services or services requiring data within 1 hour from sensing require reception by local stations. Most of these monitoring types of services require systematic or very frequent (e.g. daily) observations.

2) Services/applications over land. These services or applications cover a wide range of different thematic domains. They generally do not require data in quasi real-time and few of them require data within 3 hours (near real-time) from sensing. Related data are mostly planned to be recorded on-board and downloaded to the core ground station network. Products not required in near real-time will be available within 24 hours from sensing.

The high level Sentinel-1 observation strategy during full operations capacity is based on:

- optimum use of SAR duty cycle (25 min/orbit), taking into account the various constraints (e.g. limitation in the number of X-band RF switches, mode transition times, maximum downlink time per orbit and maximum consecutive downlink time)

- optimum use of single and dual polarization acquisitions, in line with the available downlink capacity

- Wave Mode (WV) continuously operated over open oceans, with lower priority versus the high rate modes

- Interferometric Wide Swath (IWS) and Extra Wide Swath (EWS) modes operated over pre-defined geographical areas: a) over land: pre-defined mode is IWS, b) over seas and polar areas, and ocean relevant areas, the pre-defined mode is either IWS or EWS.

In exceptional cases only, emergency observation requests may alter the pre-defined observation scenario, possibly requiring use of the Stripmap (SM) mode.

Over land, it is planned to systematically make use of the same SAR polarization scheme over a given area, to guarantee data in the same conditions for routine operational services and to allow frequent InSAR. Depending on the area, the selection is either vertical or horizontal, the choice being made according to the main application behind. As a general principle, the polarization scheme follows the following logic:

- HH-HV or HH polarization for the monitoring of polar environments, sea-ice zones

- VV-VH or VV polarization for all other observation zones (with an exception for the Baltic Sea observed partially in HH-HV during northern winter, on descending orbits).

Table 4: Overview of the Sentinel-1 observation scenario 92)

• August 2015: Sentinel-1A works in a pre-programmed operation mode to avoid conflicts and to produce a consistent long-term data archive built for applications based on long time series. For all existing modes, ESA routinely produces the so-called level 2 ocean product (L2 OCN) which ocean surface wind, ocean surface radial velocities and ocean swell spectra (only for Wave Mode and Stripmap image Modes) geophysical quantities are included. 93)

- Sentinel-1A ensures the continuity of global swell spectra measurements from space already available since 1991 with ERS-1, ERS-2 and ENVISAT/ASAR thanks to the so called Wave Mode. This acquisition mode is dedicated to swell measurements in open ocean. The ESA Ocean Swell product already available at IFREMER/CERSAT (Centre ERS d'Archivage et de Traitement), France, for the past missions will be routinely produced and freely available to the scientific community. On Sentinel-1A, the Wave Mode has been improved to get a larger swath and a better resolution resulting, among other benefits, in extending the range of retrieved swell wavelengths and opening research opportunities for investigations of wave groups parameters. A new "leap frog" acquisition pattern has also been designed for the Wave Mode to maximize both coverage and sampling of swell systems propagating across the ocean. This new capacities will be presented to assess ocean swell spectra performances and discuss its capacity to measure the ocean surface velocities from space in open ocean.

- In coastal areas, acquisitions will be performed in extended and interferometric wide swath modes, where only wind and radial velocities are produced by ESA.

• August 2015: The C-SAR instrument is specifically designed to carry out interferometric analyses over land, thus allowing the user to analyze Earth’s surface displacements through the SBAS/DInSAR (Small BAseline Subset/Differential Interferometry SAR) technique, for the generation of Sentinel-1A IWS (Interferometric Wide Swath) deformation time-series. Due to the TOPS (Terrain Observation by Progressive Scans) mode characterizing the IWS acquisitions, the existing SBAS processing chains were properly adapted with new procedures for efficiently handling the Sentinel-1A data. 94)

- The developed DInSAR processing chain has been applied to process IWS Sentinel-1A data acquired during these first months of operation. In Figure 81, some examples of the retrieved interferograms are shown, relevant to Italy, Sakurajima volcano (Southern Japan) and Fogo volcano (Cape Verde). The presented examples demonstrate that the developed DInSAR processing chain is able to process IWS SAR data. In particular, the registration step is correctly performed, and no residual phase ramps or jumps between consecutive bursts are present.

Figure 81: Interferograms retrieved by processing Sentinel-1A IWS data, relevant to A) Italy, B) Sakurajima volcano (Japan), and C) Fogo volcano (Cape Verde), image credit: IREA-CNR, Università degli Studi di Napoli 'Federico II', Vienna University of Technology, Università di Roma 'La Sapienza'

• July 24, 2015: The image of Figure 82 shows the southern part of Germany’s state of Bavaria, with the city of Munich on the right and Augsburg at the center. Munich is located on the elevated plains just north of the Alps. Zooming in, one can clearly see the river Isar flowing through the city. 95)

- The landscape in this pre-alpine region was shaped by ice-age glaciers, including the two larger lakes southwest of Munich – Lake Starnberg, which reaches to the bottom of the image, and the Ammersee to the west – that are remnants of the glaciers.

Figure 82: This image combines three radar scans of the Sentinel-1A satellite, acquired in March and April 2015 (image credit: Copernicus Sentinel data (2015)/ESA)

• On June 26, 2015, ESA released the Central California image (Figure 83) of the Sentinel-1A mission. The San Andreas Fault – the border between two tectonic plates – is visible as a somewhat straight line running from the upper-left corner of the image close to the bottom center. The Pacific Plate to the west is moving in a northwest direction, while the North American plate to the east is shifting southeast. This horizontal scraping is happening at up to about 5 cm a year in some parts of the fault. 96)

- The fault is responsible for the high earthquake risk in the area, including the 6.0 magnitude shock that struck the town of Parkfield in 2004.

- Surrounding the fault are the mountains of the Southern Coastal Ranges. With a predominantly Mediterranean climate, these mountains have a range of plant communities including oak woodland, mixed evergreen forests and savannahs.

- East of the Ranges is the San Joaquin Valley, where one can see the geometric shapes of large-scale agricultural production. Major crops include grapes, cotton, nuts and fruits, with productivity relying on irrigation from surface water diversions and groundwater pumping from wells. - Drought in recent years has led to water shutoffs and cutbacks, severely hindering yields in what was once the country’s most productive agricultural region.

- Further east along the right side of the image are the foothills of the Sierra Nevada mountains.

Figure 83: This image, captured by the C-SAR instrument of Sentinel-1A on April 1, 2015, shows a central region of California in the US (image credit: Copernicus data (2015)/ESA)

• June 5, 2015: The Chinese city of Tianjin is captured in this Sentinel-1A radar image (Figure 84) created by combining three scans over several months. The city is located to the west of the Bohai Bay within the Bohai Gulf (Yellow Sea). With a population of over 14 million people, this megacity is among China’s five largest. 97)

- Urban areas are home to over half of the world’s population, and are rapidly changing environments. As more people move from rural areas to cities, this growth needs to be monitored to help it proceed on a sustainable basis. High-resolution satellite data provide essential information for city planning and for the sustainable development of urban regions. Radar in particular can be used to monitor slight ground movements down to a few millimeters – valuable information for urban planners and for risk assessment.

- Zooming in on the upper right of Figure 84, one can see different colors in the geometric agricultural fields, showing changes between the three acquisitions (22 October 2014, 14 January 2015 and 7 February 2015) that make up this image. In this area, the black shapes show divided areas covered in water, which are possibly shrimp or fish farms. Bohai Bay was traditionally home to the country’s richest fisheries, but pollution, overfishing and land reclamation has diminished this economic activity.

- Farther south, one can see numerous dots in the water – radar reflections from the boats coming to and from the Port of Tianjin. This massive maritime gateway handles hundreds of millions of tonnes of cargo each year, and is the largest in northern China.

- On the central-left side of the image, the black and bright green areas are water reservoirs. The upcoming Sentinel-2 mission – set for launch on 22 June – will be used to support the sustainable management of water resources by providing measurements of water quality and detecting changes.

Figure 84: Sentinel-1A radar image of Tianjin, China, captured in 3 acquisitions (22 October 2014, 14 January 2015 and 7 February 2015), image credit: Copernicus data (2014/2015)/ESA

• April 30, 2015: Based on data from the Sentinel-1A satellite, this image shows how and where the land uplifted and sank from the 7.8 magnitude earthquake that struck Nepal on 25 April 2015. DLR/EOC (German Aerospace Center/Earth Observation Center) has used data acquired by the ESA radar satellite Sentinel-1 over the earthquake region in Nepal to create a new regional aid map and calculate the ground displacements caused by the earthquake. The data were processed by the EOC to create an interferogram showing the surface displacements. 98) 99)

Figure 85: Based on data from the Sentinel-1A satellite, this image shows how and where the land uplifted and sank from the 7.8 magnitude earthquake that struck Nepal on 25 April 2015 (image credit: DLR/EOC)

Legend to Figure 85: A more than 90 km long and 30 km wide area around Kathmandu is affected. During the earthquake, tensions between the Indian and Eurasian plates were relieved and generated sudden ground movements of several meters. In the newly created map, the deformations are color-coded; near the plate boundary, the surface moved towards the satellite, that is, upwards (blue area). Further to the north there was related subsidence (yellow), a counter-movement that often occurs during earthquakes in subduction zones. In addition, the researchers detected a strong horizontal movement of up to 2 m in a north-south direction in the area. In the image, the locations of numerous aftershocks in recent days are also displayed. Scientists at the EOC are continuing to compare archival data of the area with the latest radar images from Sentinel-1A.

• April 29, 2015: On 25 April, a 7.8 magnitude earthquake struck Nepal, claiming over 5000 lives and affecting millions of people. Satellite images are being used to support emergency aid organizations, while geo-scientists are using satellite measurements to analyze the effects of the earthquake on the land. 100)

- Radar imagery from the Sentinel-1A satellite shows that the maximum land deformation is only 17 km from Nepal’s capital, Kathmandu, which explains the extremely high damage experienced in this area.

- By combining Sentinel-1A imagery acquired before and after the quake, changes on the ground that occurred between the two acquisition dates lead to rainbow-colored interference patterns in the combined image, known as an ‘interferogram’, enabling scientists to quantify the ground movement.

Figure 86: Interferogram over Kathmandu, Nepal, generated from two Sentinel-1A scans on 17 and 29 April 2015 – before and after the 25 April earthquake. Each ‘fringe’ of color represents about 3 cm of deformation. The large amount of fringes indicates a large deformation pattern with ground motions of 1 m or more (image credit: Contains Copernicus data (2015)/ESA/DLR Microwaves and Radar Institute/GFZ/e-GEOS/INGV–ESA SEOM INSARAP study)

- Under the Copernicus EMS (Emergency Management Service), ESA has been coordinating the collection of optical satellite imagery following the earthquake that struck Nepal on 25 April 2015. The satellite imagery is then used to create maps to support relief efforts, such as this ‘grading map’ of Kathmandu (Figure 87) showing topographic features and crisis information. The map is based on imagery from the WorldView-3 satellite acquired on 28 April. 101)

Figure 87: Kathmandu grading map (image credit: DigitalGlobe/European Commission)

- The Copernicus EMS was activated on the day the earthquake struck, prompting ESA to begin collecting satellite imagery, which is being made available to support relief efforts. In parallel, the International Charter Space and Major Disasters was activated by India, China and the UN. Partner Agencies of this initiative have been providing data and products over the area to relief organizations.

• April 24, 2015: The Florida peninsula is located between the Gulf of Mexico to the west, and the Atlantic Ocean to the east. The large body of water at the top of the image is the freshwater Lake Okeechobee. Covering about 1900 sq km, the lake is very shallow with a maximum depth of about 4 m. The lake is the largest freshwater lake in the state of Florida with a volume of ~5.2 km3. The southern region of Lake Okeechobee shows geometric patterns of agriculture and infrastructure, while the very lower section of the image shows part of the Everglades National Park. 102)

Figure 88: The Sentinel-1A SAR image shows part of southern Florida, acquired on Nov. 13, 2014 in interferometric wide swath mode. This is the default mode over land, and has a swath width of 250 km and a ground resolution of 5 x 20 m. The image was also acquired in 'dual polarization' horizontal and vertical radar pulses, from which the artificial color composite was generated (image credit: Copernicus data, ESA)

- The Everglades are the United States’ largest subtropical wilderness, originally covering some 10 ,000 km2, now the wilderness has a size of about 6000 km2. This area features shallow, slow-moving water and is abundant in a plant called sawgrass that becomes so thick it makes the water barely visible, earning the Everglades the nickname ‘River of Grass’. - Home to diverse plant and animal life, including alligator, crocodile, Florida panther and manatees, the Everglades have been designated a Wetland of International Importance by the Ramsar Convention on Wetlands, a World Heritage Site and an International Biosphere Reserve by the UN.

- Other notable locations visible in this image include the cities Miami (east of the Everglades), in the lower right, and the city of Fort Myers, built along the Caloosahatchee River, on the Gulf Coast of Florida.

• On April 3, 2015, the Sentinel-1A mission marked one year on orbit, providing radar vision for Europe’s Copernicus program. The Sentinel-1A satellite has completed a successful first year. Just weeks after its launch, its imagery was already being used to assist in emergency responses. Some of its first images were crucial in helping authorities in Namibia and the Balkans decide how to respond to a serious floods – both while the satellite was still in its early commissioning phase. 103)

- Sentinel-1A’s began supplying data operationally in October 2014. Within days, experts began using the data to monitor the marine environment. This included the production of ice charts, showing the details of ice conditions in a variety of regions, including the warnings of icebergs drifting in shipping routes to alert vessels. - Over the year, Sentinel-1A has also been used to monitor ice loss from ice caps and ice sheets, such as the Austfonna ice cap in Norway’s Svalbard archipelago. The first dedicated campaign observing the Greenland ice sheet was completed in March 2015.

- The flood of results that make Sentinel-1A’s first year such a success wouldn’t be possible without the rapid data dissemination and the Copernicus open access policy. To date, more than 6000 users have registered to access the 83,000 online data products. Since the data became available in October 2014, over half a million downloads have been made so far – the equivalent of about 680 TB of data. - To assist with data processing, product reading and analysis, the Sentinel-1 Toolbox is being used by over 1000 users in 70 countries.

• April 3, 2015: The image of Figure 89 shows a portion of Lake Baikal in Siberia. Baikal is the largest lake by volume in the world, containing over 23,000 km3 of freshwater, and is considered to be the oldest lake in the world. It sits in the Baikal Rift Zone where Earth’s crust is pulling apart. Hot springs are found under and around the lake. The area has over 1000 species of plants and 2500 species of animals. More than 80% of the animals found here are endemic. -Located on the Angara River, Irkutsk is a popular stop on the Trans-Siberian railway because of its close vicinity to Lake Baikal. 104)

Figure 89: The city of Irkutsk (center left) and part of Lake Baikal (right) are pictured in this Sentinel-1A image over Russia’s Siberia region (image credit: Copernicus data 2015, ESA)

Legend to Figure 89: This image combines three radar scans from the Sentinel-1A satellite on 11 January, 4 February and 24 March 2015, with each scan being assigned a color: red, green and blue. The colors present in Lake Baikal and the Angara River show the location of ice on the different dates.

• March 27, 2015: Sentinel-1 offers excellent capabilities for observing the velocities of Greenland’s outlet glaciers with unprecedented temporal resolution at complete spatial coverage, extending and enhancing the time series of ice-velocity maps available from previous satellite sensors. 105)

- The InSAR (Interferometric Synthetic Aperture Radar) technique is used where two or more images over the same area are combined to detect slight changes occurring between acquisitions. Tiny changes on the ground cause changes in the radar signal and lead to rainbow-colored interference patterns in the combined image, known as an ‘interferogram’. Precise measurements – down to a scale of a few millimeters – can be detected across wide areas. Tectonic plates grinding past one another, the slow ‘breathing’ of active volcanoes, the slight sagging of a city street through groundwater extraction, even the thermal expansion of a building on a sunny day.

- The Fringe Workshop — held at ESA/ESRIN in Frascati, Italy on March 23-27,2015 — takes its name from these colored fringes seen in the interferograms.

Figure 90: This image combines two Sentinel-1A radar scans from 3 and 15 January 2015 to show ice velocities on outlet glaciers of Greenland’s west coast (image credit: Copernicus data (2015), ESA, Enveo)

• March 27, 2015: The Aral Sea, located on the border between Kazakhstan and Uzbekistan in Central Asia, is a striking example of humankind’s impact on the environment and natural resources. Once the world’s fourth-largest inland water body, it has lost around 90% of its water volume since 1960 because of Soviet-era irrigation schemes. 106)

- As the water evaporated, it left behind a dry, white salt terrain now called the Aral Karakum Desert. Each year violent sandstorms pick up salt and sand from the desert and transport it across hundreds of kilometers, causing severe health problems for the local population and making regional winters colder and summers hotter.

- Chemicals in the dry plains from former weapons testing, industrial projects and fertilizer runoff exacerbates the effects of these storms on health. In addition, the area’s fishing industry – which once employed tens of thousands of people – has been devastated.

- The World Bank and Kazakhstan has worked together to build the Kok-Aral dyke to stabilize the northern section of the sea. The Aral Sea’s southern section – part of which is pictured here – was beyond saving and is projected to dry out completely by the end of this decade.

Figure 91: The Aral Sea, a multispectral image Sentinel-1A radar image (image credit: Copernicus data (2014/2015), ESA)

Legend to Figure 91: This image was created by combining three radar scans from Sentinel-1A, assigning each a color: red (from 17 October 2014), green (from 28 December 2014) and blue (from 14 February 2015). Different colors represent changes between the acquisitions. - In the lower right, the red, yellow and green boomerang shape shows where water flows into the dry seabed from a river, and colors show how the area covered in water increased over time. Along the left side of the image, the large dark area shows where water is still present. Colors along the water’s edge show water-level changes between acquisitions. Red shows a lower level than blue, so the water level was lower on 17 October 2014 than on 14 February 2015. - Zooming in on the lower-left corner, one can see the straight line of a road outside of the seabed, with white dots showing where the radar signal has reflected of human-made structures. White dots also appear further east, showing where structures have been built in the seabed.

• March 25, 2015: Sentinel-1A captured the fast-moving Pine Island glacier, which flowed about 100 m in less than two weeks. Pine Island is the largest glacier in the West Antarctic Ice Sheet and one of the fastest ice streams on the continent, with an average of over 4 km per year. About a tenth of the ice sheet drains out to the sea by way of this glacier. With its all-weather, day and night radar vision, the Sentinel-1 mission is an important tool for monitoring polar regions and the effects that climate change has on ice. 107)

Figure 92: Pine Island Glacier on Sentinel-1A’s radar [image credit: Copernicus data (2015), ESA, A. Hogg, University of Leeds, Centre for Polar Observation and Modelling (CPOM)]

Legend to Figure 92: This image, combining two scans by Sentinel-1A’s radar, shows that parts of the Pine Island glacier flowed about 100 m (in pink) between 3 March and 15 March 2015. Light blue represents stable ice on either side of the stream.

• March 20, 2015: In Figure 93, London appears as a cluster of bright radar reflections along the River Thames in this radar image from Sentinel-1A. The spacecraft captured this image on 4 March 2015 in its Interferometric Wide Swath mode and dual polarization, from which the artificial color composite was generated. 108)

Figure 93: Sentinel-1A SAR image of London captured on March 4, 2015 (image credit: Copernicus data, ESA)

• March 19, 2015: ESA and the UK Space Agency have signed an arrangement that establishes access to data from the Sentinel satellites, marking a significant step in their exploitation. Following the launch of Sentinel-1A in April 2014, the next in the series of satellites, Sentinel-2A, is scheduled for launch in June, 2015. 109)

- The Sentinel-2 mission will provide ‘color vision’ for Europe’s Copernicus environment monitoring program, with data being used to monitor plant health, changing lands, inland water bodies, the coastal environment and support disaster mapping. - Data from the Sentinel satellites and contributing missions to the Copernicus program are freely accessible for Copernicus Services, as well as to scientific and other users.

- The agreement aims to facilitate Sentinel data exploitation in the country. The UKSA (UK Space Agency) will coordinate ground segment activities in the UK – such as hosting, distributing, ensuring access and archiving Sentinel data – and act as an interface between ESA and national initiatives. This will be done through a ‘national mirror site’ at the Harwell Science, Innovation and Business Campus in Oxfordshire, where ESA’s space applications center, ECSAT (European Center for Space Applications and Telecommunications), is also based.

- The agreement also established ESA’s role as coordinator of the Copernicus ‘space component’. The Agency will ensure direct access to Sentinel data, provide technical advice on the setting up of data acquisition and dissemination, and make data processing and archiving software available to national initiatives. - A total of seven Participating States have now signed the agreement: Greece, Norway, Italy, Finland, Germany, France and the UK.

•March 2015: A Red Alert has been declared in southern Chile after the eruption of the Villarrica volcano early on 3 March. Thousands of residents in the area have been evacuated and the International Charter Space & Major Disasters has been activated by Chile's risk management authority ONEMI. 110)

Figure 94: Surface changes of Villarrica from Sentinel-1A (image credit: Copernicus data/ESA (2015), map produced by the German Remote Sensing Data Center of DLR)

• Figure 95, released on Feb. 20, 2015 in ESA's 'Earth from space video program, shows the Baltic country of Estonia – with the political borders in white – is pictured in this mosaic of eight scans by Sentinel-1A’s radar from October to December 2014.

Figure 95: Sentinel-1A SAR mosaic of Estonia acquired in 8 scans from October to December 2014; the scans were recorded in ‘dual polarization’ horizontal and vertical radar pulses, from which the artificial color composite was generated (image credit: Copernicus data, ESA)

Legend to Figure 95: The flat country has over 1500 islands and 1400 lakes, while forests cover about 40% of the land area. The largest island, Saaremaa, can be seen on the very left side of the image. Although not visible in this image, the island is the site of a group of meteorite craters that, at the time of impact an estimated 4000–7000 years ago, burned forests within a 6 km radius.

The capital and largest city, Tallinn, can be seen by its white radar reflections along the coast near the top of the image. About a third of Estonia’s population lives here. East of Tallinn is the Lahemaa National Park. Covering over 470 km2 of land and 250 km2 of the sea, it is the country’s largest national park. It includes forests, limestone plateaus, waterfalls, raised bogs, peninsulas and bays along the coastal plain and offshore islands. Wildlife includes lynx, bear and wolves.

Lake Peipus – the country’s largest with a total surface area over 3550 km2 – straddles the border with Russia to the east. The population of Estonia is about 1,300,000 in a country of 45,227 km2 in size.

On 4 February 2015, Estonia signed the Accession Agreement to the ESA Convention. Later this year, the Government of Estonia will conclude the ratification process and will become the 21st ESA Member State.

• Feb. 2015: Table 5 and Figure 96 provide the current status of the Sentinel-1A mission as well as expected mission steps of Sentinel-1B. 111)

- Sentinel-1B satellite under procurement, launched foreseen in early 2016

- Sentinel-1A RORR (Routine Operation Readiness Review) planned May 2015. This milestone completes the operational qualification with steady operations providing a sustained service with consolidated KPI (Key Performance Indicators).

- Sentinel-1A Operational Qualification phase is on-going in Feb. 2015

- Satellite and ground segment status and performance are nominal, regular operations since January 23, 2015

- First PolInSAR observations were acquired in January 2015

- Data flow opened to all users on 3 October 2014

- Sentinel-1A commissioning phased completed on 23 September 2014 with IOCR (In-Orbit Commissioning Review)

- Nominal orbit reached on 7 August 2014

- Sentinel-1A launched on 3 April 2014 on Soyuz from Kourou

Table 5: Overview of qualification steps of the Sentinel-1 mission as of February 2015
Figure 96: An operational qualification phase leading to the Routine Operations (image credit: ESA)

- The Sentinel-1 data acquisition is performed according to a systematic & pre-defined instrument observation plan (Long Term Plan, LTP) built according to the identified user needs.

- During the operational qualification phase, the observation scenario is gradually increased, in overall sensing time/coverage/modes/timeliness, to reach the full capacity by the Routine Operations Phase.

• The image of Figure 97 was released on Feb. 6, 2015 in ESA's 'Earth observation image of the week' program. 112)

Figure 97: Sentinel-1A SAR image of the metropolitan area of Portugal's capital, Lisbon, acquired on Oct. 8, 2014 (image credit: ESA)

Legend to Figure 97: Flowing in from the upper-right corner is the Tagus River. Originating in central Spain, the Tagus is the longest river on the Iberian Peninsula, stretching over 1000 km. The river flows southwest through Portugal, emptying into the Atlantic Ocean at Lisbon. Its estuary – visible at the center of the image – is a natural reserve and Ramsar Wetland of international importance.

With extensive mudflats, saltmarshes, reedbeds and human-made salt pans, the area is important for around 16 species of wintering or staging waterbirds, numerous species of breeding birds, and the European otter. Activities outside of the reserve include fishing, shellfish collecting and agriculture, as we can see by the geometric shapes of agricultural plots.

Lisbon’s city center sits on the northern shore of the Tagus River, and is visible by the bright radar reflections from buildings and other structures. One can also see the reflections from the suspension bridge that connects Lisbon to Almada on the southern shore. - Further east, though not as clear, is the Vasco da Gama Bridge, the longest in Europe, at 17.2 km.

• January 23, 2015: A research team led by scientists from CPOM (Center for Polar Observation and Modelling) at the University of Leeds in the UK combined observations from eight satellite missions, including Sentinel-1A and CryoSat, with results from regional climate models. These results of the study provide a clear example of just how quickly ice caps can evolve, and highlight the challenges associated with making projections of their future contribution to sea level. 113) 114)

The Austfonna ice cap is located in the northeastern part of the Svalbard archipelago of Norway. Containing approximately 2500 km3 of ice, it is drained by both land- and marine-terminating glacier systems. About 28% of the ice cap bed lies below sea level and over 200 km of its southern and eastern margin terminates in the ocean with parts resting on a retrograde slope. Since 2012, parts of the Austfonna ice cap have thinned by more than 50 m, about a sixth of the ice’s thickness.

Figure 98: Austfonna ice loss (image credit: CPOM/GRL)

Legend to Figure 98: The main figure (top) shows the rate of ice cap elevation change between 2010 and 2014 observed by CryoSat, overlaid on an image acquired by Sentinel-1A (in 2014). Red indicates that the ice surface is lowering. In the southeast region (green box) ice thinning far exceeds the color scale of 2 m per year. — A closer look at the southeast region is shown in the four smaller figures at the bottom. These figures show the evolution of ice velocity over the last two decades. Ice velocity in 2014 was mapped using Sentinel-1A and the DLR's (German Aerospace Center’s) TerraSAR-X mission.

• Dec. 11, 2014: Five Sentinel-1A radar scans acquired between 3 October and 2 December 2014 were combined to create this interferogram of ground deformation in Mexico City (Figure 99). The deformation is caused by ground water extraction, with some areas of the city subsiding at up to 2.5 cm/month (red). 115)

These preliminary results were presented at the InSARap Workshop at ESA/ ESRIN, Frascati, Italy, for Earth observation, December 10-11, 2014 (Workshop on Sentinel-1 TOPS interferometry). InSARap is a project under ESA’s SEOM (Scientific Exploitation of Operational Missions) program.

Figure 99: Radar images from the Sentinel-1A satellite show ground movement in Mexico City, with some areas sinking up to 2.5 cm/month (image credit: Copernicus data (2014)/ESA/DLR Microwave and Radar Institute–SEOM InSARap study)

• Dec. 05. 2014: Figure 100 is a radar image of Romania – with the political borders in red – is a mosaic of 15 scans by Sentinel-1A’s radar acquired in October and November. The Carpathian mountain range, 1500 km in length, sweeps down in a wide crescent-shaped arc from the north and across the center of the country. The highest portion within the Carpathians is the Tatra range, on the border of Slovakia and Poland, where the highest peaks exceed 2,600 m. The country of Romania covers an area of 238,391 km2. 116)

- Romania is home to the largest area of virgin forests in Europe, totaling 250,000 hectares, most of them in the Carpathians. These forests are home to brown bears, wolves and other animals, and many thermal and mineral springs can be found in the foothills.

- The longest river in Europe – the Danube – flows along part of western Romania’s border with Serbia, as well as its southern border with Bulgaria. The river then flows northward and empties into the Black Sea via the Danube Delta, which lies within Romania and Ukraine – visible on the right side of the image. Designated a UNESCO World Natural Heritage Site in 1991, the Danube Delta is a labyrinth of river channels, lakes, bays, floodplains, marsh and reed beds. This vast triangular delta is home to an extremely rich variety of birds, fish, animals and plants.

- Romania’s capital, Bucharest, is visible in the southern part of the country, as a cluster of bright radar reflections expanding outward from the center.

Figure 100: Sentinel-1A radar image of Romania. The scans were acquired in ‘dual polarization’ horizontal and vertical radar pulses, from which the artificial color composite was generated [image credit: Copernicus data/ESA (2014)]

• Dec. 02.2014: The Pico do Fogo volcano on Cape Verde’s Fogo island erupted on 23 November 2014 and showed continuing volcanic activity in the days following. By processing two Sentinel-1A radar images, which were acquired on 3 November and 27 November 2014, this interferogram was generated. Deformation on the ground causes phase changes in radar signals that appear as the rainbow-colored patterns. 117)

- Results like these are being used by Earth scientists to help them map the volcano’s subsurface magmatic system, perform geophysical modelling of the volcanic eruption mechanics, and assist the relief efforts on the ground. With this stunning result, the great potential of Sentinel-1 for geophysical applications has been once again unequivocally demonstrated.

Figure 101: Interferogram (combination of 2 radar images) of Cape Verde's Fogo eruption, acquired by Sentinel-1A before and during the eruption (image credit: Copernicus data (2014)/ESA/Norut-PPO.labs–COMET-SEOM InSARap study)

Legend to Figure 101: The Cape Verde island of Fogo (Portuguese for “fire”) is located in the Atlantic Ocean (14.93°N, 24.38°W) off the West Coast of Africa. The island has a size of 476 km2 with Pico de Fogo at 2829 m in elevation. — Deformation on the ground causes changes in radar signals that appear as the rainbow-colored patterns. Scientists can use the deformation patterns to understand the subsurface pathways of molten rock moving towards the surface. In this case, the radar shows that the magma travelled along a crack at least 1 km wide. By acquiring regular images from Sentinel-1A, the project is in a position to monitor magma movement in the subsurface, even before eruptions take place, and use the data to provide warnings.

• Nov. 28. 2014: Marking a first in space, Sentinel-1A and Alphasat have linked up by laser stretching almost 36 000 km across space to deliver images of Earth just moments after they were captured (LEO-GEO communication). This important step demonstrates the potential of Europe’s new space data highway to relay large volumes of data very quickly so that information from Earth-observing missions can be even more readily available. 118) 119) 120) 121)

Creating a link between the two orbital kinds of satellites (LEO and GEO) means that more information can be streamed to Earth, and almost continuously. Engineers have turned to laser to accomplish this. — Funded by ESA and the DLR (German Aerospace Center), Tesat has developed a laser communications terminal and downlink system that is carried on the geostationary Alphasat, Europe’s largest telecommunications satellite. This novel unit’s counterpart is flying on Sentinel-1A.

Over the past few weeks the Sentinel-1A operation teams at ESA/ESOC in Darmstadt, Germany, and ESA/ESRIN in Frascati, Italy, and GSOC (German Space Operations Center, in Oberpfaffenhofen, Germany, have been working intensively to prepare for the first laser link tests.

Note: The Alphasat I/Inmarsat 1-XL/Inmarsat-4A F4 spacecraft (6650 kg) was launched on July 25, 2013 into GEO and is positioned at 24.9º East. It carries an LCT (Laser Communication Terminal -TDP1), developed by Tesat Spacecom (Germany) and Ruag Space (Switzerland) with funding from DLR and the Swiss Space Office, and coordinated by ESA. This TDP (Technology Demonstration Payload) is a data relay mission to link observation data from LEO observation satellites towards a ground station through the geostationary Alphasat. The LCT link is operated at 1.8 Gbit/s (bidirectional data link), with a design that could scale up to 7.2 Gbit/s in the future.

Figure 102: Image of Berlin from Sentinel-1A via laser transmission, acquired on Nov. 28, 2014 (image credit: ESA)

Legend to Figure 102: The image of Berlin, Germany, captured by Sentinel-1A is one of the first images delivered via the precursor EDRS (European Data Relay System) carried as a hosted payload on Alphasat, which is in geostationary orbit 36 000 km above Earth. The image is a result of the two satellites using their optical communications instruments to transfer data via laser for fast delivery. Alphasat’s ‘technology demonstration payload’ shows how the EDRS space data highway will make large volumes of data from satellites in LEO available almost instantly. Sentinel-1A transmits data to Earth routinely when passing over ground stations in Norway, Italy and Spain. 122)

- Complementing the Sentinel ground-station network, EDRS connects with the satellite and collects data via laser and then transmits the data in near-realtime to the ground – essential for applications such as maritime safety and for helping respond to disasters such as floods.

- The first EDRS element will be carried on the Eutelsat-9B satellite, which will be launched in 2015. In the meantime, Sentinel-1A will be able to connect through the laser communications terminal on Alphasat. Sentinel-2A, scheduled to be launched in the spring of 2015, also carries the same optical communications payload.

• Nov. 21, 2014: ESA released the image of Figure 103 on Nov. 21, 2014. Greater Tokyo is home to nearly 38 million people, making it the world’s largest ‘megacity’ (a metropolitan area with more than 10 million people). Today, there are over 30 megacities across the globe. Urban areas are home to over half of the world’s population, and are rapidly changing environments. As more people move from rural areas to cities, this growth needs to be monitored to help it proceed on a sustainable basis. 123)

Figure 103: Sentinel-1A SAR image of Tokyo Bay, Japan, acquired on July 11, 2014 (image credit: ESA)

Legend to Figure 103: Tokyo’s center lies mainly south of the Arakawa River. Other visible rivers on this image are the Edo River to its north and the Tama River just to its south, with all three streaming into Tokyo Bay. At the mouth of the Tama River we can see the runways of Haneda Airport. Note the difference between the area northwest of Tokyo Bay – where bright radar reflections show dense construction – and its southeastern opposite. This area with an overall brownish color is the site of the Minami-Bōsō Quasi-National Park.

• Nov. 10, 2014: With Sentinel-1A, the first Copernicus satellite, now operational, ESA and the DLR German Aerospace Center have signed an arrangement on managing and accessing Sentinel data. The data provided by the Earth-observing missions are freely accessible for Copernicus Services, as well as to scientific and other users. 124)

- At an event held last week at the ESA Headquarters in Paris, France, ESA and Germany signed an Understanding for the Sentinel Collaborative Ground Segment Cooperation, which aims to facilitate Sentinel data exploitation in the country. Under the agreement, DLR will coordinate ground segment activities in Germany – such as hosting, distributing, ensuring access and archiving Sentinel data – and act as an interface between ESA and national initiatives. DLR also plans to cooperate with different European partners and institutions.

- As coordinator of the Copernicus ‘space component’, ESA supports national initiatives by establishing direct and efficient access to Sentinel data, providing technical advice on the setting up of data acquisition and dissemination, as well as making data processing and archiving software available to national initiatives.

On 28 October 2014, the European Commission and ESA signed an Agreement of over €3 billion to manage and implement the Copernicus ‘space component’ between 2014 and 2021. The signature also marks the transfer of ownership of Sentinel-1A to the EU, just weeks after the satellite became operational following intense data quality testing and calibration during its commissioning phase. 125)

• October 22, 2014: Within the first days of its operational life, the Sentinel-1A satellite has provided data for marine services in the Arctic. During the first week of the satellite’s operational data supply, experts from the Technical University of Denmark and the Danish Meteorological Institute working under the Horizon 2020 “MyOcean Follow-On project” used the data to alert vessels on marine ice conditions. 126)

- The series of MyOcean projects is the pre-operational precursor of the Copernicus Marine Environment Monitoring Service, to be implemented by the European Commission. Its primary objective is to provide forecasts of the global marine environment and the near-realtime observation data necessary for forecast models.

- Since Sentinel-1A data started to become free and accessible earlier this month with the satellite entering into its operational phase, the DMI (Danish Meteorological Institute) began to use the information to improve observations of the polar regions and forecast maritime conditions. The data are being used to produce ice charts, showing the details of ice conditions in a variety of regions, including the warnings of icebergs drifting in shipping routes.

Figure 104: October 8, 2014 ice chart of Greenland (image credit: DMI)

Legend to Figure 104: Sentinel-1 is the primary source of data for ice charts produced for the Copernicus marine core service MyOcean and PolarView by the Danish Meteorological Institute. This image is an example of an ice chart from 8 October 2014, with red depicting sea ice cover.

Figure 105: Monitoring icebergs with Sentinel-1A (image credit: ESA) 127)

Legend to Figure 105: The capability of Sentinel-1A to detect icebergs during all weather conditions is improving maritime safety. The satellite’s radar gathers information in either horizontal or vertical radar pulses, and colors can be assigned to the different types. In this image acquired near Greenland’s Jakobshavn Glacier on 26 April 2014, sea ice appearing blue-green can be distinguished from icebergs in pink.

• October 6, 2014: ESA announced the end of Sentinel-1A commissioning period. This marks the beginning of the satellite’s operational life, delivering radar coverage for an array of applications in the areas of oceans, ice, changing land and emergency response. The operation of the Sentinel-1A spacecraft was formally handed over to the mission management team. The satellite will now begin delivering radar scans for an array of operational services and scientific research. 128)

- In the last few months, during the commissioning phase, Sentinel-1A has been performing exceptionally well, demonstrating its outstanding capabilities and receiving very positive feedback from the user community.

• Sept. 02, 2014: The biggest earthquake in 25 years struck California’s Napa Valley in the early hours of 24 August 2014. By processing two Sentinel-1A images, which were acquired on 7 August and 31 August 2014 over this wine-producing region, an interferogram was generated. The two round shapes around Napa valley, which are visible in the central part of the image show how the ground moved during the quake. Deformation on the ground causes phase changes in radar signals that appear as the rainbow-colored patterns. Each color cycle corresponds to a deformation of 28 mm deformation. The maximum deformation is more than 10 cm, and an area of about 30 x 30 km was affected significantly. The image also clearly maps the infamous San Andreas Fault running along the coastline. 129)

Interferograms like these (Figures 106 and 107) are being used by scientists on the ground to help them map the surface rupture and model the earthquake. This interferogram very clearly shows the fault that caused the earthquake, which had not been identified as being particularly hazardous prior to the event.

Despite this interferogram being computed with images acquired in the satellite’s ‘stripmap mode’, which is not going to be the default mode when operational, this result demonstrates the capability of Sentinel-1A and marks the beginning of a new era for our ability to map earthquakes from space.

Scientists collaborating through the UK Natural Environment Research Council’s Centre for the Observation and Modelling of Earthquakes, Volcanoes and Tectonics (COMET), used Sentinel-1A’s special capabilities to analyze the quake. Yngvar Larsen from Norway’s Northern Research Institute and Petar Marinkovic from PPO.labs in the Netherlands processed this new interferogram from two images: one that Sentinel-1A acquired on 7 August, the day the satellite reached its operational orbit, and another captured on 31 August.

It clearly confirms that part of the West Napa Fault system was responsible for the 6.0 earthquake that rocked California’s wine-producing region. However, the fault had not been identified as being particularly hazardous prior to the quake that hit on 24 August.

Importantly, the extent of the ground deformation in the interferogram shows that the fault slip continues further north than the extent of the rupture mapped at the surface.

Figure 106: Sentinel-1A interferogram of the California coast and the Napa Valley released on Sept. 2, 2014 (image credit: ESA/PPO.labs/Norut/COMET-SEOM Insarap study)
Figure 107: Sentinel-1A interferogram of the Napa Valley released on Sept. 2, 2014 (image credit: ESA/PPO.labs/Norut/COMET-SEOM Insarap study)

• Aug. 26, 2014: Although it was only launched a few months ago and is still being commissioned, the new Sentinel-1A radar satellite has already shown that it can be used to generate 3D models of Earth’s surface and will be able to closely monitor land and ice surface deformation.

- The satellite reached its operational orbit on August 7, 2014 and just 12 days later, its radar images were used to generate ‘interferograms’ that map the topography of parts of Italy and Norway. 130)

Figure 108: Sentinel-1A IWS image of the Gulf of Genua, Italy acquired in August 2014 (image credit: ESA/DLR Remote Sensing Technology Institute)

Legend to Figure 108: Produced on 19 August 2014, this is one of the first 'interferograms' generated using radar images from Sentinel-1A. The interferogram combines images acquired on 7 and 19 August in IWS (Interferometric Wide Swath) mode. It covers an area of 250 km x 340 km with two seamless radar acquisitions and shows Italy’s Gulf of Genoa towards the top, the Po River Valley in the top right, the island of Elba lower center and the tip of France’s island of Corsica in the lower left corner. Although Sentinel-1A is still being commissioned, this new result demonstrates how useful it will be to map the shape of the land and monitor ground movement. Synthetic aperture radar interferometry – or InSAR – is a technique where two or more satellite radar images acquired over the same area are combined to map surface topography and detect surface change.

TOPS (Terrain Observation by Progressive Scans) is the new acquisition mode that Sentinel-1 employs to continuously scan Earth in 250 km swathes with a resolution of 5 m perpendicular to and 20 m along the flight direction. In the future, this technology will allow the two Sentinel-1 satellites (Sentinel-1A and 1B) to regularly image Earth's entire landmass with an unprecedentedly short revisit interval. A great advantage of this type of sensor is that it can systematically image Earth unhindered by cloud cover – both during day and night. The phase and polarization information present in the images will be used for a wide range of applications such as producing up-to-date topographic maps, observing vegetation or measuring the movement of geologically active regions from space with millimeter precision. 131)

Figure 109: Sentinel-1A IWS image of the northern coast of Norway (image credit: ESA/Norut–SEOM Insarap study)

Legend to Figure 109: This interferogram of the northern coast of Norway combines two radar images acquired by Sentinel-1A on August 11 and 23, 2014. This new result demonstrates how useful it will be to map the shape of the land and monitor ground movement.

• In August 2014, the LEO LCT (Laser Communication Terminal) on Sentinel 1A was switched on in orbit and performed successfully all self-tests. The LCT is now ready for the next step, which is the in orbit commissioning. 132)

• Figure 110 of the Sentinel-1A satellite was released on July 11, 2014 in ESA's Earth from Space video program. Guanabara Bay is an oceanic bay located in Southeast Brazil in the state of Rio de Janeiro. On its western shore lies the city of Rio de Janeiro and Duque de Caxias, and on its eastern shore the cities of Niterói and São Gonçalo. Four other municipalities surround the bay's shores. Guanabara Bay covers an area of 412 km2. 133)

Figure 110: C-SAR dual-polarization image of Rio de Janeiro, Brazil, with its Guanabara Bay, acquired on May 13, 2014 (image credit: ESA)

Legend to Figure 110: Rio is connected to the city of Niterói on the east side of the bay by a large bridge which appears as a dotted straight line. To the north, we can see radar reflections from large ships. Governador is the largest island in Guanabara Bay, and the site of Rio de Janeiro’s main airport. The runways appear as dark lines. The image was acquired in dual polarization and colors were assigned to the different features of the scene for better distinction.

Part of Rio de Janeiro was designated a UNESCO World Heritage Site in 2012 under the category of ‘cultural landscapes’. The Tijuca National Park – the mountainous area in the lower-left – is a hand-planted rainforest covering more than 30 km2. The iconic statue of Christ the Redeemer stands at the eastern end of the forest, overlooking the city from the peak of the 700 m high Corcovado mountain.

At the bottom-center part of the image, the curved coast of the famous Copacabana is visible, while Sugarloaf mountain sits at the mouth of the bay.

• Figure 111 was released on July 4, 2014 in ESA's Earth from Space video program showing the Philippine island of Luzon with Mount Pinatubo. This active volcano experienced a major eruption on 15 June 1991 that injected more particulate matter into the atmosphere than any eruption since Krakatoa in 1883. In the months following, aerosols formed a layer of sulphuric acid haze around the globe, ozone depletion increased and global temperatures dropped by about 0.5ºC. 134)

In the upper-central part of the image, the dark area is Lake Pinatubo, which formed in the summit crater after the 1991 eruption. The water level has been rapidly increasing since its formation, putting pressure on the crater walls, which threaten to collapse and cause flash floods. The Philippine government has taken measures to alleviate the pressure with controlled draining.

South of Lake Pinatubo near the center of the image is Mapanuepe Lake, which also formed as a result of the 1991 eruption. When mud mixed with water and volcanic rock fragments flowed down from Pinatubo, it blocked the drainage of the river. The valley – including the settlements – was inundated. These mud and volcanic debris flows are still visible reaching west towards the South China Sea.

Other features visible in this image include the bright radar reflections from a shipyard on the Subic Bay to the south, and the vast expanse of aquaculture on the edge of Manila Bay in the lower-right corner.

Sentinel-1A is still in the commissioning phase as of early July.

Figure 111: This image from the Sentinel-1A radar satellite, acquired on 6 June, 2014, shows part of the Philippine island of Luzon with Mount Pinatubo (image credit: ESA)

• May 28, 2014: Although not yet operational, the new Sentinel-1A satellite has provided radar data for mapping the floods in Bosnia and Herzegovina. Heavy rainfall leading to widespread flooding and landslides has hit large parts of the Balkans, killing dozens of people and leaving hundreds of thousands displaced. 135)

Figure 112: Flood delineation map over the village of Balatun in northeastern Bosnia and Herzegovina based on Sentinel-1A data. Serbia lies to the north of the Sava river (image credit: ESA)

Legend to Figure 112: Although the radar on Sentinel-1A is still being calibrated, the new information could be integrated into the Copernicus EMS (Emergency Management Service) flood maps of the Sava river in the Balatun area in Bosnia and Herzegovina.

• May 2014: The radar image of Figure 113 (Lake Constance) was released by ESA on May 30, 2014 in the Earth from Space video program. 136)

Figure 113: Sentinel-1A image of Lake Constance acquired on May 10, 2014 in ‘interferometric wide swath mode’ and in dual polarization (image credit: ESA)

Legend to Figure 113: Lake Constance in Central Europe was formed by the Rhine Glacier during the last Ice Age, it covers an area of about 540 km2 and is an important source of drinking water for southwestern Germany. The lake has shorelines in three countries: Germany to the north, Switzerland to the south and Austria at its eastern end. Over the water body, however, there are no borders because there is no legally binding agreement on where they lie.

In the lower-right, one can see where the Rhine river flows into the lake from the south, which then flows out of the lake to the west (left). This and other rivers carry sediments from the Alps, extending the coastline and decreasing the lake’s water depth.

The C-SAR radar instrument of Sentinel-1A gathers information in either horizontal or vertical radar pulses, and colors were assigned to the different types. In this image, buildings generally appear pink, while vegetation is green. Areas with lowest reflectivity in all polarizations appear very dark, like the water.

• Sentinel-1A radar acquisition from 22 April 2014 showing Greece’s Attica region (Figure 114), with mountainous areas and the capital and largest city of Athens near the center. In the water, different shades of blue indicate different types of sea surface, influenced by currents and waves. The image was acquired in ‘interferometric wide swath’ mode and with a dual polarization in VV and VH. Colors were assigned to different types of radar polarizations. 137)

The Figures 114 and 115 were released by ESA among other images on the occasion of the European conference in Athens, Greece: ‘Copernicus Sentinels Serving Society and the Environment’ of May 12-13, 2014. 138)

Figure 114: Sentinel-1A radar image of Athens and mainland Greece (image credit: ESA)
Figure 115: Sentinel-1A radar scan acquired on 22 April 2014 over the Greek Cyclades (Kyklades) island group, located to the southeast of mainland Greece in the Aegean Sea; the image was released on May 12, 2014 (image credit: ESA) 139)

• The sample image of Figure 116, featured on ESA's “Earth from Space video program” and released on May 9, 2014, is an early image of the Sentinel-1A mission acquired less than three weeks after its launch on 3 April. 140)

Figure 116: Radar image of the Salar de Uyuni, Bolivia, acquired by Sentinel-1A on April 20, 2014 (image credit: ESA)

Legend to Figure 116: The Salar de Uyuni in Bolivia is the largest salt flat in the world. With a size of over 10 000 km2, the vast Salar de Uyuni lies at the southern end of the Altiplano, a high plain of inland drainage in the central Andes (elevation of 3,656 m). Some 40 ,000 years ago, this area was part of a giant prehistoric lake that dried out, leaving behind the salt flat.

While the salt flat appears an almost homogenous white in optical satellite imagery, here we see it in shades of grey, and it looks almost like a lake. This has to do with how the radar signal reacts to different surfaces: areas where the radar signal is absorbed appear darker, while areas where the signal is reflected back to the satellite appear lighter. This gives Earth observation experts an indication of how rough or smooth the surfaces are, providing differences in salt density or even the presence of water.

But on the whole, the Salar de Uyuni is very flat, with a surface elevation variation of less than 1 m. This makes the area ideal for calibrating satellite radar altimeters – a different kind of radar instrument that measures the surface topography. The future Sentinel-3 mission will carry a radar altimeter.

The surrounding terrain is rough in comparison to the vast salt flat and is dominated by the volcanoes of the Andes mountains forming part of the Pacific Ring of Fire.

An optical Landsat image of the salt flat is provided in Figure 117 for better distinction between the various features.

Figure 117: A Landsat image of the Salar de Uyuni (image credit: USGS, NASA)

• The image of Figure 118, an early radar scan of Sentinel-1A of the Copernicus program, was released on April 25, 2014; it was featured on the 'Earth from Space video program' of ESA. One of the many application areas of the data will be the surveillance of the marine environment, including monitoring oil spills and detecting ships for maritime security, as well as measuring wave height. 141) 142)

- In this image of the Netherlands and its west coast, one can clearly see the radar reflections from the ships at sea, appearing like stars in a night sky. The two collections of ‘stars’ are reflections from large-scale offshore wind farms, used to generate electricity. Other visible features include the city of Amsterdam on the center-right side of the image, and the runways of the nearby Schiphol airport. In the lower part of the image, one can see the city of Rotterdam, with Europe’s largest port extending to the left.

- The SAR data of Sentinel-1A will also be used for monitoring changes in agricultural land cover – important information for areas with intensive agriculture like the Netherlands.

Figure 118: Sentinel-1A SAR image acquired on April 15, 2014 showing the west coast of the Netherlands (image credit: ESA)

• On April 16, 2014, ESA released initial imagery of the Sentinel-1A mission. The first radar image of Brussels (Figure 119) was acquired in the satellite’s ‘strip map’ mode, which has a swath width of 80 km, and in dual polarization. The image also shows a more detailed view of the city in the ‘zoom in’. Antwerp harbor is also visible in the top left. The green colors correspond to vegetation, red–blue to urban areas, white to high-density urban areas and black to waterways and low-reflective areas such as airport runways. 143)

The satellite is not yet in its operational orbit, nor is it calibrated for supplying true data. These tasks will be carried out during the commissioning phase, which will take about three months to complete. 144)

Figure 119: First Sentinel-1A image of Brussels and surrounds in Belgium, acquired on 12 April 2014 at 17:18 GMT, just nine days after launch (image credit: ESA)
Figure 120: Antarctica Peninsula from Sentinel-1A acquired on April 13, 2014 at 23:57 GMT (image credit: ESA)

Legend to Figure 120: This image shows a transect over the northern part of the Antarctica Peninsula. It was acquired in the satellite’s ‘strip map’ mode with a swath width of 80 km and in dual polarization. The colors indicate how the land, ice and water reflect the radar signal differently.

• April 9, 2014: A collision avoidance maneuver during LEOP. - On April 4, 2014, at the end of the first day after launch — all deployments have been executed during the night and completed early in the morning at the beginning of the first ‘day shift’. As the first day shift nears its end, a serious alert is received: there is a danger of a collision with a NASA satellite called ACRIMSAT, which has run out of fuel and can no longer be maneuvered. The project is waiting for more information - a collision avoidance maneuver may be needed. — A collision avoidance maneuver during LEOP? This has never been done before, this has not been simulated! 145)

- A recount of the Sentinel-1A LEOP phase events is provided in the following paper: 146)

The satellite has not yet reached its ‘normal pointing mode’, a maneuver cannot be done before this is reached. However, there is no alternative. After a brief team consultation Juan, the ‘day shift’ Deputy Flight Operation Director, decides to start preparing the satellite in case a maneuver is needed, and to be executed by his colleagues on the night shift.

The safest hands: The night shift starts at 21:00 hours on 4 April. Hand-over between Juan and Pier-Paolo's teams. More precise information comes in: the risk of collision is significant, there are two possible occurrences, at 09:43 and at 11:21 hour on the following morning. Distance: 20 m! This is serious. No Hollywood fiction, this is Gravity for real!

It is decided to maneuver Sentinel-1A. Its orbit altitude needs to be changed to escape the chaser. Decision taken: this maneuver is the first one of the mission, before the subsystems could be commissioned; the team goes for the lowest risk option.

Luisella, the Sentinel-1A Project Representative at ESOC, insists that the maneuver is executed in the earliest possible pass. The satellite needs to reach nominal pointing mode for the maneuver to be executed. A command ends up triggering the redundant heaters: a trivial error in the command database configuration, a bit of tension. Pier Paolo knows how to let the tension evaporate, “Well, we have even already commissioned the redundant chain and the recovery procedure: they both work fine!”

Patiently, Ian, whom Pier Paolo secretly calls ‘his bodyguard’, takes the satellite into nominal pointing mode. Ian has the safest hands of all.

The maneuver: The team is for the maneuver that takes 39 seconds. The sequence of commands is uplinked during pass 37 in Alaska/Svalbard/Kiruna/ at 04:33 UTC for execution at 05:14 UTC, outside of visibility. The atmosphere is tense and the Main Control Room is filled with suspense. Eyes are looking up at the big screens on the wall, waiting for a sign. As the satellite approaches the Troll ground station on the next pass, and the telemetry starts to scroll down in the twilight of the control room, the team is holding their breath ...... and yes, the satellite is in 'Orbit Control Mode' and the onboard GPS shows a change in the orbit status ... Yes! the maneuver has been successful!

For the first time that night, loud laughs and cheers bursts through the room. We are safe!

The day shift: It’s almost 09:00 and the day shift team arrives. Briefing. A bit of incredulity, someone in the day shift team is heard saying, “These guys, they will never change? They are making it up, can’t be true, come on!”

Finally, the formal hand-over is complete and everybody goes to their position. And then, something unexpected happens: the night shift guys don’t want to leave their positions! A bit of a discussion, then the boss, Pier Paolo, declares a ‘general briefing’ for the night shift team in the adjacent room, where the refreshments are.

Everybody executes the orders. That’s the moment: the ‘day shift’ guys are in place at the consoles. Everyone in the night shift group gets half a cup of the remaining coffee that once, a long time ago, had been warm. And then something really exceptional happens – we are drinking the best ever coffee in our lives; how is this possible?

With an extraordinary night shift in the Sentinel-1 project life over, it is the turn of the day shift team to play with the baby now.

Table 6: A recount of the events for a collision avoidance maneuver during LEOP of Sentinel-1A (posted by the Sentinel-1A team on April 7, 2014, Ref. 145)
Figure 121: Luisella and Pier-Paolo on shift (image credit: ESA)

Ref. 147) version of the collision avoidance maneuver during LEOP (October 2015) : At MET 11:00 h on April 4 after having completed the deployment sequence, LEOP operations aimed at commanding from ground the S/C mode transitions to reach NPM (Normal Pointing Mode), the nominal operating mode during the Mission phase. The most relevant operational steps to reach NPM were the on-board update of the input state vectors used by the on-board coarse orbit propagation, switching on and performing checkouts of the hardware required in NPM, namely the GPS receivers and the STTs (Star Trackers) and enabling the on-board precise orbit determination based on the converged least square solution provided by the GPS receivers. Nominally the transition to NPM was planned to be commanded from Kiruna ground station at MET 31:30 h.

- On April 04 at 14:45 UTC (MET 17:45 h) the Space Debris Office at ESOC communicated to the Mission Control Team the results of the determined injection orbit screening against the NORAD TLEs catalog. A series of high risk conjunctions with the NASA operational satellite ACRIMSAT were detected, the first one on April 05 at 06:04 UTC (MET 33:00 h). These results were confirmed within a few hours by the JSpOC (Joint Space Operations Center) of the US Air Force, located at VAFB, CA. Table 7 summarizes the screening results provided by JSpOC.

EPOCH (UTC)

D-Radial (km)

D-Along track (km)

D-Cross track (km)

D (km)

2014/04/05 04:25:53

0.129

0.286

1.912

1.937

2014/04/05 06:04:28

0.077

0.150

1.001

1.015

2014/04/05 07:43:04

0.023

0.042

0.283

0.287

2014/04/05 09:21:39

0.034

-0.059

-0.393

0.399

2014/04/05 11:00:14

0.123

-0.177

-1.187

1.207

Table 7: Summary of the Sentinel-1A conjunction risks with ACRIMSAT confirmed by JSpOC. ACRIMSAT 1-sigma uncertainty: radial 10m, along-track 50m and cross-track 10 m. D is the relative position vector of ACRIMSAT with respect to Sentinel-1A.

- At MET 19:00 h on April 4, after getting confirmation from the ACRIMSAT operators that no maneuvering was possible on their side, the ESOC Flight Control Team started working on a new operations timeline which would allow Sentinel-1A to reach NPM and perform a maneuver to mitigate the conjunction risk half a revolution before the first predicted potential conjunction at the latest. In parallel the FD Team and the ESOC Space Debris Office started preparing possible evasion maneuver scenarios. The analysis performed by the ESOC Space Debris Office was showing a series of head-on conjunctions at the same orbit location, namely at 20.082 deg argument of latitude with ACRIMSAT flying above Sentinel-1A in all close approaches. The ACRIMSAT orbit uncertainty in radial component provided by JSpOC was 10 m. With this uncertainty and looking at the fly-by radial distances reported in Table 7, it was clear that the potential conjunctions predicted for 2014/04/05-07:43:04 UTC and 2014/04/05-09:21:39 UTC (Table 7) were posing a real danger to the Sentinel-1A mission.

- Mitigating the risk for these two predicted conjunctions was the target of the collision avoidance maneuver. This risk mitigation had to be achieved by increasing the radial separation at the point of closest approach. The optimal way to achieve this radial separation was to preform an in-plane maneuver 180º away from the argument of latitude of the predicted closest approach. In this case an in-plane maneuver had to be executed at an argument of latitude of 200.082º and before 2014/04/05 07:43:04 UTC (MET 34:46 h), as depicted in Figure 122. The change in radial component introduced by an in-plane maneuver at the Sentinel-1A altitude can be expressed as:

delta-radial (m) = 2 x delta-semi-major axis (m) = 2 x 1885 sec x delta-v (m/s)

- The Sentinel-1A orbit control thrusters are located on the S/C sides +X, -X and –Y. When flying in NPM these directions are aligned with the flight direction, anti-flight direction and orbit normal direction, respectively. The maximum burn duration specified before launch was 300 seconds due to AOCS constraints. However the S/C manufacturer team present at ESOC during LEOP recommended a maximum avoidance maneuver duration of 100 seconds, since it was the first maneuver performed in-flight. A 100 seconds duration at the tank conditions in LEOP translated into a total delta-v of 0.048 m/s, which according to the expression provided above would increase the radial separation by 180 m. This change in radial component was enough to mitigate the risk when performing the maneuver in either direction, in or against the flight direction. Since the launcher injection had been 7.8 km lower than expected, a maneuver in the flight direction would have contributed to the operational altitude acquisition. On the other hand, it was operationally safer to perform the maneuver against the flight direction, given the fact that ACRIMSAT was flying above Sentinel-1A in the two close approaches. In case of a S/C reconfiguration during the maneuver execution, a maneuver in the flight direction could have brought Sentinel-1A closer to ACRIMSAT.

- The Mission Control Team joint decision was therefore to perform the collision avoidance maneuver against the flight direction, activating the thrusters located on the +X S/C face. Three maneuver cases were prepared by the FD Orbit Control Team corresponding to maneuver durations of 30, 60 and 100 seconds which translated into radial separation increase of 54, 108 and 180 m, respectively. The three cases were provided to the ESOC Space Debris Office, which determined that a 40 second burn was sufficient to bring the collision risk probability down to an acceptable level, accounting for some maneuver performance error. Similarly three different maneuver execution times were considered: the latest opportunity to perform the maneuver at 06:53:00 UTC (MET 33:55 h), which corresponds to half an orbital revolution before the first close approach, and two more opportunities one and two revolutions earlier at 05:13 UTC (MET 32:15 h) and 03:33 UTC (MET 30:35 h), respectively.

- The first attempt to enter NPM was commanded on April 04 at 20:36 UTC (MET 23:38 h). Following the entry in NPM a Gyro FDIR monitoring triggered a switch to all redundant equipment and the S/C went to Intermediate Safe Mode. A second attempt to enter NPM on April 05 at 03:00 UTC (MET 30:00 h) was successful, allowing the execution of the collision avoidance burn on April 05 at 05:14:45 UTC (MET 32:15 h).

Figure 122: Collision avoidance scenario for a maximum radial separation increase (image credit: ESA)

- Maneuver performance: The first orbit determination attempts after the execution of the burn showed a large performance error in the along-track component in the order of -20%. This figure was confirmed after collecting sufficient ranging, Doppler and GPS measurements in the hours that followed the maneuver. After retrieving a complete day of almost continuous GPS data a maneuver performance analysis was conducted, aiming at ruling out the possibility of thruster misalignment issues. Two orbit determinations were performed over a determination arc covering from 2014/04/04-05:00 UTC (one day before the maneuver execution) to 2014/04/06-06:00 UTC (one day after the maneuver execution) with different maneuver parameter estimation setups.

- Fortunately, the Sentinel-1A spacecraft avoided a collision with ACRIMSAT - truly, a great relieve for all involved. Naturally, further analyses were conducted by the Flight Dynamics Team to explain the discrepancies in the predicted and achieved performances.

- The Sentinel-1 orbit control S/W was consequently adapted to the new propulsion system features, namely the reduction of burn duration for in-plane orbit correction maneuvers from 300 to 30 seconds. With this maximum in-plane burn duration (providing a delta-v of 0.009 m/s at the end of LEOP tank conditions) and the injection semi-major axis achieved by the launcher, it was clear the reference ground-track acquisition campaign had to be re-engineered based on the execution of in-plane correction batches.

- On April 23, 2014, a maneuver batch approach proof of concept was conducted, performing a sequence of six in-plane corrections in consecutive orbit revolutions. The AOCS response was satisfactory in terms of platform pointing and wheels recovery time. This marked the beginning of a long reference ground-track acquisition campaign which was successfully completed by August 06, 2014. On this day and after the execution of more than four hundred maneuvers, Sentinel-1A started the first control cycle around its reference ground-track. 147) 148)


• April 4, 2014: Following the launch, Sentinel-1A has performed a carefully a choreographed 10-hour dance routine to open its large radar antenna and solar wings. During the launch, the 12 m long radar and two 10 m long solar wings were folded up to fit into the protective Soyuz rocket fairing. After being lofted to 693 km above Earth and released into orbit, the satellite gently ‘tumbled’ to stabilize before embarking on its elaborate dance routine. 149)

- The solar wings and radar opened together in a specific sequence that took around 10 hours to complete. As one of most critical stages in the life of the mission, it was choreographed to ensure that both deploy in the safest possible way. The sequence also allowed power from the wings to be available as soon as possible so that the satellite was independent.

• April 3/4, 2014: Once the AOCS achieved SHM (Safe Hold Mode), the deployment of the two Solar Arrays and the two SAR wings began at the fourth ground pass over Troll (MET 02:52 h). A primary target of the sequence was to achieve a S/C Power Positive state, which is the state when the power budget can guarantee a permanent survival and the remaining deployments can go ahead with no risk related to the S/C power consumption (Ref. 147).

- The two appendages are aligned along thespacecraft X-axis when extended. Each SAR wing deployed in two steps called partial and full deployment. As it can be observed in Figure 123 steps 1 and 2, it was important to perform the partial deployment of each SAR wing before deploying the Solar Arrays in order to avoid possible interference during the deployment and rotation of the Solar Array.

Figure 123: Sentinel-1A SAR and Solar Array deployment sequence (image credit: ESA, Ref. 147)

- The first step in the sequence was the SAR +X wing release by means of a pyrotechnic actuator. This event was noticeable in TM as a small oscillation in the S/C rates. The partial deployment was not commanded until the following ground pass over Svalbard-Alaska at MET 03:36 h ( Figure 123 step 1). The deployment was successfully completed by the time the S/C entered visibility from Troll at MET 04:28 h. During this pass the SAR –X wing release (not partial deployment yet) was commanded. The +Y Solar Array deployment was telecommanded at the next contact with the S/C from Kiruna-Svalbard-Alaska at MET 05:13 h (Figure 123 step 2). The 210 º +Y Array rotation required to get Sun incidence which was nominally planned for this pass, but was actually commanded and monitored at the next ground pass over Troll at MET 06:04 h, at which point Power Positive Status was achieved (Figure 123 step 3). The deployment of the +Y Solar Array was noticeable in the monitored S/C rates, which experience disturbances of up to 0.5º/s in roll and 2º/s in yaw (Figure 124).

Figure 124: Gyro rates during the deployment of the Solar Arrays (shaded regions). +Y Solar Array (left) and –Y Solar Array (right), image credit: ESA

• Cameras on the Soyuz Fregat upper stage, that released the Sentinel-1A spacecraft into orbit on April 3, acquired superb footage showing the Sentinel-1A satellite separating from the Fregat to start its life in orbit around Earth. The satellite separated from the upper stage 23 min 24 sec after liftoff. The video sequence can be found in the following reference. 150)

- Separation occurred within visibility of KSAT ground station at Svalbard (Figure 125) and three minutes before entering visibility from the SSC/USN antenna in Alaska (Ref. 147). Approximately one minute after physical separation, the on-board automatic sequence started, switching on the S-band transponder and setting the S/C mode to RDM (Rate Damping Mode). The first TM frames were successfully received at the Svalbard station and forwarded to ESOC at 21:27:15 UTC on April 3, 2014 (just 25 minutes after launch).

Figure 125: Sentinel-1A LEOP ground stations network and S/C ground-track evolution during the first 4 hours after separation (image credit: ESA, Ref. 147)


1) ”Mexico City,” ESA Earth observation image of the week, 30 November 2018, URL: http://m.esa.int/spaceinimages/Images/2018/11/Mexico_City

2) ”Oil spill spread,” ESA, 10 October 2018, URL: http://m.esa.int/spaceinimages/Images/2018/10/Oil_spill_spread

3) ”Mediterranean slick,” ESA, 8 October 2018, URL: http://m.esa.int/spaceinimages/Images/2018/10/Mediterranean_slick

4) ”Central Italy,” ESA, Earth observation image of the week, 28 September 2018, URL: http://m.esa.int/spaceinimages/Images/2018/09/Central_Italy

5) ”Northeast Ethiopia,” ESA, Earth observation image of the week, 14 September 2018, URL: http://m.esa.int/spaceinimages/Images/2018/09/Northeast_Ethiopia

6) ”Earth from Space: Northeast Ethiopia,” ESA video program, 14 September 2018, URL: http://m.esa.int/spaceinvideos/Videos/2018/09/Earth_from_Space_Northeast_Ethiopia

7) ”Giant iceberg escapes,” ESA, 13 September 2018, URL: http://m.esa.int/spaceinimages/Images/2018/09/Giant_iceberg_escapes

8) ”NASA's ARIA Project Generates Satellite-Derived Map of Ground Deformation from Earthquake beneath Lombok, Indonesia,” NASA/JPL, 8 August 2018, URL:
https://www.jpl.nasa.gov/spaceimages/details.php?id=PIA22491

9) ”Sentinel-1 maps flash floods in Laos,” ESA, 30 July 2018, URL: http://m.esa.int/Our_Activities/Observing_the_Earth/Copernicus
/Sentinel-1/Sentinel-1_maps_flash_floods_in_Laos

10) ”Dam breach in the Xe-Pian Xe-Namnoy lake area,” ESA, 27.07.2018, URL: http://m.esa.int/spaceinimages/Images/2018/07
/Dam_breach_in_the_Xe-Pian_Xe-Namnoy_lake_area

11) ”It’s all go in summer for Greenland’s glaciers,” ESA, 13 July 2018, URL: http://m.esa.int/Our_Activities/Observing_the_Earth/Copernicus
/Sentinel-1/It_s_all_go_in_summer_for_Greenland_s_glaciers

12) Adriano Lemos, Andrew Shepherd, Malcolm McMillan, Anna E. Hogg, Emma Hatton, Ian Joughin, ”Ice velocity of Jakobshavn Isbræ, Petermann Glacier, Nioghalvfjerdsfjorden, and Zachariæ Isstrøm, 2015–2017, from Sentinel 1-a/b SAR imagery ,” The Cryosphere, Volume 12, Issue 6, 18 June 2018, https://doi.org/10.5194/tc-12-2087-2018, URL: https://www.the-cryosphere.net
/12/2087/2018/tc-12-2087-2018.pdf

13) ”Jakobshavn Isbrae ice flow,” ESA, 13 July 2018, URL: http://m.esa.int/spaceinimages/Images/2018/07/Jakobshavn_Isbrae_ice_flow

14) Dirk Geudtner, Nuno Miranda, Ignacio Navas-Traver, Francisco Vega Ceba, Pau Prats, Nestor Yague-Martinez, Heiko Breit, Francesco de Zan, Yngvar Larsen, Andrea Recchia, David Small, Adrian Schubert, Itziar Barat, ”Sentinel-1A/B SAR and InSAR Performance,” EUSAR 2018 (12th European Conference on Synthetic Aperture Radar), Aachen, Germany, June 4-7, 2018

15) ”Sentinel-1 warns of refugee island flood risk,” ESA, 29 May 2018, URL: https://m.esa.int/Our_Activities/Observing_the_Earth/Copernicus
/Sentinel-1/Sentinel-1_warns_of_refugee_island_flood_risk

16) ”Barely an island,” ESA, 29 May 2018, URL: http://m.esa.int/spaceinimages/Images/2018/05/Barely_an_island

17) ”Mission Status Report 207 - Reference Period: 22 May 2018 – 28 May 2018,” ESA, May 2018, URL: https://sentinel.esa.int/documents/247904/3339966
/Sentinel-1-Mission_Status_Report_207-Period-22-28_May_2018.pdf

18) ”Latest Mission Status Reports,” ESA, May 2018, URL: https://sentinel.esa.int/web/sentinel/missions/sentinel-1/mission-status

19) ”Radar shows large areas of Texas oil acreage heaving and sinking at large rates,” Oil Gas Daily, 22 March, 2018, URL: http://www.oilgasdaily.com/reports/Radar_images_show_large_
swath_of_Texas_oil_patch_is_heaving_and_sinking_at_alarming_rates_999.html

20) Jin-Woo Kim, Zhong Lu, ”Association between localized geohazards in West Texas and human activities, recognized by Sentinel-1A/B satellite radar imagery,” Scientific Reports, Published: online: 16 March 2018, 8:4727, DOI:10.1038/s41598-018-23143-6, URL:
https://www.nature.com/articles/s41598-018-23143-6.pdf

21) ”Bering Strait,” ESA Earth observation image of the week, 23 Feb. 2018, URL: http://m.esa.int/spaceinimages/Images/2018/02/Bering_Strait

22) ”Orange County,” ESA image of the week, Dec. 15, 2017, URL: http://m.esa.int/spaceinimages/Images/2017/12/Orange_County

23) ”Thurston Island, Antarctica,” ESA, Earth observation image of the week, 24 Nov. 2017, URL: http://m.esa.int/spaceinimages/Images/2017/11/Thurston_Island_Antarctica

24) ”Satellites guide ships in icy waters through the cloud,” ESA, 7 Nov. 2017, URL: http://www.esa.int/Our_Activities/Observing_the_Earth
/Satellites_guide_ships_in_icy_waters_through_the_cloud

25) ”Halloween crack,” ESA31 Oct. 2017, URL: http://m.esa.int/spaceinimages/Images/2017/10/Halloween_crack

26) ”Sentinel-1 sees through hurricanes,” ESA, 25 Oct. 2017, URL: http://www.esa.int/Our_Activities/Observing_the_Earth/Copernicus
/Sentinel-1/Sentinel-1_sees_through_hurricanes

27) ”Sagaing Division, Myanmar,” ESA Earth observation image of the week, 20 Oct. 2017, URL: http://m.esa.int/spaceinimages/Images/2017/10/Sagaing_Division_Myanmar

28) ”NASA Damage Map Aids Puerto Rico Hurricane Response,” NASA/JPL, 28 Sept. 2017, URL: https://www.jpl.nasa.gov/news/news.php?release=2017-252

29) https://www.jpl.nasa.gov/spaceimages/details.php?id=pia21964

30) ”Giant berg on the move,” ESA, 20 Sept. 2017, URL: http://m.esa.int/spaceinimages/Images/2017/09/Giant_berg_on_the_move

31) ”Sentinel-1 speeds up crop insurance payout,” ESA, 17 August 2017, URL: http://www.esa.int/Our_Activities/Observing_the_Earth
/Copernicus/Sentinel-1/Sentinel-1_speeds_up_crop_insurance_payouts

32) ”Sentinel satellite captures birth of behemoth iceberg,” ESA, July 12, 2017, URL: http://m.esa.int/Our_Activities/Observing_the_Earth/Copernicus
/Sentinel-1/Sentinel_satellite_captures_birth_of_behemoth_iceberg

33) ”Depth of ice crack,” ESA, 6 July 2017, URL: http://m.esa.int/spaceinimages/Images/2017/06/Depth_of_ice_crack

34) ”Landslide on the radar,” ESA, June 13, 2017, URL: http://m.esa.int/spaceinimages/Images/2017/06/Landslide_on_the_radar

35) ”Negribreen on the move,” ESA, May 12, 2017, URL: http://www.esa.int/Our_Activities/Observing_the_Earth
/Copernicus/Sentinel-1/Negribreen_on_the_move

36) ”Satellites track Antarctic ice loss over decades,” ESA, 2 May 2017, URL: http://m.esa.int/Our_Activities/Observing_the_Earth
/Satellites_track_Antarctic_ice_loss_over_decades

37) Anna E. Hogg, Andrew Shepherd, Stephen L. Cornford, Kate H. Briggs, Noel Gourmelen, Jennifer Graham, Ian Joughin, Jeremie Mouginot, Thomas Nagler, Antony J. Payne, Eric Rignot, Jan Wuite, ”Increased ice flow in Western Palmer Land linked to ocean melting,” Geophysical Research Letters, Vol. 44, 2017, doi:10.1002/2016GL072110, URL of abstract: http://onlinelibrary.wiley.com/doi/10.1002/2016GL072110/abstract

38) http://www.esa.int/Highlights/Week_In_Images_17_21_April_2017

39) ”How the Copernicus Emergency Management Service supported responses to major earthquakes in Central Italy,” ISPRA, April 21, 2017, URL:
http://www.copernicus.eu/news/how-copernicus-emergency-management
-service-supported-responses-major-earthquakes-central-italy

40) ”Sentinel-1 supports detection of illegal oil spills,” Geospatial World, April 7, 2017, URL: https://www.geospatialworld.net/news-posts/sentinel-1-supports-detection-illegal-oil-spills/

41) https://sentinels.copernicus.eu/web/sentinel/news/-/article
/sentinel-1-supports-detection-of-illegal-oil-spills

42) ”Urban monitoring boosted by new data processor,” ESA, April 4, 2017, URL: http://www.esa.int/Our_Activities/Observing_the_Earth
/Urban_monitoring_boosted_by_new_data_processor

43) ”TimeScan product: Germany,” ESA, April 4, 2017, URL: http://www.esa.int/spaceinimages/Images/2017/04/TimeScan_product_Germany

44) ”TimeScan product: Pearl River Delta,” ESA, April 3, 2017, URL: http://www.esa.int/spaceinimages/Images/2017/04/TimeScan_product_Pearl_River_Delta

45) ”Alert, Canada,”, ESA Earth observation image of the week , March 31, 2017, URL: http://m.esa.int/spaceinimages/Images/2017/03/Alert_Canada

46) ”Cryovex and Karen: Catching Up,” ESA, March 28, 2017, URL: http://blogs.esa.int/campaignearth/2017/03/28/cryovex-and-karen-catching-up/

47) ”San Joaquin Valley is Still Sinking,” NASA Earth Observatory, March 5, 2017, URL: http://earthobservatory.nasa.gov/IOTD/view.php?id=89761

48) Tom G. Farr, Cathleen E. Jones, Zhen Liu, ”Progress Report: Subsidence in California, March 2015 – September 2016,” URL: http://www.water.ca.gov/waterconditions/docs/2017
/JPL%20subsidence%20report%20final%20for%20public%20dec%202016.pdf

49) ”Lake Success, California,” ESA, Earth observation image of the week, February 24, 2017, URL: http://m.esa.int/spaceinimages/Images/2017/02/Lake_Success_California

50) ”Sentinels warn of dangerous ice crack,” ESA, Feb. 16, 2017, URL: http://m.esa.int/Our_Activities/Observing_the_Earth/Copernicus
/Sentinels_warn_of_dangerous_ice_crack

51) ”Relocation of Halley Research Station,” BAS Press Release, 6 Dec. 2016, URL: https://www.bas.ac.uk/media-post/relocation-of-halley-research-station/

52) ”Satellites monitor landslide in the Alps,” ESA, Feb. 3, 2017, URL: http://m.esa.int/Our_Activities/Observing_the_Earth/Satellites_monitor_landslide_in_the_Alps

53) ”Larsen Crack,” ESA, Jan. 30, 2017, URL:
http://m.esa.int/spaceinimages/Images/2017/01/Larsen_crack

54) ”Satellites confirm sinking of San Francisco tower,” ESA, Nov. 25, 2016, URL: http://m.esa.int/Our_Activities/Observing_the_Earth
/Copernicus/Sentinel-1/Satellites_confirm_sinking_of_San_Francisco_tower

55) ”Millennium Tower sinking,” ESA, Nov. 24, 2016, URL: http://m.esa.int/spaceinimages/Images/2016/11/Millennium_Tower_sinking

56) ”San Francisco displacement,” ESA, Nov. 24, 2016, URL: http://m.esa.int/spaceinimages/Images/2016/11/San_Francisco_displacement

57) ”Bay Area displacement,” ESA, Nov. 24, 2016, URL: http://m.esa.int/spaceinimages/Images/2016/11/Bay_Area_displacement

58) ”Oslo train station on the move,” ESA, Nov. 24, 2016, URL: http://m.esa.int/spaceinimages/Images/2016/11/Oslo_train_station_on_the_move

59) ”Virunga Mountains,” ESA Earth observation image of the week, Nov. 11, 2016, URL: http://m.esa.int/spaceinimages/Images/2016/11/Virunga_Mountains

60) ”Sentinel satellites reveal east–west shift in Italian quake,” ESA, Nov. 3, 2016, URL: http://m.esa.int/Our_Activities/Observing_the_Earth/Copernicus
/Sentinel-1/Sentinel_satellites_reveal_east_west_shift_in_Italian_quake

61) ”European seismic zones”, ESA, Oct. 28, 2016, URL: http://m.esa.int/spaceinimages/Images/2016/10/European_seismic_zones

62) ”Earthquake area in Italy,” ESA, Oct. 28, 2016, URL: http://m.esa.int/spaceinimages/Images/2016/10/Earthquake_area_in_Italy

63) ”Ground displacement from Italy’s earthquake,” ESA, Aug. 28, 2016, URL: http://m.esa.int/spaceinimages/Images/2016/08/Ground_displacement_from_Italy_s_earthquake

64) ”Copernicus Sentinel-1B handed over for operations,” ESA, Sept. 16, 2016, URL: http://m.esa.int/spaceinimages/Images/2016/09/Copernicus_Sentinel-1B_handed_over_for_operations

65) ”China's Poyang Lake in radar vision,” ESA Earth observation image of the week, Sept. 16, 2016, URL: http://m.esa.int/spaceinimages/Images/2016/09/Poyang_Lake

66) ”Copernicus Sentinel-1A satellite hit by space particle,” ESA, Aug. 31, 2016, URL: http://m.esa.int/Our_Activities/Observing_the_Earth/Copernicus
/Sentinel-1/Copernicus_Sentinel-1A_satellite_hit_by_space_particle

67) ”Sentinel-1 satellites combine radar vision,” ESA, June 22, 2016, URL: http://m.esa.int/Our_Activities/Observing_the_Earth/Copernicus
/Sentinel-1/Sentinel-1_satellites_combine_radar_vision

68) Pierre Potin, Betlem Rosich, Patrick Grimont, Nuno Miranda, Ian Shurmer, Alistair O’Connell, Ramón Torres, Mike Krassenburg, ”Sentinel-1 Mission Status,” Proceedings of EUSAR 2016, 11th European Conference on Synthetic Aperture Radar, Hamburg, Germany, June 6-9, 2016

69) Ramón Torres, Svein Løkås, David Bibby, Dirk Geudtner, ”Sentinel-1B LEOP and Commissioning Results,”Proceedings of EUSAR 2016, 11th European Conference on Synthetic Aperture Radar, Hamburg, Germany, June 6-9, 2016

70) Dirk Geudtner, Pau Prats, Nestor Yague-Martinez, Ignacio Navas-Traver, Itziar Barat, Ramón Torres, ”Sentinel-1 SAR Interferometry Performance Verification,” Proceedings of EUSAR 2016, 11th European Conference on Synthetic Aperture Radar, Hamburg, Germany, June 6-9, 2016

71) ”Sentinel-1 helping Cyclone Roanu Relief,” ESA, May 26, 2016, URL: http://www.esa.int/Our_Activities/Observing_the_Earth/Copernicus
/Sentinel-1/Sentinel-1_helping_Cyclone_Roanu_relief

72) ”Antarctic Peninsula ice flow,” T. Nagler , H. Rott, M. Hetzenecker, J. Wuite, ”Monitoring ice motion of the Antarctic and Greenland ice sheets at high spatial and temporal resolution by means of Sentinel-1 SAR,” Living Planet Symposium, 2016, Prague, Czech Republic, May 9-13, 2016, URL of abstract: http://www.esa.int/spaceinimages/Images/2016/05/Antarctic_Peninsula_ice_flow

73) ”Zachariae glacier,” ESA, image of the week series, May 6, 2016, URL: http://www.esa.int/spaceinimages/Images/2016/05/Zachariae_glacier

74) Alan Buis, ”In Greenland, Another Major Glacier Comes Undone,” NASA/JPL, Nov. 12, 2015, URL: http://www.jpl.nasa.gov/news/news.php?feature=4771

75) ”Sentinel-1B delivers,” ESA, April 28, 2016, URL: http://www.esa.int/Our_Activities
/Observing_the_Earth/Copernicus/Sentinel-1/Sentinel-1B_delivers

76) ”Sentinel-1B spreads its wings,” ESA, April 27, 2016: URL: http://www.esa.int
/Our_Activities/Observing_the_Earth/Sentinel-1B_spreads_its_wings

77) ”Student satellites fly freely on their orbit in space,” ESA, April 26, 2016, URL: http://www.esa.int/Education/CubeSats_-_Fly_Your_Satellite
/Student_satellites_fly_freely_on_their_orbit_in_space

78) ”Soyuz demonstrates Arianespace mission flexibility,” Space Daily, April 26, 2016, URL: http://www.spacedaily.com/reports/Soyuz_demonstrates_Arianespace_mission_flexibility_999.html

79) ”Dasht-e Kavir,” ESA, Earth observation image of the week, April 22, 2016, URL: http://www.esa.int/spaceinimages/Images/2016/04/Dasht-e_Kavir

80) ”Sentinel-1 counts fish,” ESA, April 21, 2016, URL: http://www.esa.int/Our_Activities/Observing_the_Earth/Sentinel-1_counts_fish

81) ”Sentinel-1A detects fishing cages,” ESA, April 14, 2016, URL: http://www.esa.int
/spaceinimages/Images/2016/04/Sentinel-1A_detects_fishing_cages

82) ”Irish mosaic,” ESA, Earth observation image of the week, April 15, 2016: URL: http://www.esa.int/spaceinimages/Images/2016/04/Irish_mosaic

83) ”Nansen gives birth to two icebergs,” ESA, April 14, 2016, URL: http://www.esa.int/Our_Activities/Observing_the_Earth/Copernicus
/Sentinel-1/Nansen_gives_birth_to_two_icebergs

84) ”Bernese Alps,” ESA, image of the week, April 8, 2016, URL: http://saint/spacings/Images/2016/04/Bernese_Alps

85) ”Colors of Sweden,” ESA, Feb. 5, 2016, URL: http://www.esa.int/spaceinimages/Images/2016/02/Colours_of_Sweden

86) ”Deal sealed for new Sentinel-1 satellites,” ESA, Dec. 15, 2015, URL: http://m.esa.int/Our_Activities/Observing_the_Earth/Copernicus
/Sentinel-1/Deal_sealed_for_new_Sentinel-1_satellites

87) ”Dutch mosaic,” ESA, Earth observation image of the week, Dec. 4, 2015, URL: http://www.esa.int/spaceinimages/Images/2015/12/Dutch_mosaic

88) ”Manicouagan Crater, Canada,” ESA, Earth observation image of the week, Oct. 30, 2015, URL: http://www.esa.int/spaceinimages/Images/2015/10/Manicouagan_Crater_Canada

89) ”Azore Islands,” ESA, Earth observation image of the week, Oct. 9, 2015, URL: http://www.esa.int/spaceinimages/Images/2015/10/Azore_islands

90) ”Chile earthquake on the radar,” ESA, Sept. 21, 2015, URL: http://www.esa.int/spaceinimages/Images/2015/09/Chile_earthquake_on_the_radar

91) “Mission Status Report 68 for the period August 11-17, 2015,” EC, ESA, URL: https://sentinel.esa.int/documents/247904/1752934
/Sentinel-1-Mission_Status_Report_68-Period_11-17_August_2015.pdf

92) “Sentinel-1 Observation Scenario,” ESA, 2015, URL: https://sentinels.copernicus.eu/web/sentinel/missions/sentinel-1/observation-scenario

93) Alexis Mouche, Bertrand Chapron, Harald Johnsen, Fabrice Collard, Romain Husson, He Wang, Gilles Guitton, Fabrice Ardhuin, “Sentinel-1 results: Sea state applications,” Proceedings of the IGARSS (International Geoscience and Remote Sensing Symposium) 2015, Milan, Italy, July 26-31, 2015

94) R. Lanari, P. Berardino, M. Bonano, F. Casu, C. De Luca, S. Elefante, A. Fusco, M. Manunta, M. Manzo, C. Ojha, A. Pepe, E. Sansosti, I. Zinno, “Sentinel-1 results: SBAS-DInSAR processing chain developments and land subsidence analysis,” Proceedings of the IGARSS (International Geoscience and Remote Sensing Symposium) 2015, Milan, Italy, July 26-31, 2015

95) “Southern Bavaria,” ESA, Earth observation image of the week, July 24, 2015, URL: http://www.esa.int/spaceinimages/Images/2015/07/Southern_Bavaria

96) “Central California, USA,” ESA, Earth observation image of the week, June 26, 2015, URL: http://www.esa.int/spaceinimages/Images/2015/06/Central_California_USA

97) “Tianjin, China,” ESA Earth observation image of the week, June 5, 2015, URL: http://www.esa.int/spaceinimages/Images/2015/06/Tianjin_China

98) “Update: Disaster relief – DLR provides aerial images of Kathmandu,” DLR/EOC, April 30, 2015, URL: http://www.dlr.de/dlr/en/desktopdefault.aspx/tabid-10081/151_read-13487/#/gallery/19391

99) “Nepal earthquake displacement,” ESA, April 30, 2015, URL: http://www.esa.int/spaceinimages/Images/2015/04/Nepal_earthquake_displacement

100) “Nepal Earthquake on the Radar,” ESA, April 29, 2015, URL: http://www.esa.int/Our_Activities/Observing_the_Earth/Copernicus
/Sentinel-1/Nepal_earthquake_on_the_radar

101) “Kathmandu grading map,” ESA, April 29, 2015, URL:
http://www.esa.int/spaceinimages/Images
/2015/04/Kathmandu_grading_map

102) “Florida, United States of America,” ESA, image release on April 24, 2015, URL: http://www.esa.int/spaceinimages/Images/2015/04/Florida_United_States_of_America

103) “happy birthday, Sentinel-1A,” ESA, April 3, 2015, URL: http://www.esa.int/Our_Activities
/Observing_the_Earth/Copernicus/Sentinel-1/Happy_birthday_Sentinel-1A

104) “Irkutsk and Lake Baikal,” ESA image, featured on the Earth from Space video program, April 3, 2015, URL: http://www.esa.int/spaceinimages/Images/2015/04/Irkutsk_and_Lake_Baikal

105) “Earth shifts in color,” A gallery of InSAR images is presented at the 2015 Fringe Workshop, held at ESA/ESRIN in March 23-27, 2015, ESA, March 27, 2015, URL: http://www.esa.int/Our_Activities
/Observing_the_Earth/Highlights/Earth_shifts_in_colour

106) “Aral Sea,” ESA image in the series 'Earth observation image of the week,' released on March 27, 2015, URL: http://www.esa.int/spaceinimages/Images/2015/03/Aral_Sea

107) “Pine Island Glacier on Sentinel-1A’s radar,” ESA, March 25, 2015, URL: http://www.esa.int/spaceinimages/Images/2015/03/Pine_Island_Glacier_on_Sentinel-1A_s_radar

108) ESA, March 20, 2015, 'Our week in images,' URL: http://www.esa.int/Highlights/Week_In_Images_16_20_March_2015

109) “UK joins Sentinel collaborative ground segment,” ESA, March 19, 2015, URL: http://www.esa.int/Our_Activities/Observing_the_Earth
/Copernicus/UK_joins_Sentinel_Collaborative_Ground_Segment

110) http://www.esa.int/Highlights/Week_In_Images_02_06_March_2015

111) Pierre Potin, “Sentinel-1 Mission,” POLinSAR 2015, ESA/ESRIN, Frascati, Italy, Jan. 26-30, 2015, URL: http://seom.esa.int/insarap/files/INSARAP-2014_Sentinel-1_Mission_Status_PPotin.pdf

112) “Lisbon, Portugal,” ESA, Feb. 6, 2015, URL: http://www.esa.int/spaceinimages/Images/2015/02/Lisbon_Portugal

113) “Satellites catch Austfonna shedding ice,” ESA, Jan. 23, 2014, URL: http://www.esa.int/Our_Activities/Observing_the_Earth/Satellites_catch_Austfonna_shedding_ice

114) Malcolm McMillan, Andrew Shepherd, Noel Gourmelen, Amaury Dehecq, Amber Leeson, Andrew Ridout, Thomas Flament, Anna Hogg, Lin Gilbert, Toby Benham, Michiel van den Broeke, Julian A. Dowdeswell, Xavier Fettweis, Brice Noël, Tazio Strozzi, “Rapid dynamic activation of a marine-based Arctic ice cap,” Geophysical Research Letters, Vol. 41, Dec. 23, 2014, doi:10.1002/2014GL06225, URL: http://onlinelibrary.wiley.com/doi/10.1002/2014GL062255/full

115) “Mexico City subsidence,” ESA, Dec. 11, 2014, URL: http://www.esa.int/spaceinimages/Images/2014/12/Mexico_City_subsidence

116) “Romania,” ESA, image in the 'Earth from Space video program' series, Dec. 5, 2014: URL: http://www.esa.int/spaceinimages/Images/2014/12/Romania

117) “Sentinel-1 maps Fogo eruption,” ESA, Dec. 2, 2014, URL: http://www.esa.int/spaceinimages/Images/2014/12/Sentinel-1_maps_Fogo_eruption

118) “Laser link offers high-speed delivery,” ESA, Nov. 28, 2014, URL: http://www.esa.int/Our_Activities
/Observing_the_Earth/Copernicus/Sentinel-1/Laser_link_offers_high-speed_delivery

119) “Super laser revolutionizes data communications in space,” DLR, Nov. 28, 2014, URL: http://www.dlr.de/dlr/en/desktopdefault.aspx/tabid-10081/151_read-12327/year-all/#/gallery/17332

120) “Succesful demonstration of Alphasat-Sentinel-1A laser link,” ESA, Nov. 30, 2014, URL: http://artes.esa.int/news/succesful-demonstration-alphasat-sentinel-1a-laser-link

121) “First image download over new gigabit laser connection in space,” Airbus Defence and Sapce, Nov. 28, 2014, URL: http://airbusdefenceandspace.com/newsroom/news-and-features
/first-image-download-over-new-gigabit-laser-connection-in-space/

122) http://www.esa.int/spaceinimages/Images/2014/11/Berlin_from_Sentinel-1A_via_laser

123) “Tokyo Bay, Japan,” ESA, image in the 'Earth from Space video program' series, Nov. 21, 2014, URL: http://www.esa.int/spaceinimages/Images/2014/11/Tokyo_Bay_Japan

124) “DLR and ESA sign the collaborative ground segment cooperation for Sentinel data,” ESA, Nov. 10, 2014, URL: http://www.esa.int/Our_Activities/Observing_the_Earth/Copernicus
/DLR_and_ESA_sign_the_Collaborative_Ground_Segment_Cooperation_for_Sentinel_data

125) “Copernicus Agreement,” ESA, Oct. 28, 2014, URL: http://www.esa.int/spaceinimages/Images/2014/10/Copernicus_Agreement

126) “Copernicus Sentinel 1: Making our seas safer,” ESA, Oct. 22, 2014, URL: http://www.esa.int/Our_Activities/Observing_the_Earth/Copernicus
/Sentinel-1/Copernicus_Sentinel-1_making_our_seas_safer

127) “Monitoring icebergs,” ESA, image release on Oct. 22, 2014, URL: http://www.esa.int/spaceinimages/Images/2014/10/Monitoring_icebergs

128) “First Copernicus satellite now operational,” ESA, Oct. 6, 2014, URL: http://www.esa.int/Our_Activities/Observing_the_Earth/Copernicus
/Sentinel-1/First_Copernicus_satellite_now_operational

129) “Radar vision maps Napa Valley earthquake,” ESA, Sept. 2, 2014, URL: http://www.esa.int/Our_Activities/Observing_the_Earth/Copernicus
/Sentinel-1/Radar_vision_maps_Napa_Valley_earthquake

130) “Sentinel-1 poised to monitor motion,” ESA, August 26, 2014, URL: http://www.esa.int/Our_Activities/Observing_the_Earth/Copernicus
/Sentinel-1/Sentinel-1_poised_to_monitor_motion

131) Manuela Braun, Richard Bamler, “Sentinel-1 — Earth's topography as a colored pattern,” DLR, August 26, 2014, URL: http://www.dlr.de/dlr/en/desktopdefault.aspx
/tabid-10081/151_read-11427/#/gallery/16251

132) Matthias Motzigemba, Herwig Zech, Frank Heine, Stefan Seel, Daniel Tröndle, “Laser Communication in Space becomes operational – a new chapter begins for EO Missions and military surveillance,” Proceedings of the 65th International Astronautical Congress (IAC 2014), Toronto, Canada, Sept. 29-Oct. 3, 2014, paper: IAF-14,B2,1.4

133) “Rio de Janeiro, Brazil,” ESA, Earth from Space video program, July 11, 2014, URL: http://www.esa.int/spaceinimages/Images/2014/07/Rio_de_Janeiro_Brazil

134) “Mount Pinatubo, Philippines,” ESA, July 4, 2014, URL: http://www.esa.int/spaceinimages/Images/2014/07/Mount_Pinatubo_Philippines

135) “Sentinel-1A aids Balkan flood relief,” ESA, May 28, 2014, URL: http://www.esa.int/Our_Activities/Observing_the_Earth/Copernicus
/Sentinel-1/Sentinel-1_aids_Balkan_flood_relief

136) “Lake Constance (Bodensee),” ESA, May 30, 2014, URL: http://www.esa.int/spaceinimages/Images/2014/05/Lake_Constance

137) “Greece guaranteed access to Sentinel data,” ESA, May 12, 2014, URL: http://www.esa.int/Our_Activities/Observing_the_Earth/Copernicus
/Greece_guaranteed_access_to_Sentinel_data

138) “Copernicus Sentinels Serving Society and the Environment,” Athens, Greece, May 12-13, 2014, URL: http://congrexprojects.com/2014-events/Copernicus/program

139) “Copernicus Benefitting Society and the Environment,” ESA, May 13, 2014, URL: http://www.esa.int/Our_Activities/Observing_the_Earth/Copernicus
/Copernicus_benefitting_society_and_the_environment

140) “Radar image of the Salar de Uyuni, Bolivia,” released on May 9, 2014 on ESA's Earth from Space video program, URL: http://www.esa.int/spaceinimages/Images/2014/05
/Radar_image_of_the_Salar_de_Uyuni_Bolivia

141) “Radar image of the Netherlands,” ESA, April 25, 2014, URL: http://www.esa.int/spaceinimages/Images/2014/04
/Radar_image_of_the_Netherlands

142) “Earth from Space: Sampling Sentinel,” ESA, April 25, 2014, URL: http://www.esa.int/spaceinvideos/Videos/2014/04/Earth_from_Space_Sampling_Sentinel

143) “First radar vision for Copernicus,” ESA, April 16, 2014, URL: http://www.esa.int/Our_Activities/Observing_the_Earth
/Copernicus/Sentinel-1/First_radar_vision_for_Copernicus

144) Ramon Rorres, Svein Lokas, Dirk Geudtner, Betlem Rosich, “Sentinel-1A LEOP and Commissioning Results,” Proceedings of EUSAR 2014 (10th European Conference on Synthetic Aperture Radar), Berlin, Germany, June 3-5, 2014

145) “A night shift like never before,” ESA, April 9, 2014, URL:
http://blogs.esa.int/eolaunches/2014/04/09
/a-night-shift-like-never-before/

146) I. Shurmer, A. O'Connell, J. Morales, Juan Pineiro, P.P. Emanuelli, ”The Sentinel-1A LEOP: Paving the way for the Sentinels LEOP preparation and execution,” Proceedings of the 14th International Conference on Space Operations (SpaceOps 2016), Daejeon, Korea, May 16-20, 2016, paper: AIAA 2016-2457, URL: http://arc.aiaa.org/doi/pdf/10.2514/6.2016-2457

147) M. A. Martín Serrano, M. Catania, J. Sánchez, A. Vasconcelos, D. Kuijper, X. Marc, ”Sentinel-1a Flight Dynamics LEOP Operational Experience,” Proceedings of the 25th International Symposium on Space Flight Dynamics, Munich, Germany, Oct. 19-23, 2015, URL: http://issfd.org/2015/files/downloads/papers/137_Martin-Serrano.pdf

148) A. Vasconcelos, M. A. Martín Serrano, J. Sánchez, D. Kuijper, X. Marc, ”Sentinel-1a Reference Orbit Acquisition Maneuver Campaign,” Proceedings of the 25th International Symposium on Space Flight Dynamics, Munich, Germany, Oct. 19-23, 2015, URL: http://issfd.org/2015/files/downloads/papers/134_Vasconcelos.pdf

149) “Sentinel-1 performs opening dance routine,” ESA, April 4, 2014, URL: http://www.esa.int/Our_Activities/Observing_the_Earth/Copernicus
/Sentinel-1/Sentinel-1_performs_opening_dance_routine

150) “Separation in space,” ESA, April 04,2014, URL: http://www.esa.int/spaceinvideos/Videos/2014/04/Separation_in_space


The information compiled and edited in this article was provided by Herbert J. Kramer from his documentation of: ”Observation of the Earth and Its Environment: Survey of Missions and Sensors” (Springer Verlag) as well as many other sources after the publication of the 4th edition in 2002. - Comments and corrections to this article are always welcome for further updates (herb.kramer@gmx.net).

References    Back to top