Copernicus: Sentinel-1 2020
Sentinel-1 mission and its imagery in the period 2020
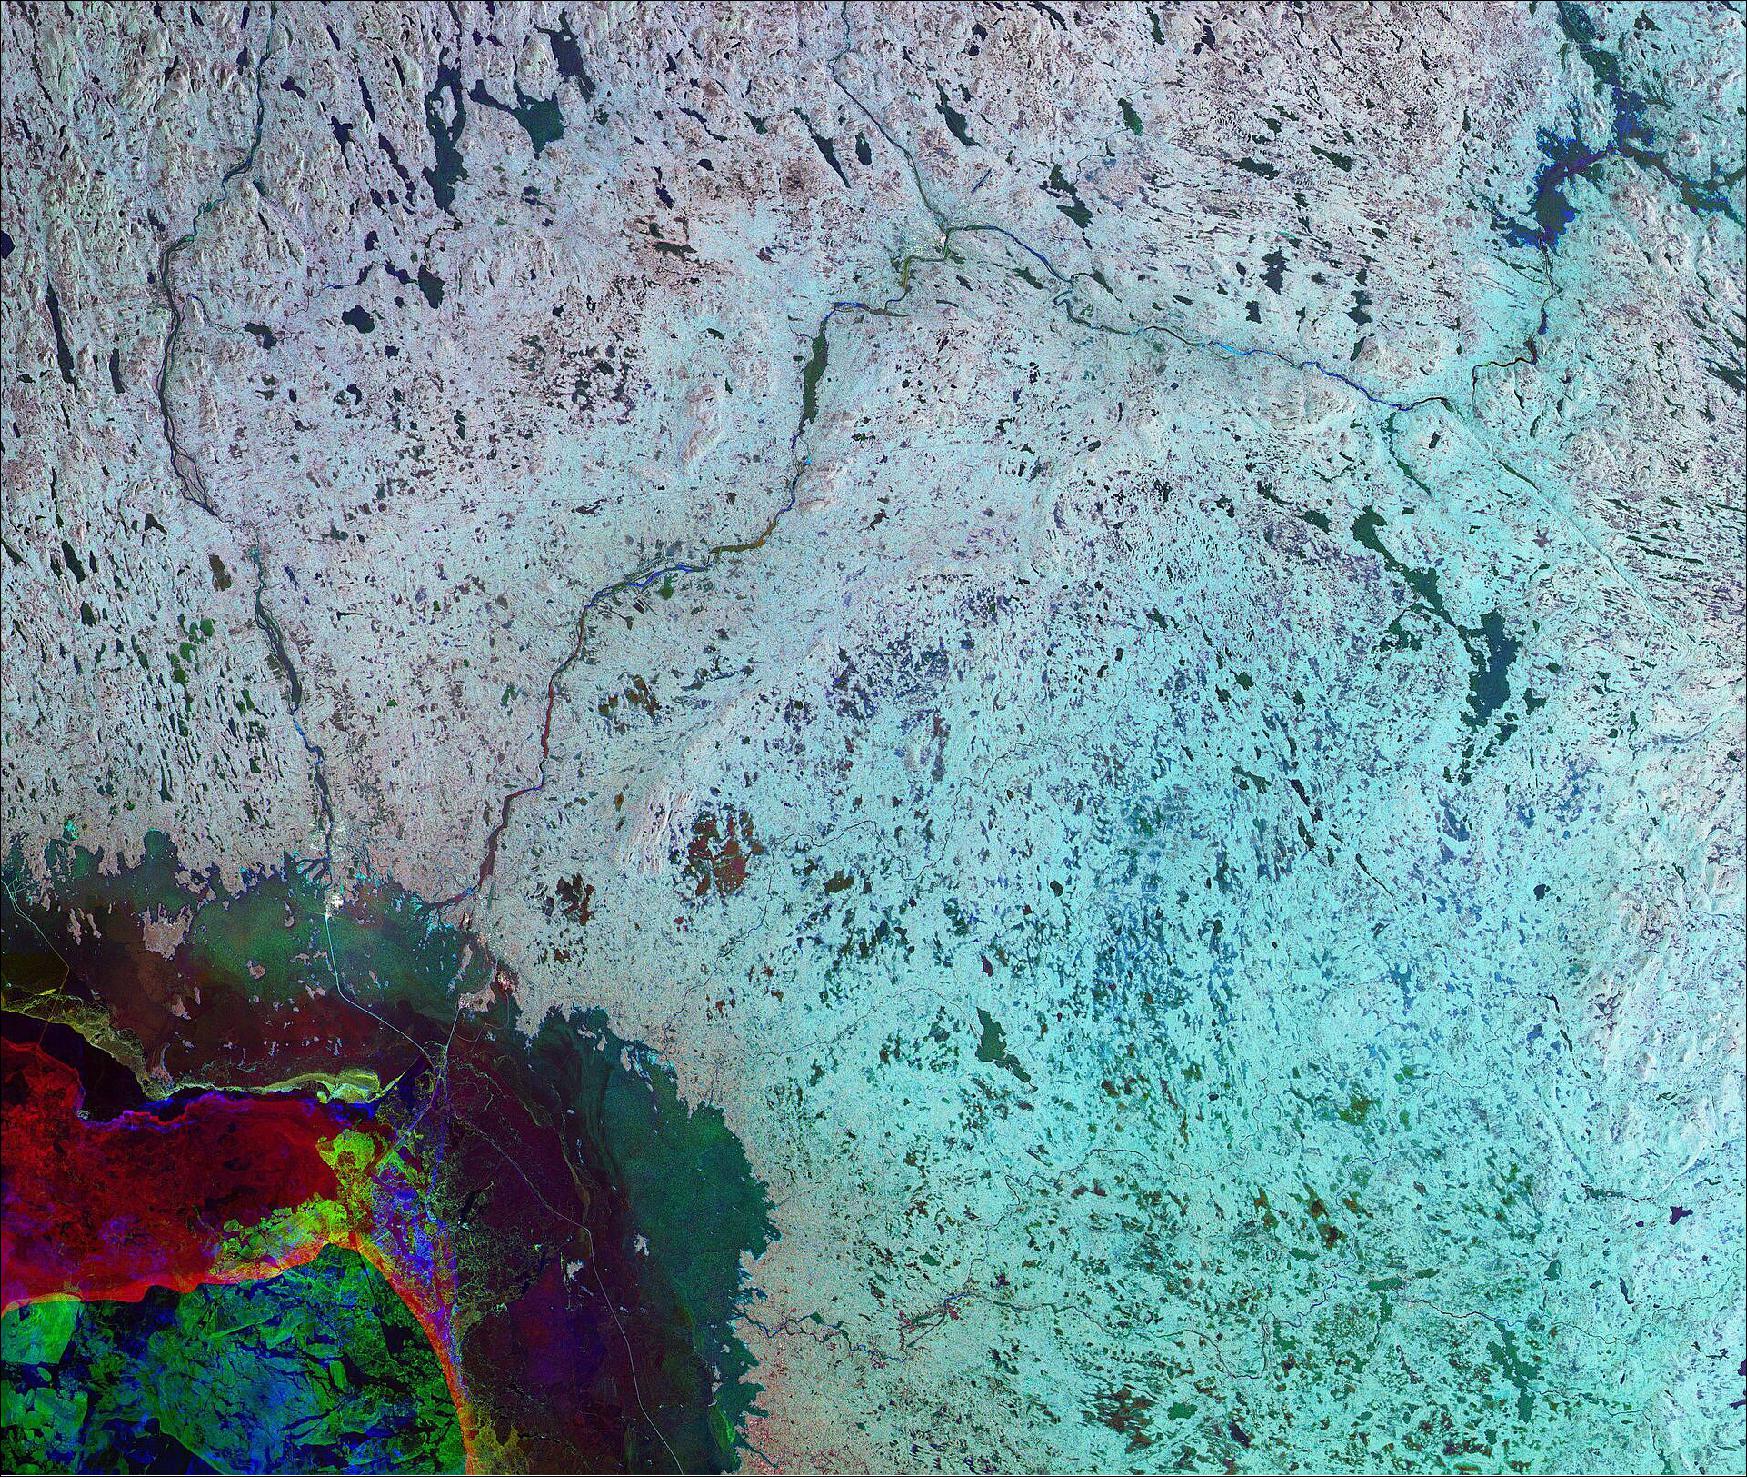
• December 18, 2020: The Copernicus Sentinel-1 mission takes us over Lapland, the largest and northernmost region of Finland, just in time for Christmas. 1)
- Located within the Arctic Circle, Lapland, also called Sápmi by the Sami people, stretches across northern Norway, Sweden and Finland, and into the Kola Peninsula of Russia. It is bound by the Norwegian Sea on the west, the Barents Sea on the north, and the White Sea to the east.
- Lapland during the winter months means snowfall, temperatures well below zero degrees and the Northern Lights, or the Aurora Borealis, lighting up the dark, night skies. Rovaniemi, the capital of Lapland, lies at the top of the image, and is considered the official hometown of Santa Claus.
- In Rovaniemi, the Arctic Circle runs through Santa Claus Village, located eight kilometers north of the city center. The Arctic Circle marks the southernmost latitude where the sun can stay continuously below or above the horizon for 24 hours – these phenomena are known as the Midnight Sun in the summer and the Polar Night in the winter.
- As an advanced radar mission, Copernicus Sentinel-1 can image the surface of Earth through cloud and rain and regardless of whether it is day or night – making it an ideal mission to monitor areas often shrouded in darkness like the polar regions.
• December 11, 2020: The giant A-68A iceberg could strike land this month – wreaking havoc near the waters of the South Georgia Island. 2)
- Satellite missions are being used to track the berg on its journey over the past three years. The Copernicus Sentinel-1 radar mission, with its ability to see through clouds and the dark, has been instrumental in mapping the polar regions in winter.
• November 26, 2020: An enormous iceberg, called A-68A, has made headlines over the past weeks as it drifts towards South Georgia in the Southern Ocean. New images, captured by the Copernicus Sentinel-1 mission, show the berg is rotating and potentially drifting westwards.

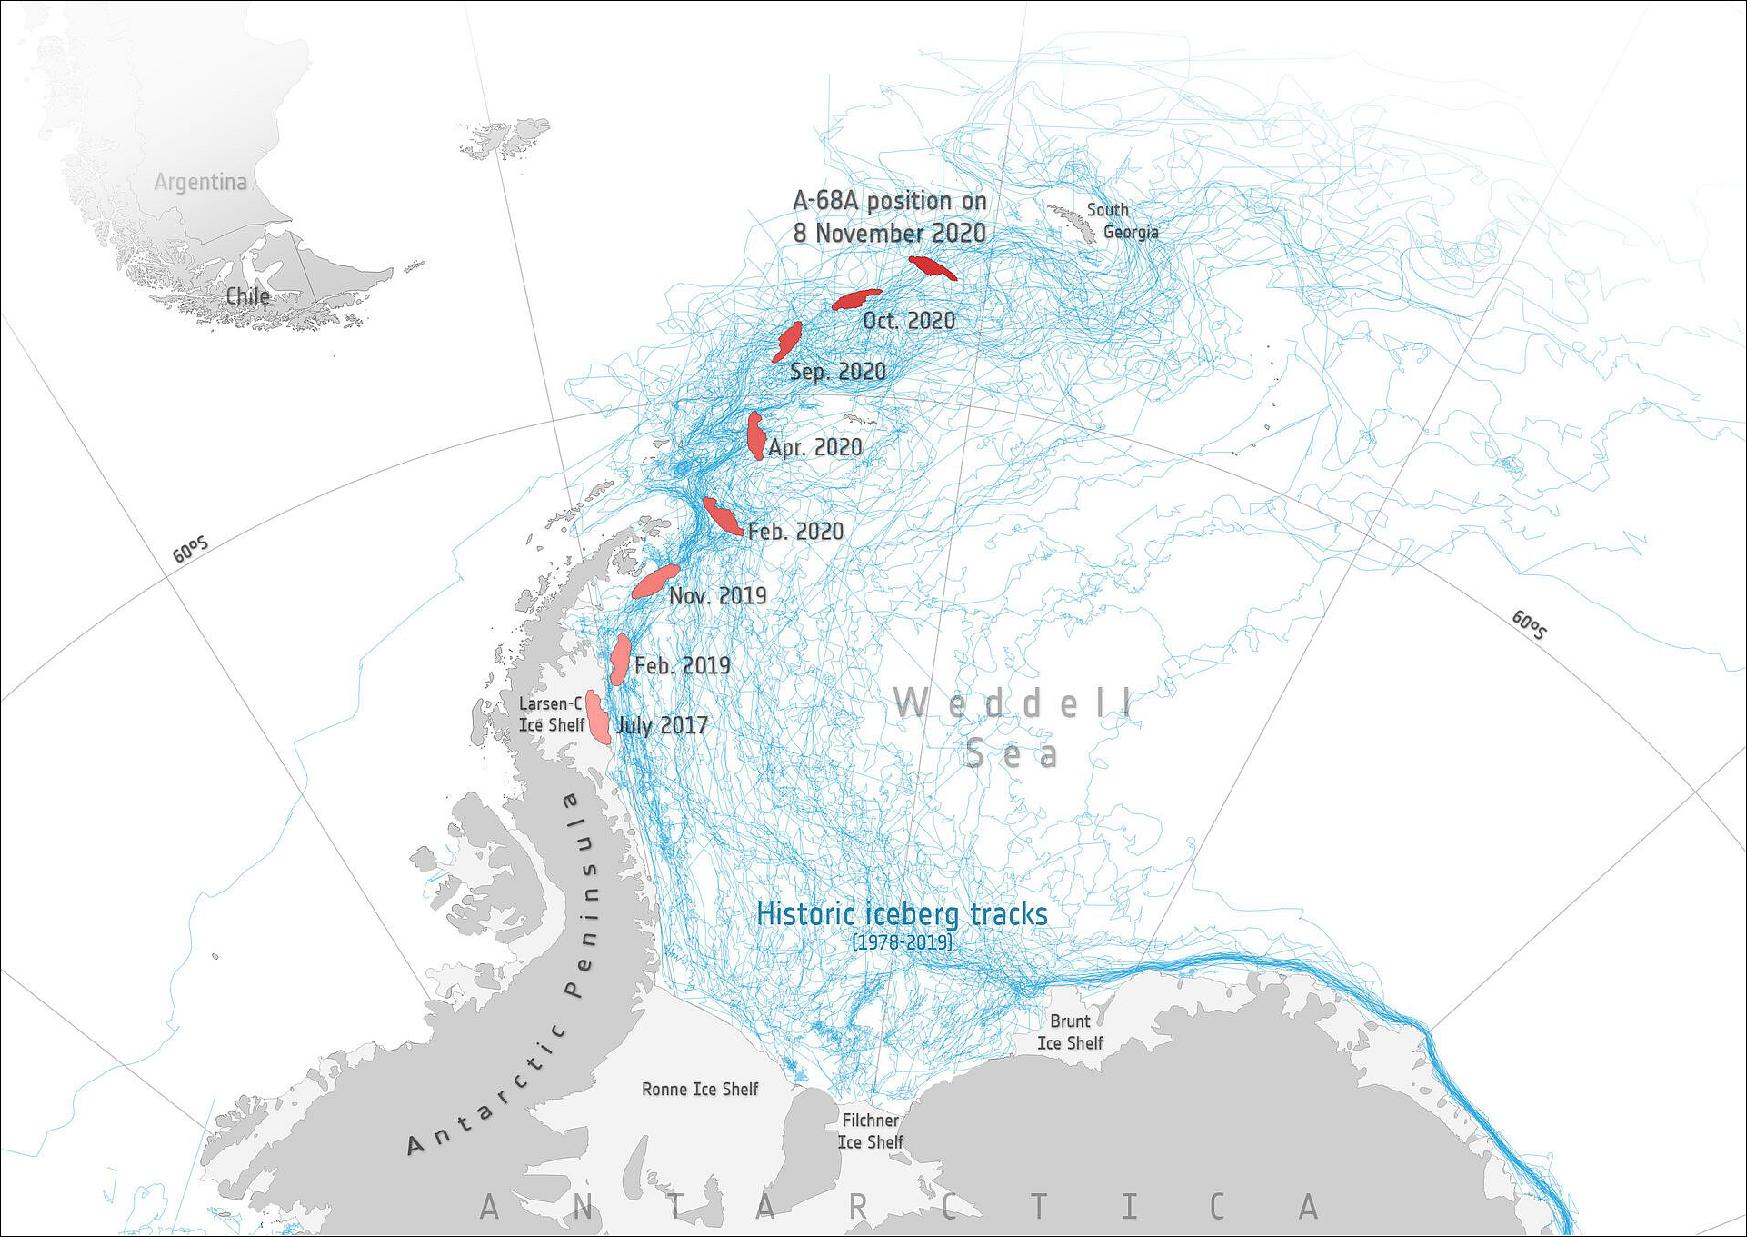
- In July 2017, the lump of ice, more than twice the size of Luxembourg, broke off Antarctica’s Larsen C ice shelf – spawning one of the largest icebergs on record. Now, three years later, the A68A berg is being carried by currents in open waters – thousands of kilometers from its birthplace.
- Satellite missions are being used to track the berg on its journey over the past three years. The Sentinel-1 radar mission, with its ability to see through clouds and the dark, has been instrumental in mapping the polar regions in winter.
• November 10, 2020: The colossus iceberg that split from Antarctica’s Larsen C ice shelf on 12 July 2017 is on a collision course with South Georgia. 3)
- Over the last three years, satellite missions such as Copernicus Sentinel-1 have been used to track the berg as it has drifted in the Southern Ocean. For the first two years, it remained close to its parent ice sheet, impeded by sea ice. But now, as the map shows, the main chunk of the A-68 berg, known as A-68A, is heading rapidly for South Georgia. It is now about 350 km from the island.
- About the same size as the South Atlantic island, it could ground in the shallow waters offshore and cause real problems for the island wildlife and seafloor-dwelling life. Penguins and seals need access to the sea to feed so the iceberg could easily block their foraging routes and life on the seafloor could be crushed if the berg grounds. The fear is that if the berg does anchor against the South Georgia coast, it could remain there for up to 10 years. When the A38 grounded here in 2004, many dead penguin chicks and seal pups were found along the shoreline.
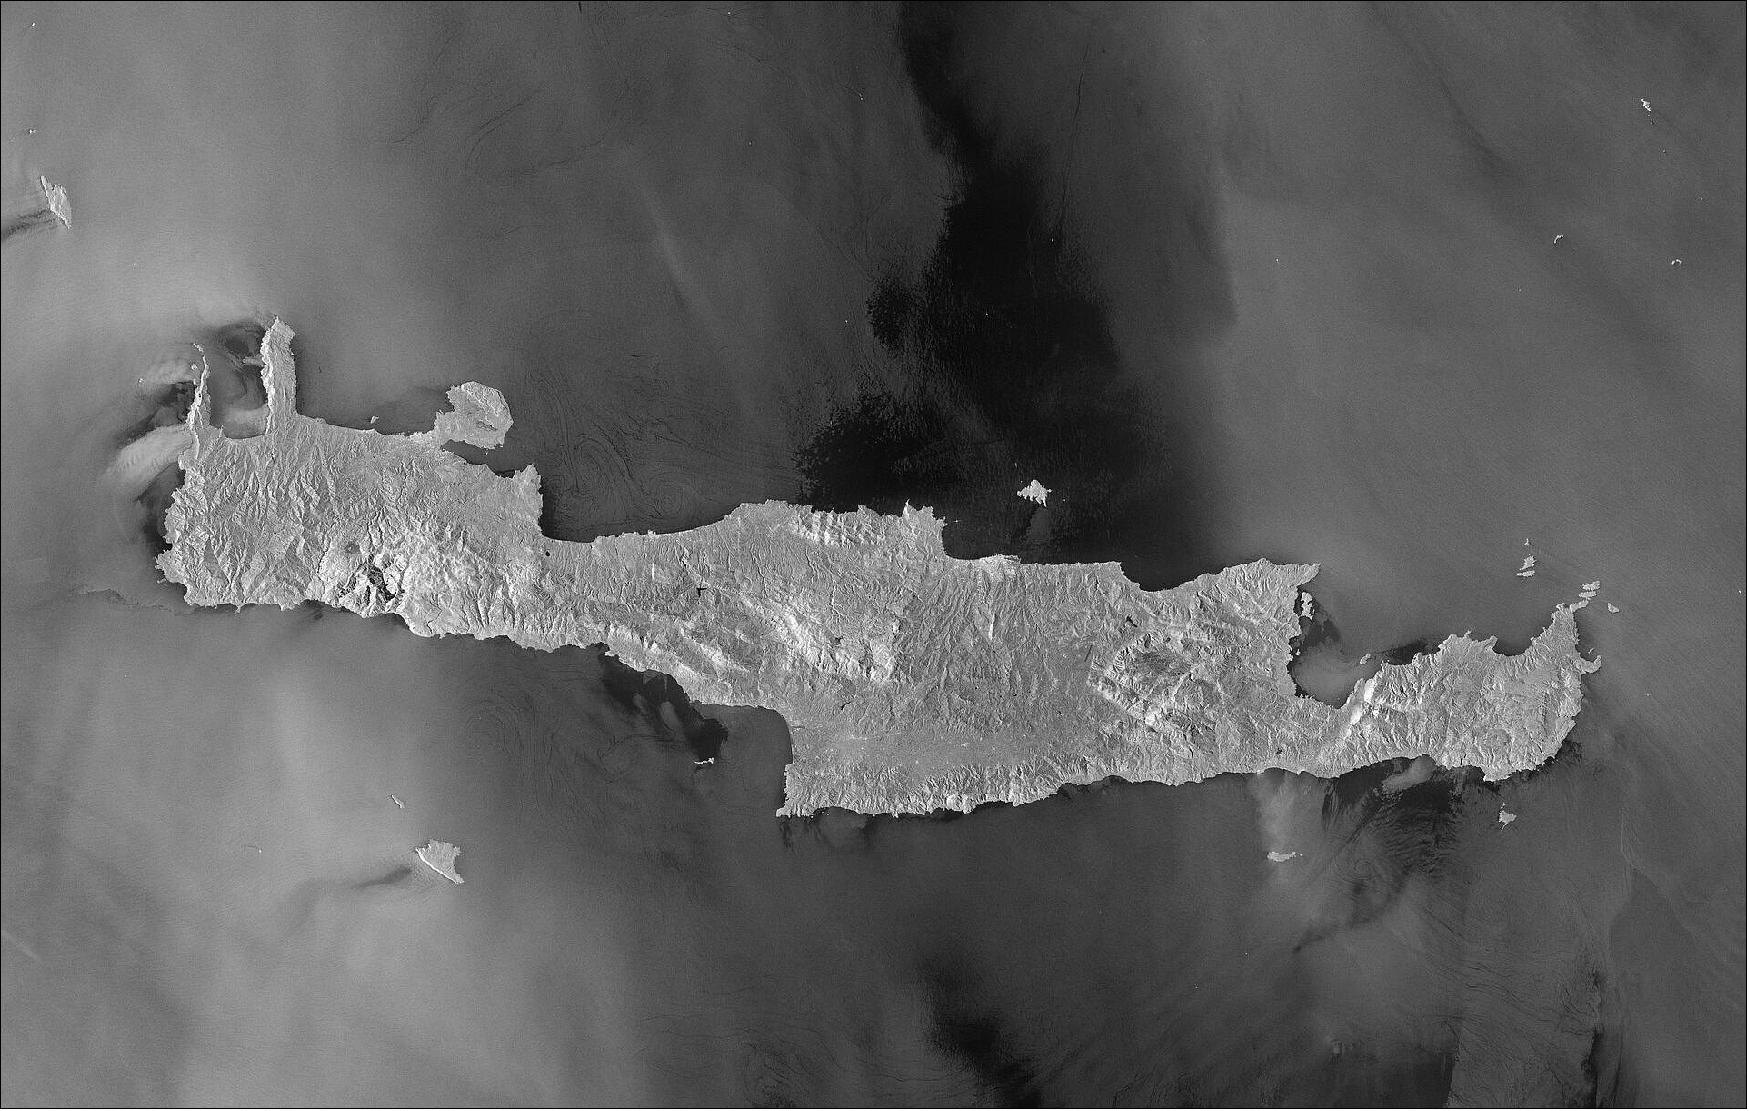
• November 6, 2020: Greece’s largest and most populous island, Crete, is featured in this image captured by the Copernicus Sentinel-1 mission. 4)
- Crete extends for approximately 260 km from west to east, and is approximately 60 km across at its widest point. Crete is known for its rugged terrain and is dominated by a high mountain range crossing from west to east. This includes the Lefká Ori, or ‘White Mountains’ in the west, Mount Ida, Crete’s highest mountain, visible in the centre of the island, and the Díkti Mountains in the east. Crete’s capital and largest city of the island, Heraklion, is located along the northern coastline.
- Several other smaller islands are dotted around the image, including Gavdos, Chrisi and Dia.
- Unbeknown to many, the island of Crete plays an important role in the Copernicus satellite altimetry constellation and on an international stage. Satellite altimetry data have to be continuously monitored at the ESA Permanent Facility for Altimetry Calibration (PFAC) where different techniques have pioneered the use of transponders linked to international metrology standards to provide the best measurements to validate satellite altimeters in space soon after launch.
- This PFAC network has been operating for around two decades, with a main calibration validation station located on the island of Gavdos and a dedicated transponder site in the Cretan mountains. A transponder receives, amplifies and re-transmits the radar pulse back to the radar altimeter in space where the signal is recorded. The transponder measurements are used to determine the range and datation of the satellite altimeter data in a unique manner – something that is very difficult to achieve on the ground.
- Western Crete was identified as a unique location for the inter-comparison of satellite altimeters owing to its unique positioning of the Copernicus Sentinel-3 and Sentinel-6 orbit crossing points.
- The sea surrounding the island has minimal tides, and the rugged mountainous landscape means that the transponder signals can be measured from space with little interference, but most importantly, in the sky above it, a number of satellites in orbit converge. This allows each satellite flying above to be cross-calibrated with the next one at one specific meeting point using the same instrumentation.
- The Fiducial Reference Measurements for Sentinel-6 is the latest activity designed to bring the full power of the PFAC to check the performance of the upcoming Copernicus Sentinel-6 Michael Freilich satellite – the next radar altimetry reference mission extending the legacy of sea-surface height measurements until at least 2030.
- Every 10 days, Sentinel-6 will provide sufficient measurements to map the sea-surface height of the ocean from which sea-level rise can be computed. As part of the ESA contribution to the long-term verification and validation of both Sentinel-3 and Sentinel-6 missions, the PFAC is being extended with a second transponder to be installed on Gavdos Island, southwest of Crete, as seen in the Sentinel-1 radar image. This gives the ‘big picture’ allowing us to chart the sea level with confidence.
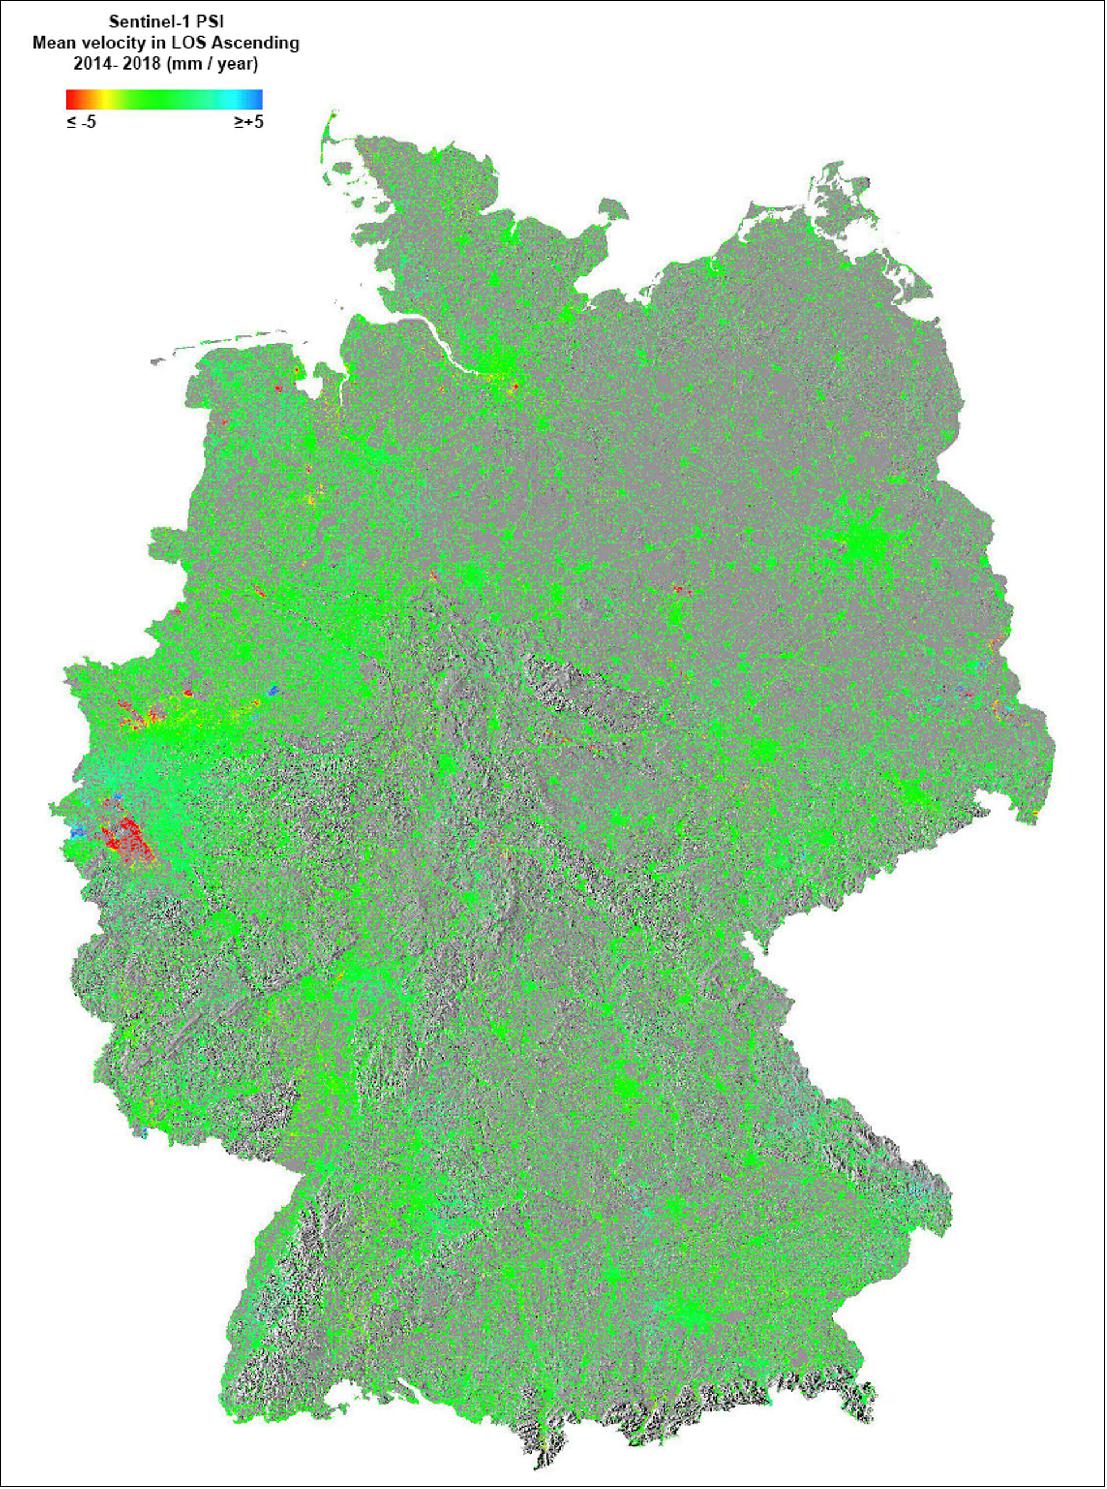
• November 3, 2020: Tiny shifts in the land surface across the whole of Germany have been mapped for the first time, with the help of the Copernicus Sentinel-1 radar mission. 5)
- Land-surface deformation, such as subsidence, often happens because of changes that take place underground such as groundwater extraction, mining, natural consolidation of sediments and rapid urbanization.
- This ground motion can be a major threat, in both urban and agricultural areas, where continuous shifts over time can cause, for example, damage to buildings, roads, bridges, dykes and other infrastructure, and can cause changes in the way surface water flows and accumulates – all of which has economic implications.
- Urban development projects and risk assessment efforts rely on ground-motion monitoring, which is usually supplied by terrestrial surveying methods. Images from space, however, offer cost-effective, systematic, high-precision measurements over most of Earth’s land surface.
• October 23, 2020: Global sea level has been rising at a rate of 3.3 mm per year in the past three decades. The causes are mostly the thermal expansion of warming ocean water and the addition of fresh water from melting ice sheets and glaciers. But even as the sea takes up more space, the elevation of the land is also changing relative to the sea. 6)
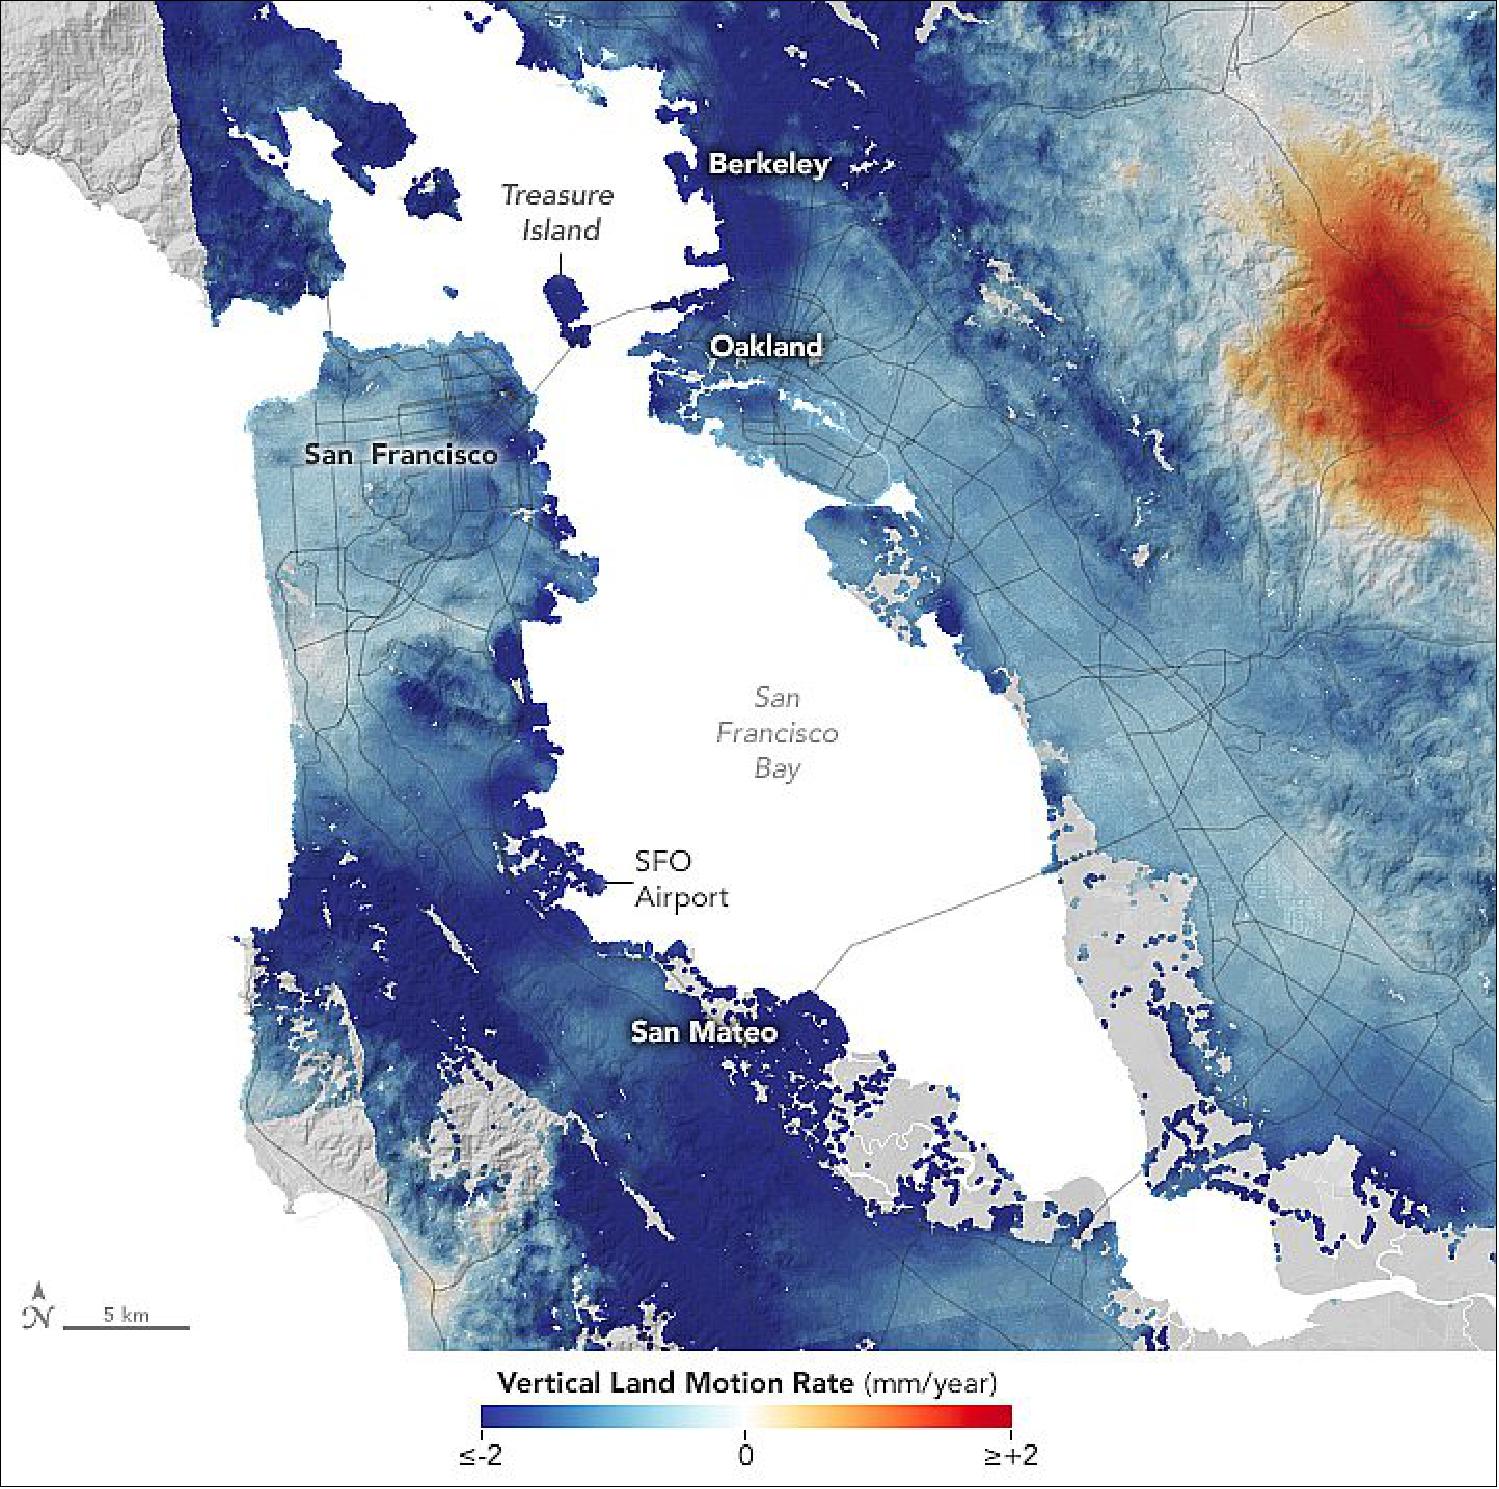
- What geologists call vertical land motion—or subsidence and uplift—is a key reason why local rates of sea level rise can differ from the global rate. California offers a good example of how much sea level can vary on a local scale.
- “There is no one-size-fits-all rule that applies for California,” said Em Blackwell, a graduate student at Arizona State University. Blackwell worked recently with Virginia Tech geophysicist Manoochehr Shirzaei to estimate vertical land motion along California’s coast by analyzing radar measurements made by satellites. The research team—which also included Virginia Tech’s Susanna Werth and Geoscience Australia’s Chandrakanta Ojha—found that up to 8 million Californians live in areas where the land is sinking, including large numbers of people around San Francisco, Los Angeles, and San Diego.
- Land can rise or fall as a consequence of natural and human-caused processes. Key natural processes include tectonics, glacial isostatic adjustment, sediment loading, and soil compaction, explained Shirzaei. Humans can induce vertical land motion by extracting groundwater and through gas and oil production.
- The radar data came from sensors on Japan’s Advanced Land Observing Satellite (ALOS) and Europe’s Sentinel-1A satellite. The researchers also made use of horizontal and vertical velocity data from ground-based receiving stations in the Global Navigation Satellite System (GNSS). The InSAR data shown in these maps have an average spatial resolution of 80 meters per pixel, more than one thousand times higher than previous maps based only on GNSS data.
- The reasons why land uplifts or subsides in any given area can be complex. Over long time scales and large scales, tectonic plates can shift the land. For instance, in Northern California the subduction of the small Gorda plate beneath the North American plate at the Mendocino Triple Junction causes the crust to thicken and rise a few millimeters per year. But to the south of Cape Mendocino, the tectonic environment is quite different. Instead of one plate diving beneath another and pushing it upward, the Pacific Plate and the North American Plate grind past each other in a north-south direction, which causes significantly less uplift in central and southern California.
- Other geologic forces work closer to the surface and over shorter spans of time. In river deltas, bays, valleys, and other areas where sediments pile up, land tends to sink over time from the added weight—a process called sediment loading. It also sinks because particles of sediments get squeezed together and compressed over time, explained Shirzaei, the project lead and a member of NASA’s sea level change science team. In fact, sediment compaction is the main reason that the areas around San Francisco Bay, Monterey Bay, and San Diego Bay have relatively high rates of subsidence.
- Human activities tend to have more short-term effects on vertical land motion. One example is the zone of strong uplift around Santa Ana, a valley just south of Los Angeles. That is mainly due to a groundwater management system that has replenished aquifers in recent years, a process that causes uplift. The map indicates one bit of positive news for Los Angeles: uplift along parts of the coast makes much of the city and its coastal suburbs less exposed to flooding hazards caused by increased sea level rise than other major coastal cities.
- This picture of vertical land motion (Figure 7) highlights the sea level rise planning and mitigation challenges that communities in many parts of the state face. “The dataset presented here can assist long-term resilience planning that enables coastal communities to choose among a continuum of adaptation strategies to cope with adverse impacts of climate change and sea-level rise,” said Shirzaei.
![Figure 7: The map highlights the variability in the rising and falling of land across California’s 1000-mile (1,500 km) coast. Areas shown in blue are subsiding, with darker blue areas sinking faster than lighter blue ones. The areas shown in dark red are rising the fastest. The map was created by comparing thousands of scenes of synthetic aperture radar (SAR) data collected between 2007 and 2011 (ALOS) with more collected between 2014 and 2018 (Sentinel-1A). Blackwell and colleagues looked for differences in the data—a processing technique known as interferometric synthetic aperture radar (InSAR). [image credit: NASA Earth Observatory images by Lauren Dauphin, using data from Blackwell, Em, et al. (2020) and topographic data from the Shuttle Radar Topography Mission (SRTM). Story by Adam Voiland]](https://eoportal.org/ftp/satellite-missions/c/S1_2020/S1.2020_Auto12.jpeg)
• September 29, 2020: Satellite imagery has revealed that two of the fastest-changing glaciers in Antarctica are fracturing and weakening faster than ever – the first step towards the glaciers disintegrating and causing sea levels to rise dramatically. 7)
- Using observations from ESA, NASA and USGS satellites, the researchers explored the Pine Island and Thwaites Glaciers in the Amundsen Sea Embayment: two of the most dynamic glaciers on the Antarctic continent, and those responsible for a substantial 5% of global sea level rise. 8)
- Together, the two glaciers form an area of flowing ice the size of Norway, and hold enough water to raise global sea levels by over a meter. Both have distinctly changed in morphology in recent decades along with changing atmospheric and oceanic conditions, with the warming oceans causing ice shelves to melt, thin, and retreat.
- Predicting how these vital glaciers will evolve in coming years is critical to understand the future of our seas and our warming planet – but such predictions have remained uncertain, with computer models unable to fully account for the glaciers’ processes and properties in their projections.
- "To reveal what’s really going on at Pine Island and Thwaites, we dug into imaging data from a number of different satellites," says Stef Lhermitte of Delft University of Technology in the Netherlands, and lead author of the new study.
- "We found structural damage at the ‘shear margins’ of the glaciers’ ice shelves, where the ice transitions from fast- to slow-moving: large crevasses, rifts and open fractures that indicate that the ice shelves are slowly tearing apart. Currently, the ice shelves are a little like a slow car in traffic: they force anything behind them to slow down. Once they’re removed, ice sitting further inland will be able to speed up, which in turn will cause sea levels to rise even faster."
- Such crevasses were not seen in imagery from 1997, and damage appeared far less prevalent in imagery from 2016, demonstrating that the deterioration accelerated over the past two decades and has grown significantly worse in the last few years.
- Lhermitte and colleagues tracked how the damaged areas had developed from 1997–2019, how the glacier and ice shelf elevation had changed over this time, and the velocity of moving ice using data from ESA’s Earth Explorer CryoSat mission, the Copernicus Sentinel-1 mission, the NASA/USGS Landsat program, and the Japanese ASTER instrument aboard NASA’s Terra satellite. They then modelled the potential impact of the damaged shear margins, with worrying results.
- "This fracturing appears to kick off a feedback process – it preconditions the ice shelves to disintegrate,” explains co-author Thomas Nagler of ENVEO in Innsbruck, Austria. “As the glaciers fracture at their weak points this damage speeds up, spreads, and weakens more of the ice shelves, causing further deterioration – and making it more likely that the shelves will start crumbling apart even faster."
![Figure 10: Rift evolution across the ice tongue – a long, narrow ice sheet extending seaward – of Antarctica’s Pine Island Glacier (PIG) in September and October of 2018, as seen by the Copernicus Sentinel-1 mission. The video shows the emergence of an ice sheet rift in a region that was previously stable [image credit: ESA, the image contains modified Copernicus Sentinel data (2018), processed by Stef Lhermitte (TU Delft)]](https://eoportal.org/ftp/satellite-missions/c/S1_2020/S1break_Pine_Island_Glacier.gif)
- As the ice shelves become increasingly damaged, the glaciers lose mass and their ‘grounding lines’ – the region where ice sheets become buoyant enough to detach from the seafloor and float – retreat. Overall, damage feedback processes appear to be a key factor in the future stability of Antarctica’s ice shelves, and, in turn, in how fast the continent’s glaciers melt and cause global sea levels to rise.
- "The results from this study highlight a pressing need to include such feedback processes in model projections of ice shelf retreat, ice sheet mass loss, and sea level change,” adds Mark Drinkwater, ESA’s Mission Scientist for CryoSat, and Senior Advisor on polar and cryosphere science.
- "We know that a significant amount of glacial ice in West Antarctica is currently being affected by climate change – in fact, a recent study found 24% of this ice to be rapidly thinning and unstable. These new results underline just how quickly this damage is occurring, and reveal that Pine Island and Thwaites Glaciers are more vulnerable than ever before."
- ESA research into Antarctic glaciers is continuing as part of the ESA POLAR+ Ice Shelves project, which kicked off in September 2020. With the collaboration of ENVEO and under the lead of Anna Hogg (University of Leeds, UK), the project's international team will further improve methods for monitoring the fracturing and damage of ice shelves. The project will generate a suite of Earth Observation datasets with which to characterize how ice shelves in Antarctica have changed over the last decade, and investigate the physical processes driving this evolution.
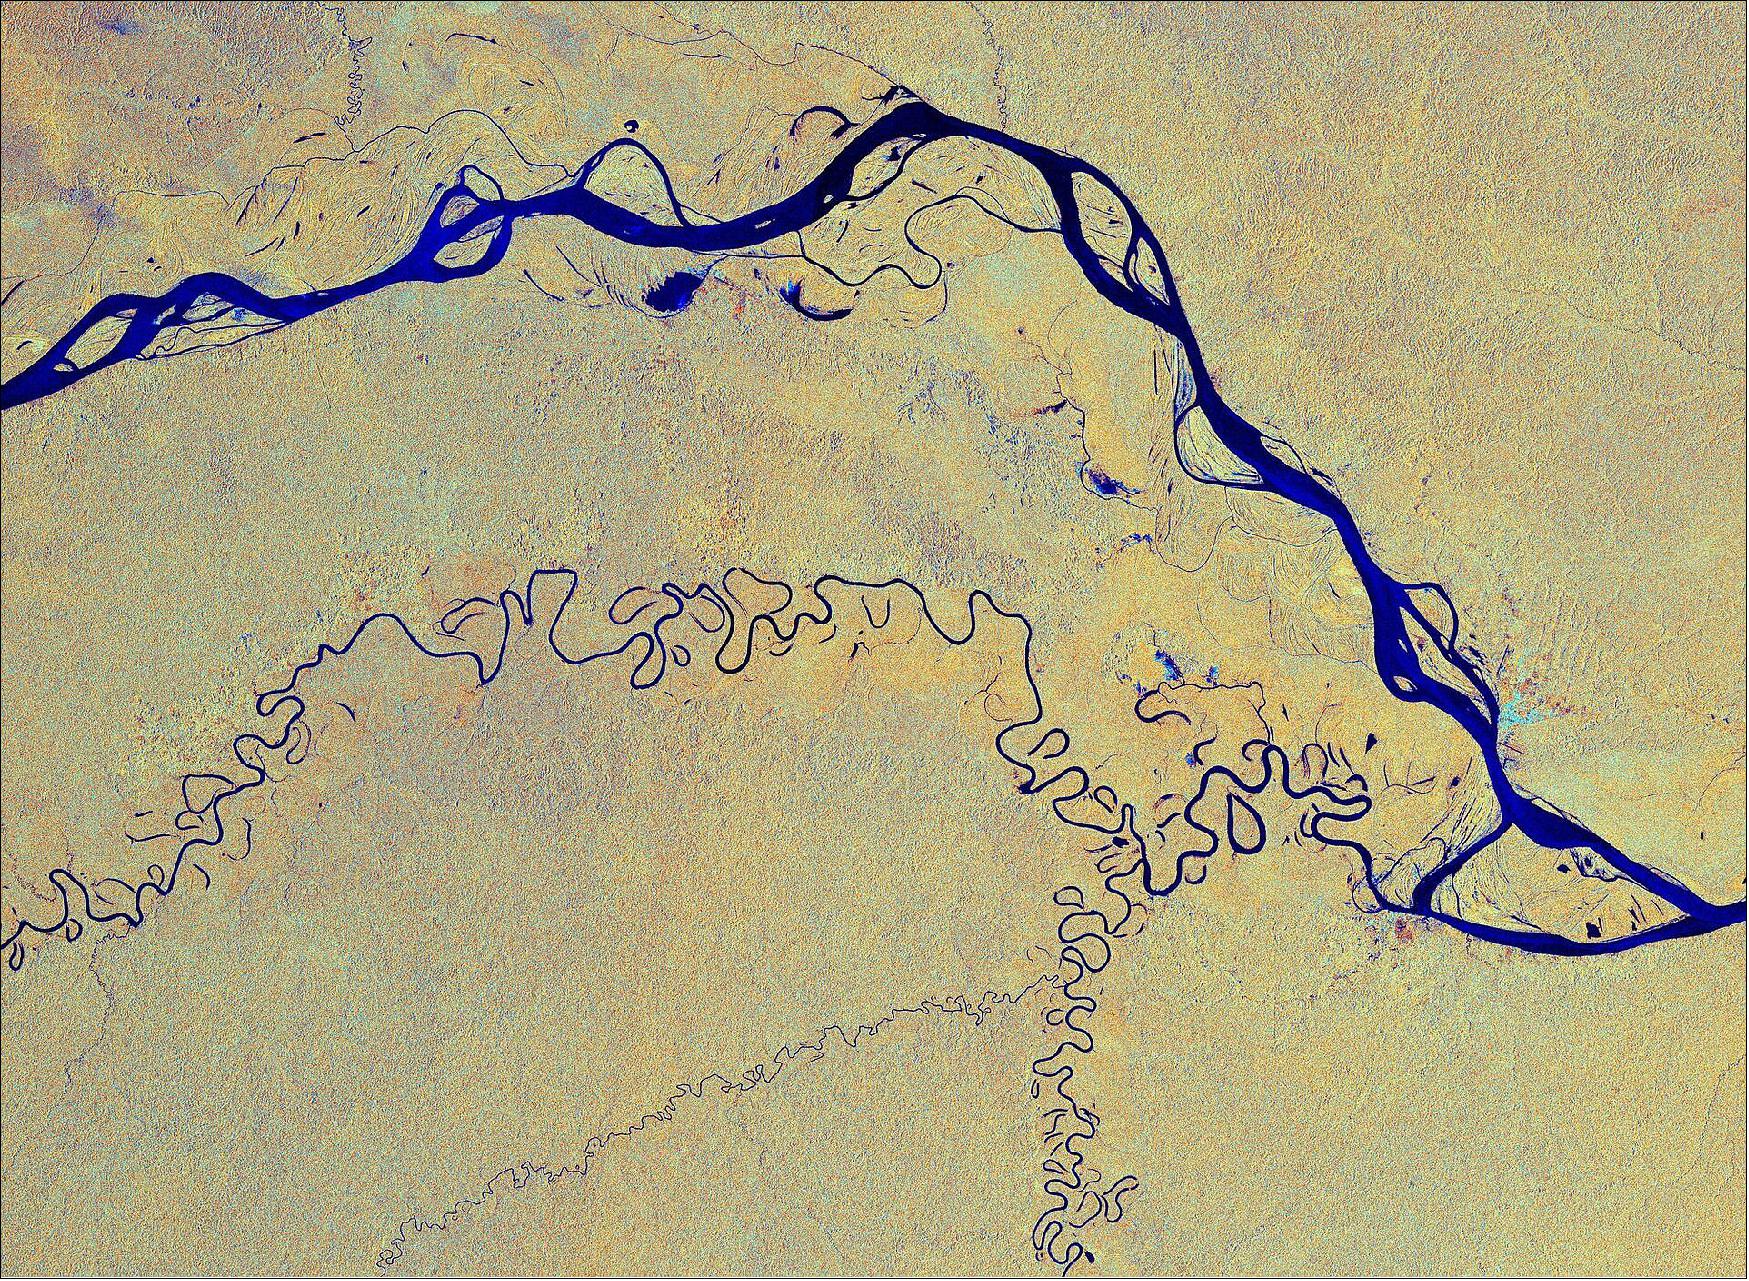
• September 11, 2020: This image, captured by the Copernicus Sentinel-1 mission, shows the Amazon River meandering through one of the most vital ecosystems in the world – the Amazon rainforest in South America. 9)
- The Amazon is considered the widest river in the world with a width of between 1.6 and 10 km, but expands during the wet season to around 50 km. With more than 1000 tributaries, the Amazon River is the largest drainage system in the world in terms of the volume of its flow and the area of its basin. As a consequence of its ever-changing flow, older riverbeds can be seen as thin lines around the main river at the top of the image.
- One of its tributaries, the Javari River, or Yavari River, is visible as a thinner blue line weaving through the tropical rainforest. The river flows for 870 km, forming the border between Brazil and Peru, before joining the Amazon River.
- In the image, cities and built-up areas are visible in cyan, for example the cities of Tabatinga and Leticia with two airports are easily identifiable in the far-right. The yellow and orange colors in the image show the surrounding Amazon forest.
- The colors of this week’s image come from the combination of two polarizations from the Copernicus Sentinel-1 radar mission, which have been converted into a single image.
- As radar images provide data in a different way than a normal optical camera, the images are usually black and white when they are received. By using a technology that aligns the radar beams sent and received by the instrument in one orientation – either vertically or horizontally – the resulting data can be processed in a way that produces colored images such as the one featured here. This technique allows for a better distinction of features on the ground.
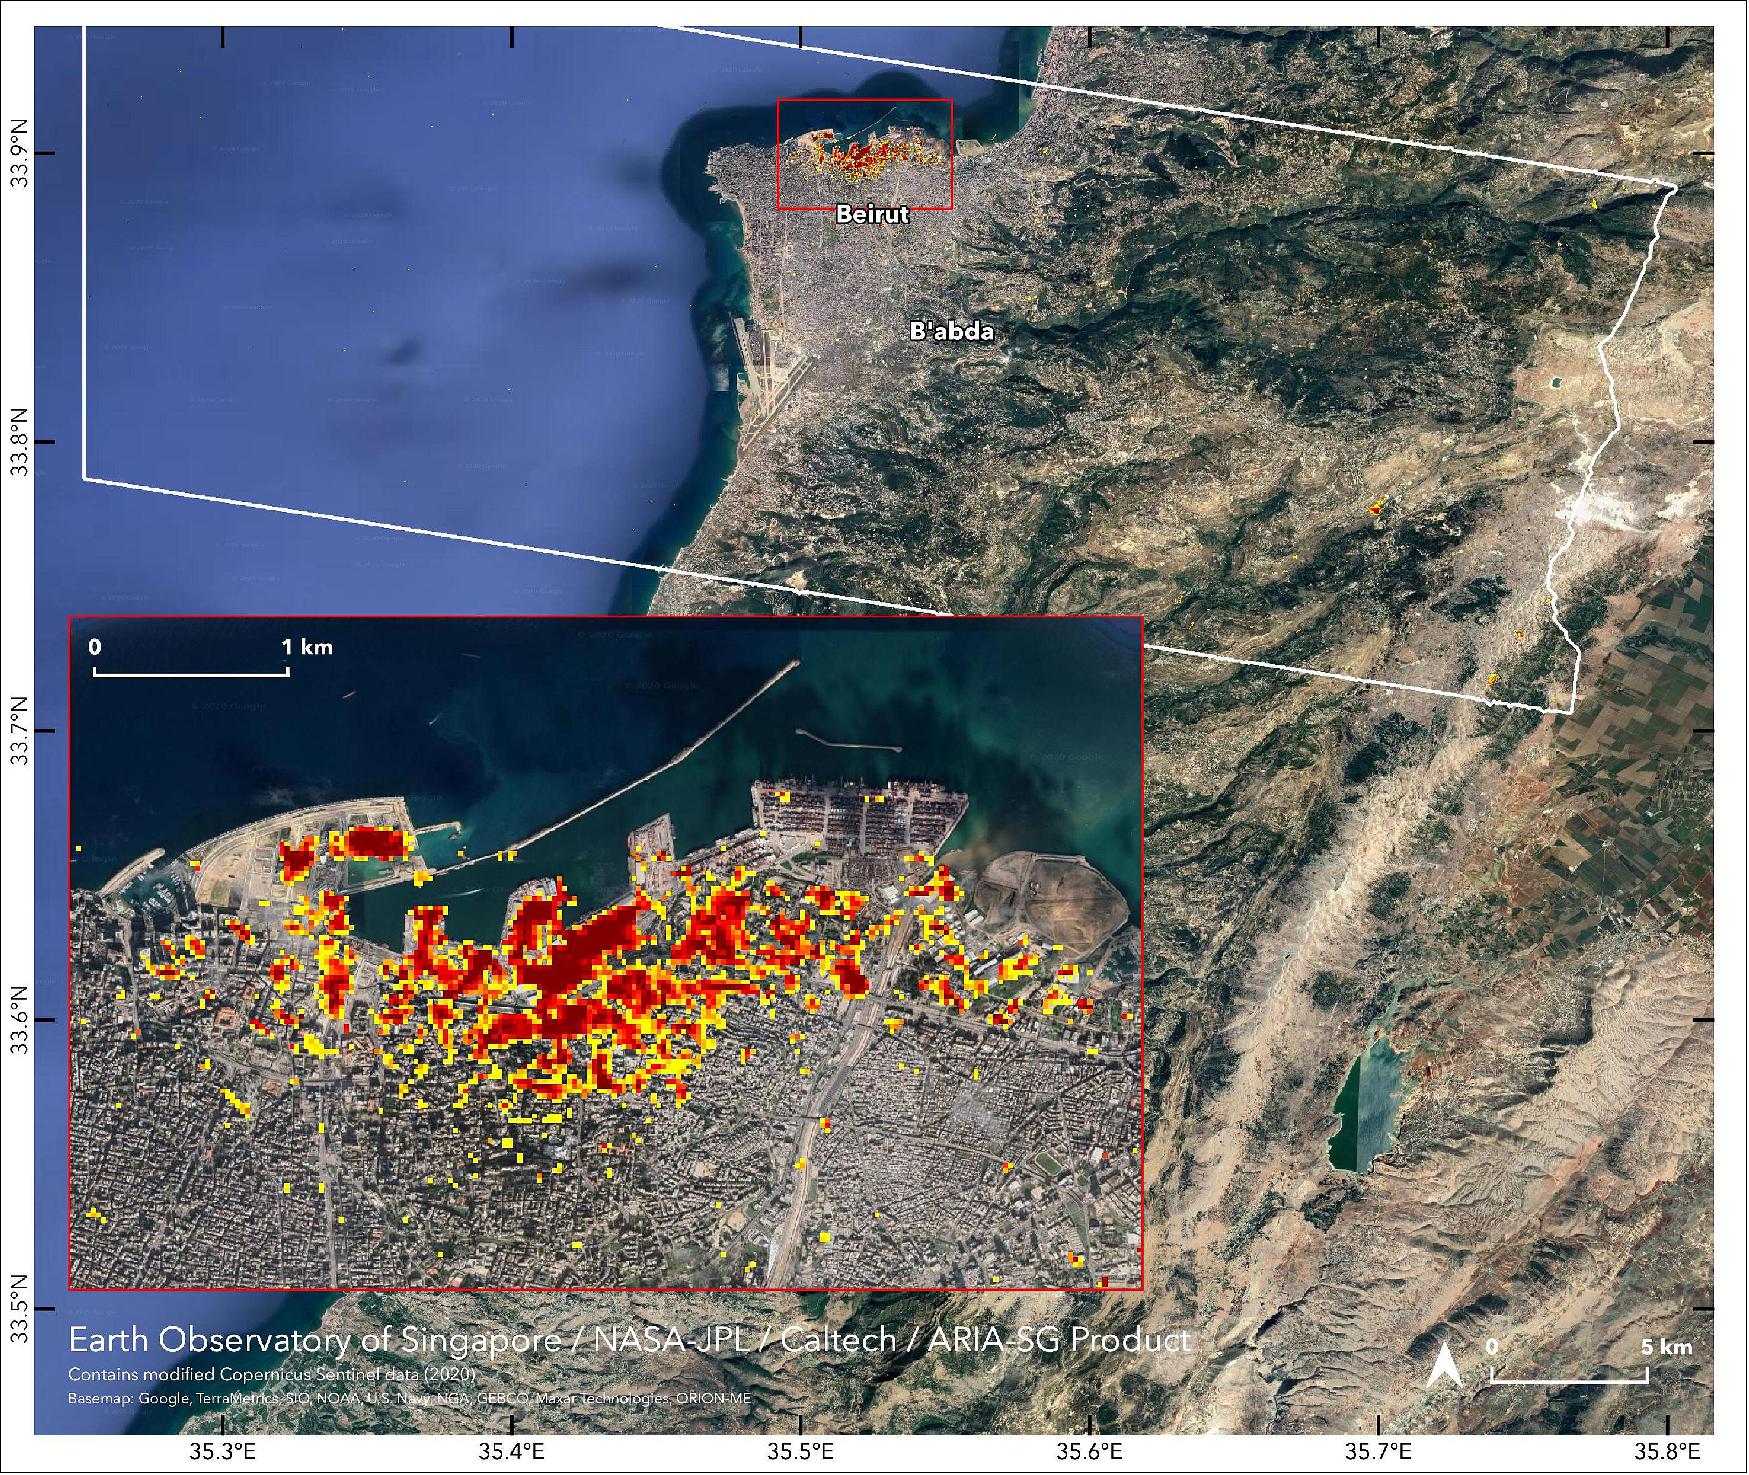
• August 11, 2020: On August 4, 2020, a devastating explosion rocked the port area around Beirut, Lebanon. After the event, scientists used satellite radar imagery to map the extent of the damage and help identify areas where people may need assistance. 10)
- According to the Associated Press, a fire near the port ignited a large nearby store of ammonium nitrate, a highly explosive chemical often used in fertilizer. At least 135 people died, about 5,000 were wounded, and at least 300,000 people were left homeless. Losses from the blast are estimated to be at least $10 to $15 billion, according to news reports.
- The team at ARIA (NASA Jet Propulsion Laboratory) and EOS examined synthetic aperture radar (SAR) data collected before and after the explosion, mapping changes in the land surface and built structures. SAR instruments send pulses of microwaves toward Earth’s surface and listen for the reflections of those waves. The radar waves can penetrate cloud cover, vegetation, and the dark of night to detect changes that might not show up in visible light imagery. When Earth’ crust moves due to an earthquake, when dry land is suddenly covered by flood water, or when buildings have been damaged or toppled, the amplitude and phase of radar wave reflections changes in those areas and indicates to the satellite that something on the ground has changed.
- Though other U.S. and international agencies play more immediate roles in response to disasters, NASA plays a role in providing observations and analysis. Over the past decade, NASA has actively built its capacity to share Earth observations that can improve the prediction of, preparation for, response to, and recovery from natural and technological disasters. For instance, NASA often responds to calls for data and imagery from the International Charter for Space and Major Disasters.
- “We look at areas of likely exposed populations and fragile infrastructure, as well as areas subject to social stresses and crises. We model and map risks, while also tracking emissions, debris, infrastructure damage, and other effects from things like volcanic eruptions, fires, industrial accidents, earthquakes, and floods,” said David Green, head of NASA’s Disasters Applications team. “Our observations and analyses can help our partners increase their situational awareness of systemic risks and of real-time events, leading to better-informed decisions and early action.”
![Figure 12: This image is a damage proxy map created by scientists affiliated with NASA’s Advanced Rapid Imaging and Analysis (ARIA) team and the Earth Observatory of Singapore (EOS). Dark red pixels represent the most severe damage, while orange and yellow areas are moderately or partially damaged. Each colored pixel represents an area of 30 m2 (about the size of a baseball diamond), [image credit: NASA Earth Observatory image by Joshua Stevens, using modified Copernicus Sentinel data (2020) processed by ESA and analyzed by Earth Observatory of Singapore (EOS) in collaboration with NASA-JPL and Caltech, Landsat data from the U.S. Geological Survey, and data from OpenStreetMap. Story by Esprit Smith, NASA's Earth Science News Team, and Michael Carlowicz]](https://eoportal.org/ftp/satellite-missions/c/S1_2020/S1.2020_AutoF.jpeg)
• August 8, 2020: NASA's Advanced Rapid Imaging and Analysis (ARIA) team, in collaboration with the Earth Observatory of Singapore, used satellite-derived synthetic aperture radar data to map the likely extent of damage from a massive August 4 explosion in Beirut. Synthetic aperture radar data from space shows ground surface changes from before and after a major event like an earthquake. In this case, it is being used to show the devastating result of an explosion. 11)
- Maps like the one of Figure 13 can help identify badly damaged areas where people may need assistance. The explosion occurred near the city's port. It claimed more than 150 lives and is estimated to have caused billions of dollars' worth of damage.
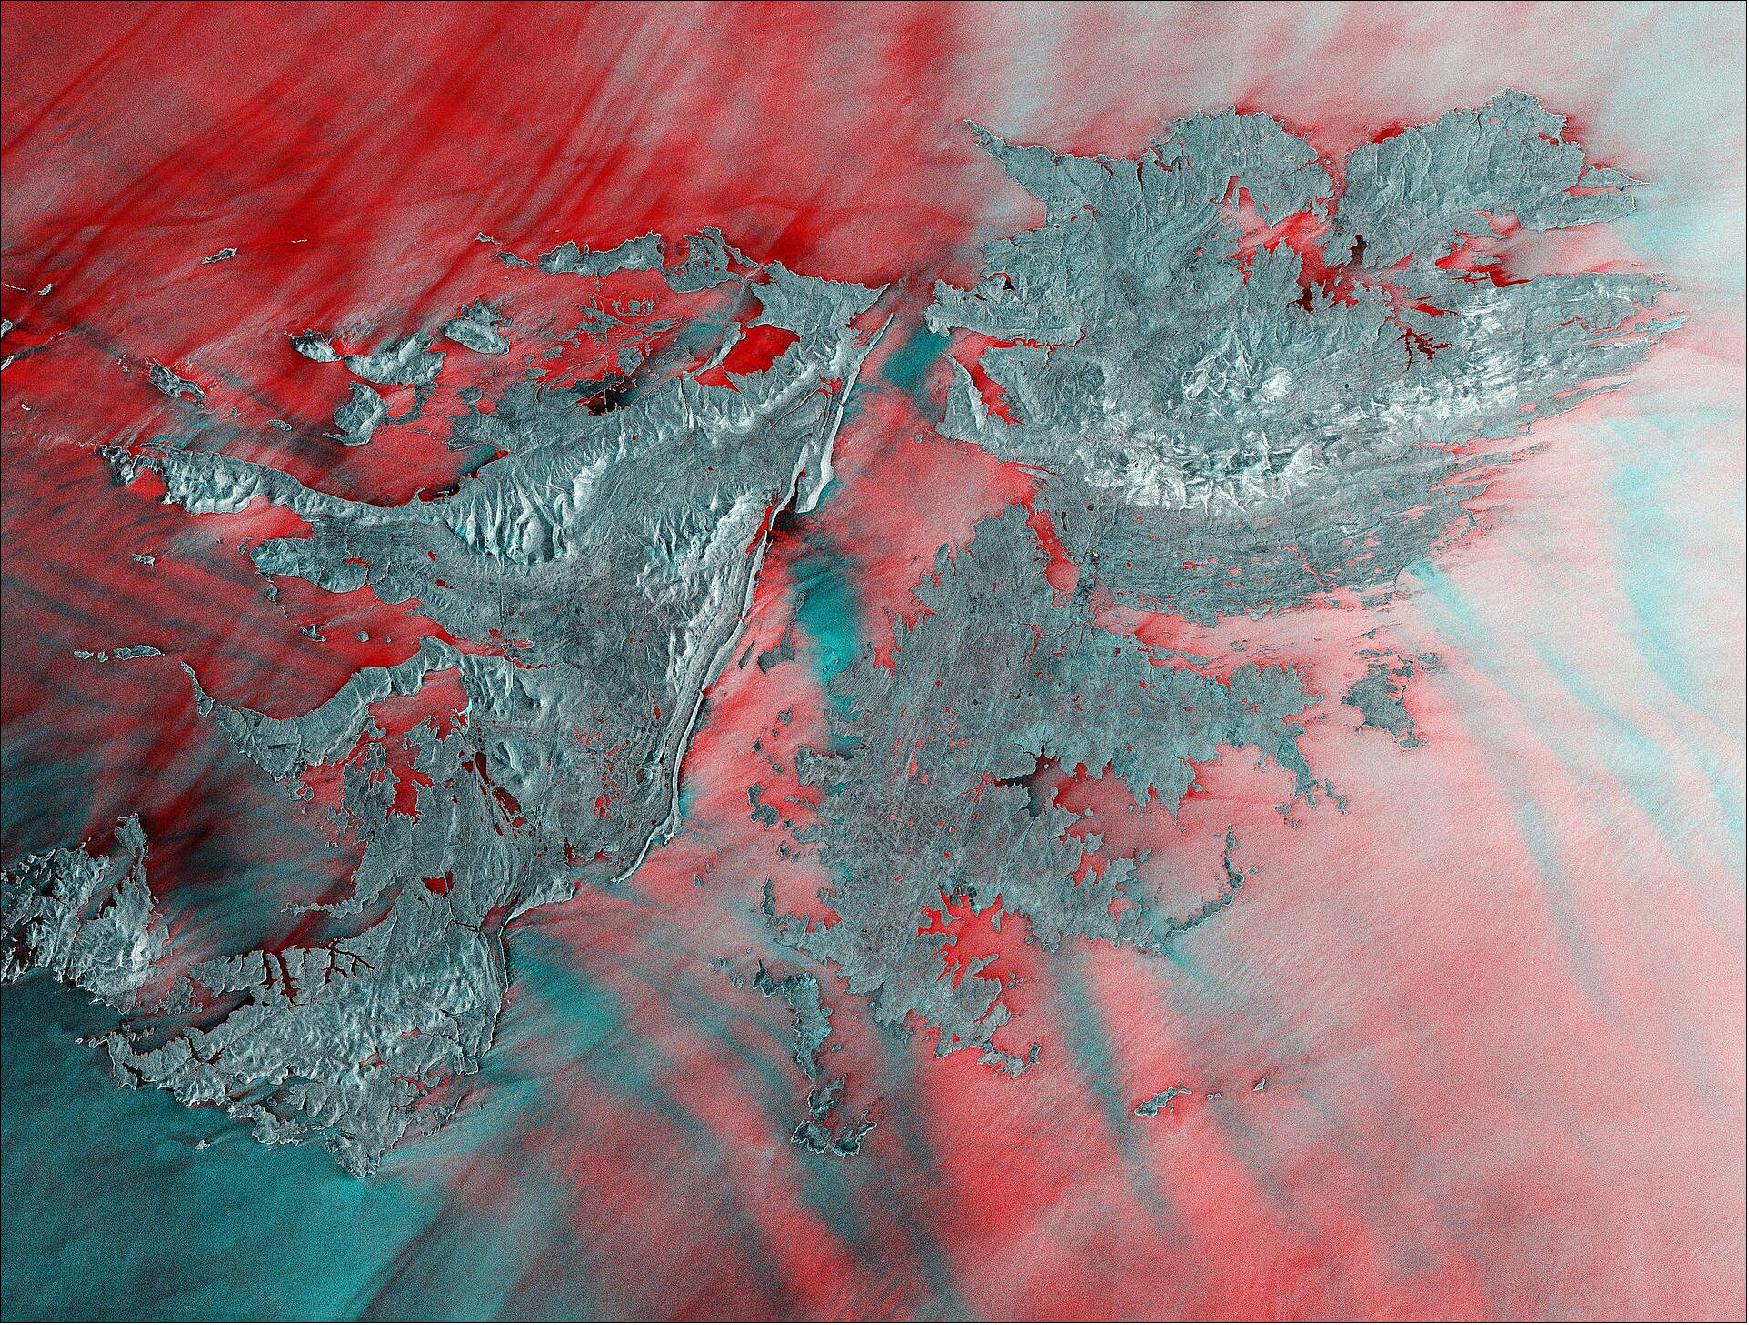
• July 24, 2020: The Falkland Islands are featured in this radar image captured by the Copernicus Sentinel-1 mission. The Falkland Islands lie in the South Atlantic Ocean, around 500 km northeast of the southern tip of South America. The Falklands comprise two main islands, West Falkland and East Falkland, as well as hundreds of other smaller islands and islets, which form a total land area approximately five times the size of Luxembourg. The two main islands are separated by the Falkland Sound, a channel that averages around 20 km in width. 12)
- The Copernicus Sentinel-1 mission provides a continuous sampling of the seas, offering information on wind and waves. This is useful for understanding interactions between waves and currents and to improve efficiency for shipping and wave-energy applications, potentially producing economic benefits.
- The landscape of the Falkland Islands comprises mountain ranges, flat plains, rugged coastline and cliffs. Hills run east-west across the northern parts of the two main islands, with the highest point being Mount Usborne on East Falkland (around 700 m). Two inlets, Berkeley Sound and Port William, visible in the far right of the image, run far into the land and provide anchorage for shipping. The majority of the population of the islands live in Stanley, on East Falkland.
- The islands are covered with grasslands, but not trees, which are widely used as pastureland for sheep and cattle. The islands are also an important habitat and breeding grounds for birds, penguins and seals.
• July 23, 2020: On the morning of 23 June 2020, a strong earthquake struck the southern state of Oaxaca, Mexico. The 7.4 magnitude earthquake prompted evacuations in the region, triggered a tsunami warning and damaged thousands of houses. Satellite radar data, from the Copernicus Sentinel-1 mission, are being used to analyze the effects of the earthquake on land. 13)
- Mexico is one of the world’s most seismically active regions, sitting on top of three of Earth’s largest tectonic plates – the North American, Cocos and Pacific. Near Mexico’s southern region, the North American plate collides with the Cocos plate, which is forced underground in a subduction zone. This geological process is associated with many of the damaging earthquakes on the Pacific coast of Mexico – including the most recent on 23 June.
- The earthquake reported in the Oaxaca region occurred at 10:29 local time – with its epicenter located around 12 km southwest of Santa María Zapotitlán. Several powerful aftershocks were registered the same day, with five more recorded in the following 24 hours.
- While there is currently no way to predict when earthquakes will occur, radar imagery from satellites allow for the effects of earthquakes to be observed. Since its launch, the Copernicus Sentinel-1 mission has proven a magnificent system to measure the surface deformation caused by tectonics, volcanic eruptions and land subsidence.
- In the maps of Figure 15, data from the Sentinel-1A and Sentinel-1B satellite, acquired shortly before and after the earthquake, have been combined to measure the coseismic surface displacement, or changes on the ground, that occurred between the two acquisition dates. This leads to the colorful interference (or fringe) pattern known as an ‘interferogram’, which enables scientists to quantify the surface displacement.
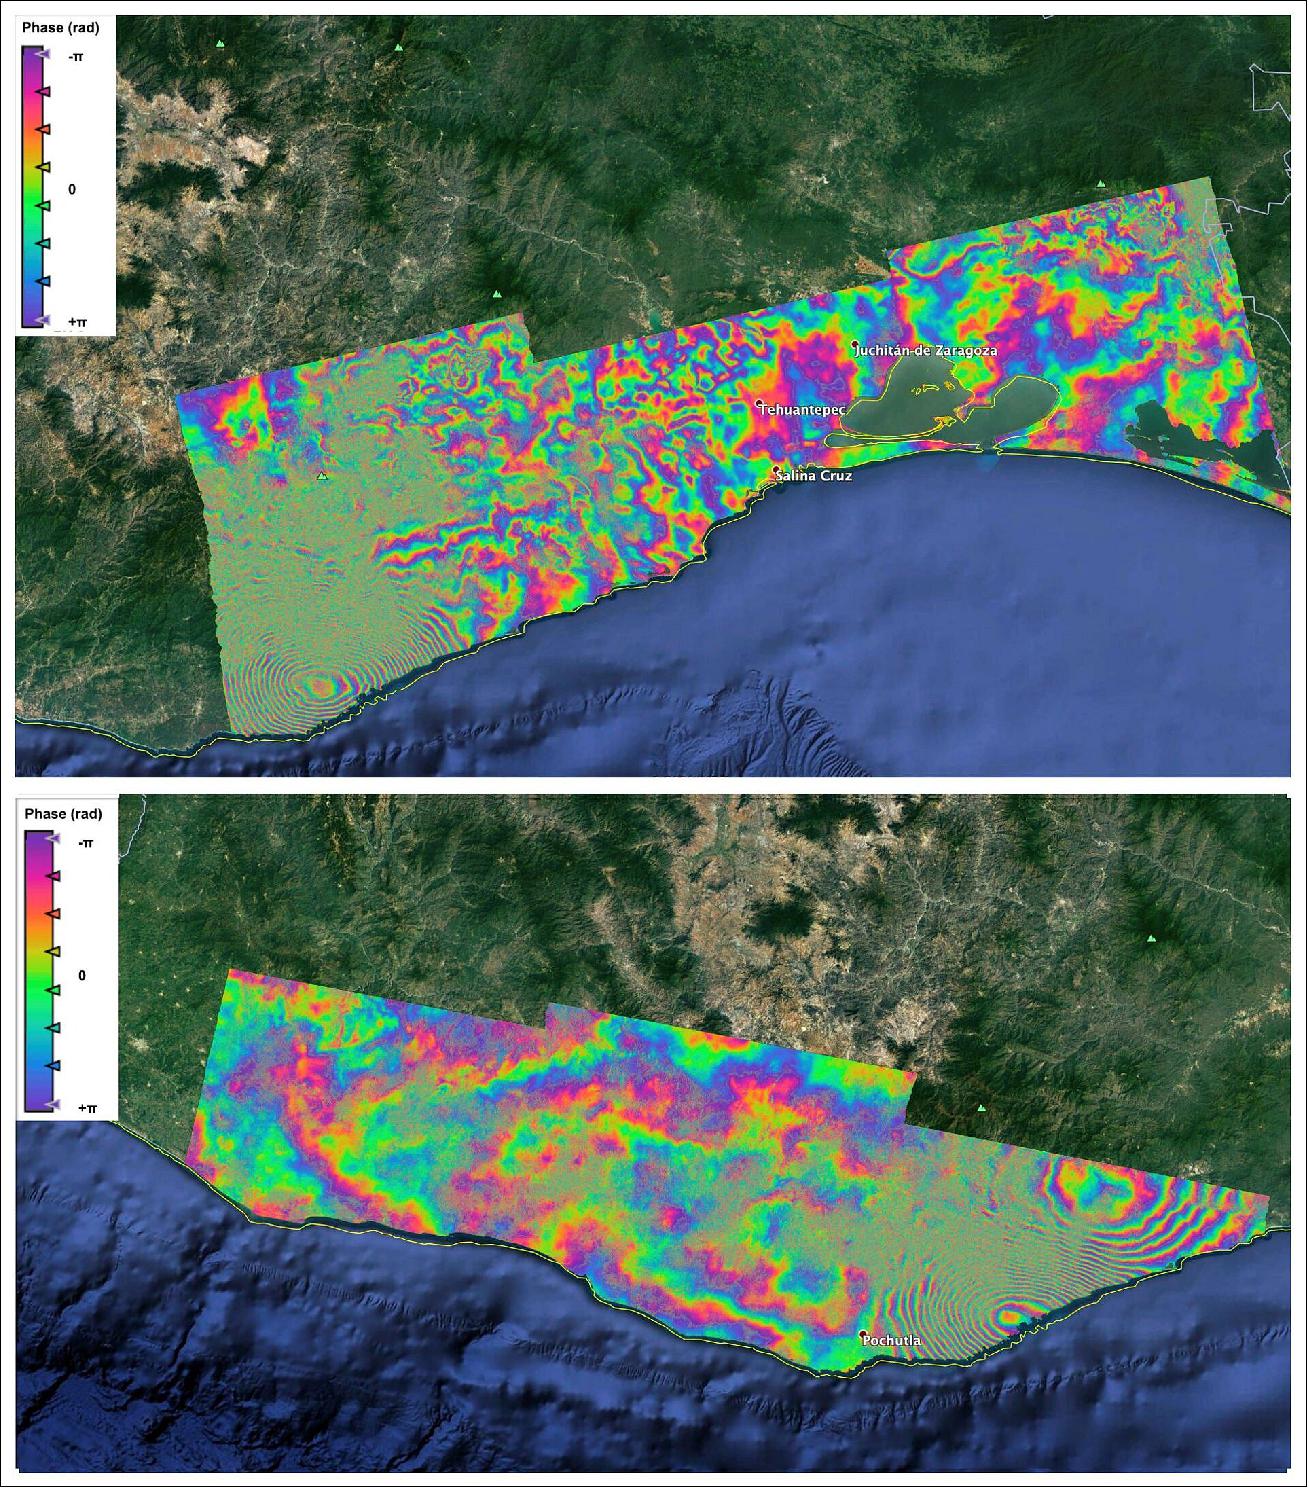
- Ramón Torres, Copernicus Sentinel-1 Project Manager, explains, “The interferogram represents surface displacement in the radar line of sight, i.e. half of the radar wavelength. The distance between the interference cycle, from yellow to yellow, corresponds to 28 mm deformation in the radar line of sight. For example, a blue-green-red color cycle represents a relative movement towards the radar, while a red-green-blue color cycle means a deformation away from the radar.”
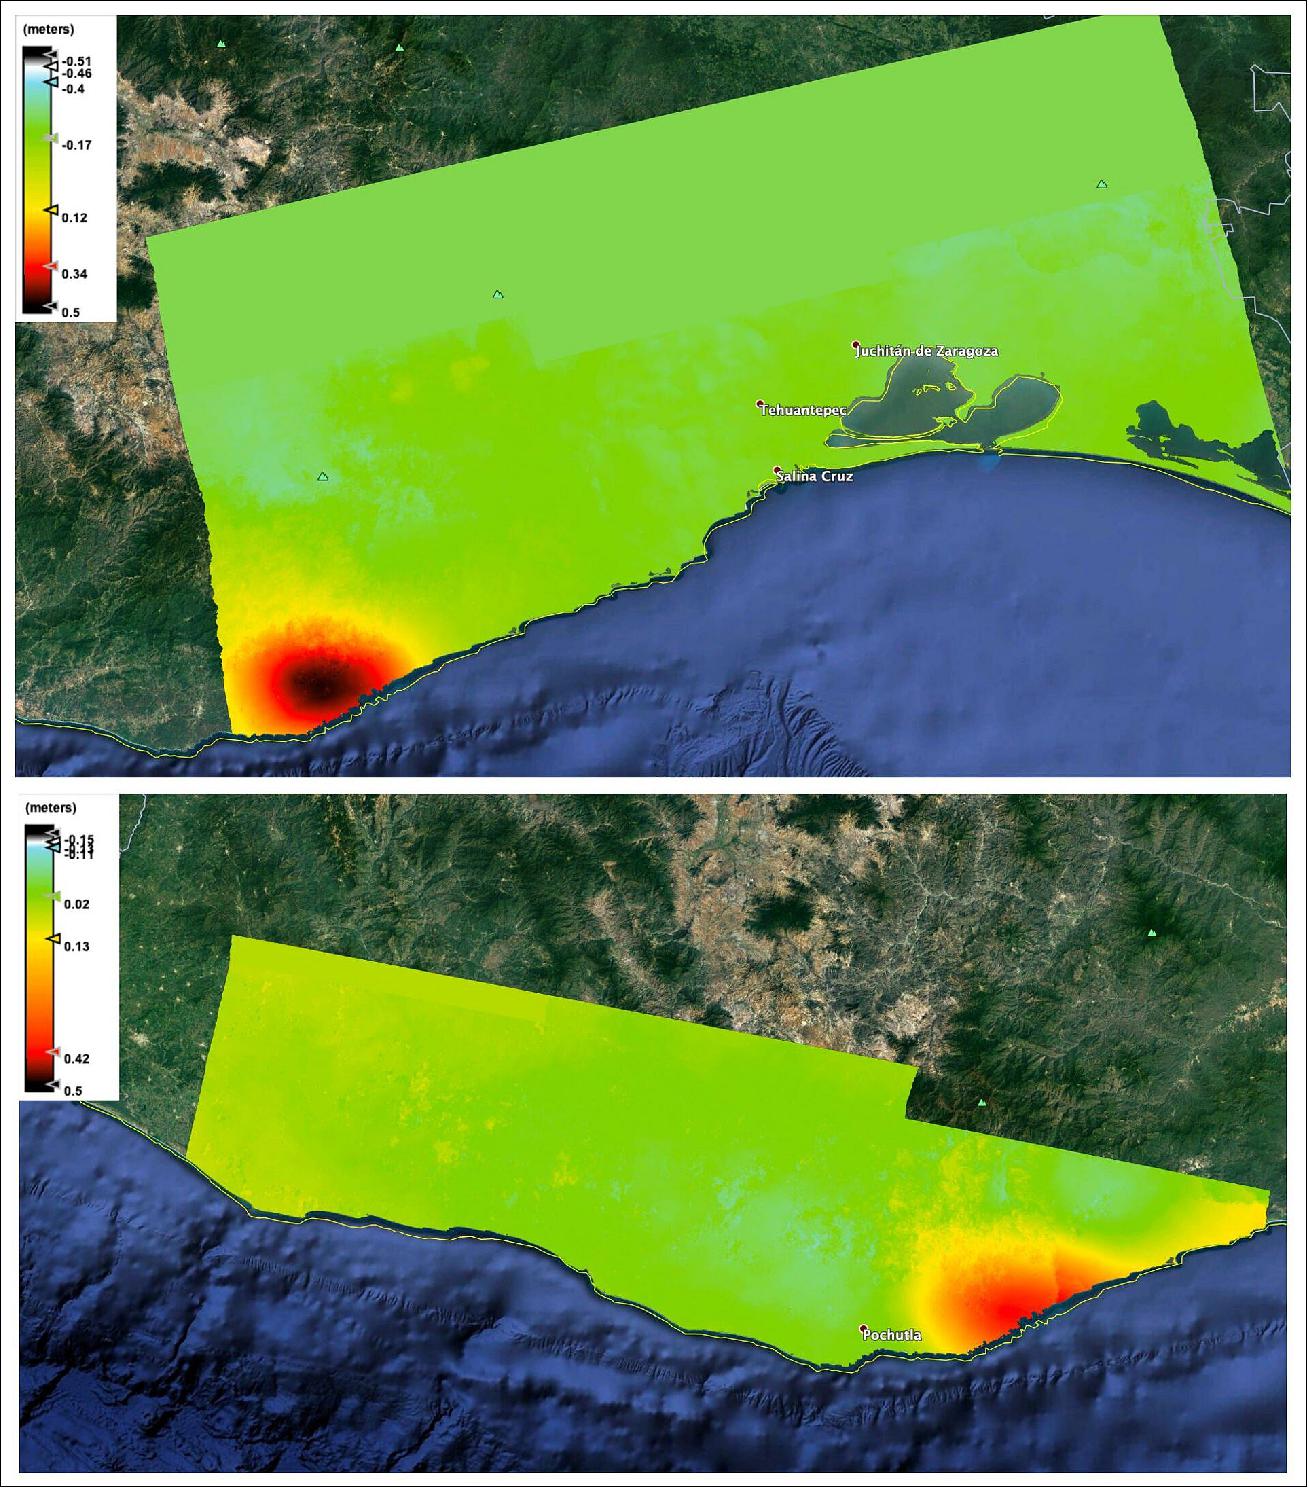
- “The fringes can be unwrapped to allow the conversion into meters. The result, referred to as the surface displacement map (Figure 16), shows the relative deformation caused by the earthquake.”
- In the Oaxaca images, ground deformation of up to 0.45 m was observed in the coastal city of La Crucecita – where the epicenter was located.
- With its 250 km-wide swath over land surfaces, the Copernicus Sentinel-1 mission gives scientists a broad view of the displacement, allowing them to examine the ground displacement and further develop the scientific knowledge of quakes.
- By benefitting from the availability of both Sentinel-1A and Sentinel-1B imagery, scientists are able to quantify the ground movement in both vertical and east-west directions by combing the radar scans obtained as the satellites flew both south to north and north to south.
- While current radar missions are limited in measuring the east-west component of surface displacement, the proposed Earth Explorer candidate mission, Harmony, will augment the capabilities by adding additional ‘lines of sight’ to the Sentinel-1 mission.
- In areas where the displacement is predominantly in the north-south direction, Harmony will have the ability to systematically and accurately measure an additional dimension of displacement. This will help resolve ambiguities in the underlying geophysical processes that lead to earthquakes, landslides and volcanism.
- Looking to the future, the upcoming six high-priority candidate missions will expand the current capabilities of the Sentinel missions, one of them being the L-band Synthetic Aperture Radar, ROSE-L, mission, which will also augment the current capabilities of Sentinel-1. The mission will allow scientists to further improve the mapping of earthquakes over the next decade.
- Ramón Torres says, “The Sentinel-1 services are very well guaranteed for decades to come. The upcoming Sentinel-1C and Sentinel-1D are in the process of being completed, and the design of the next generation of satellites will begin later this year.”
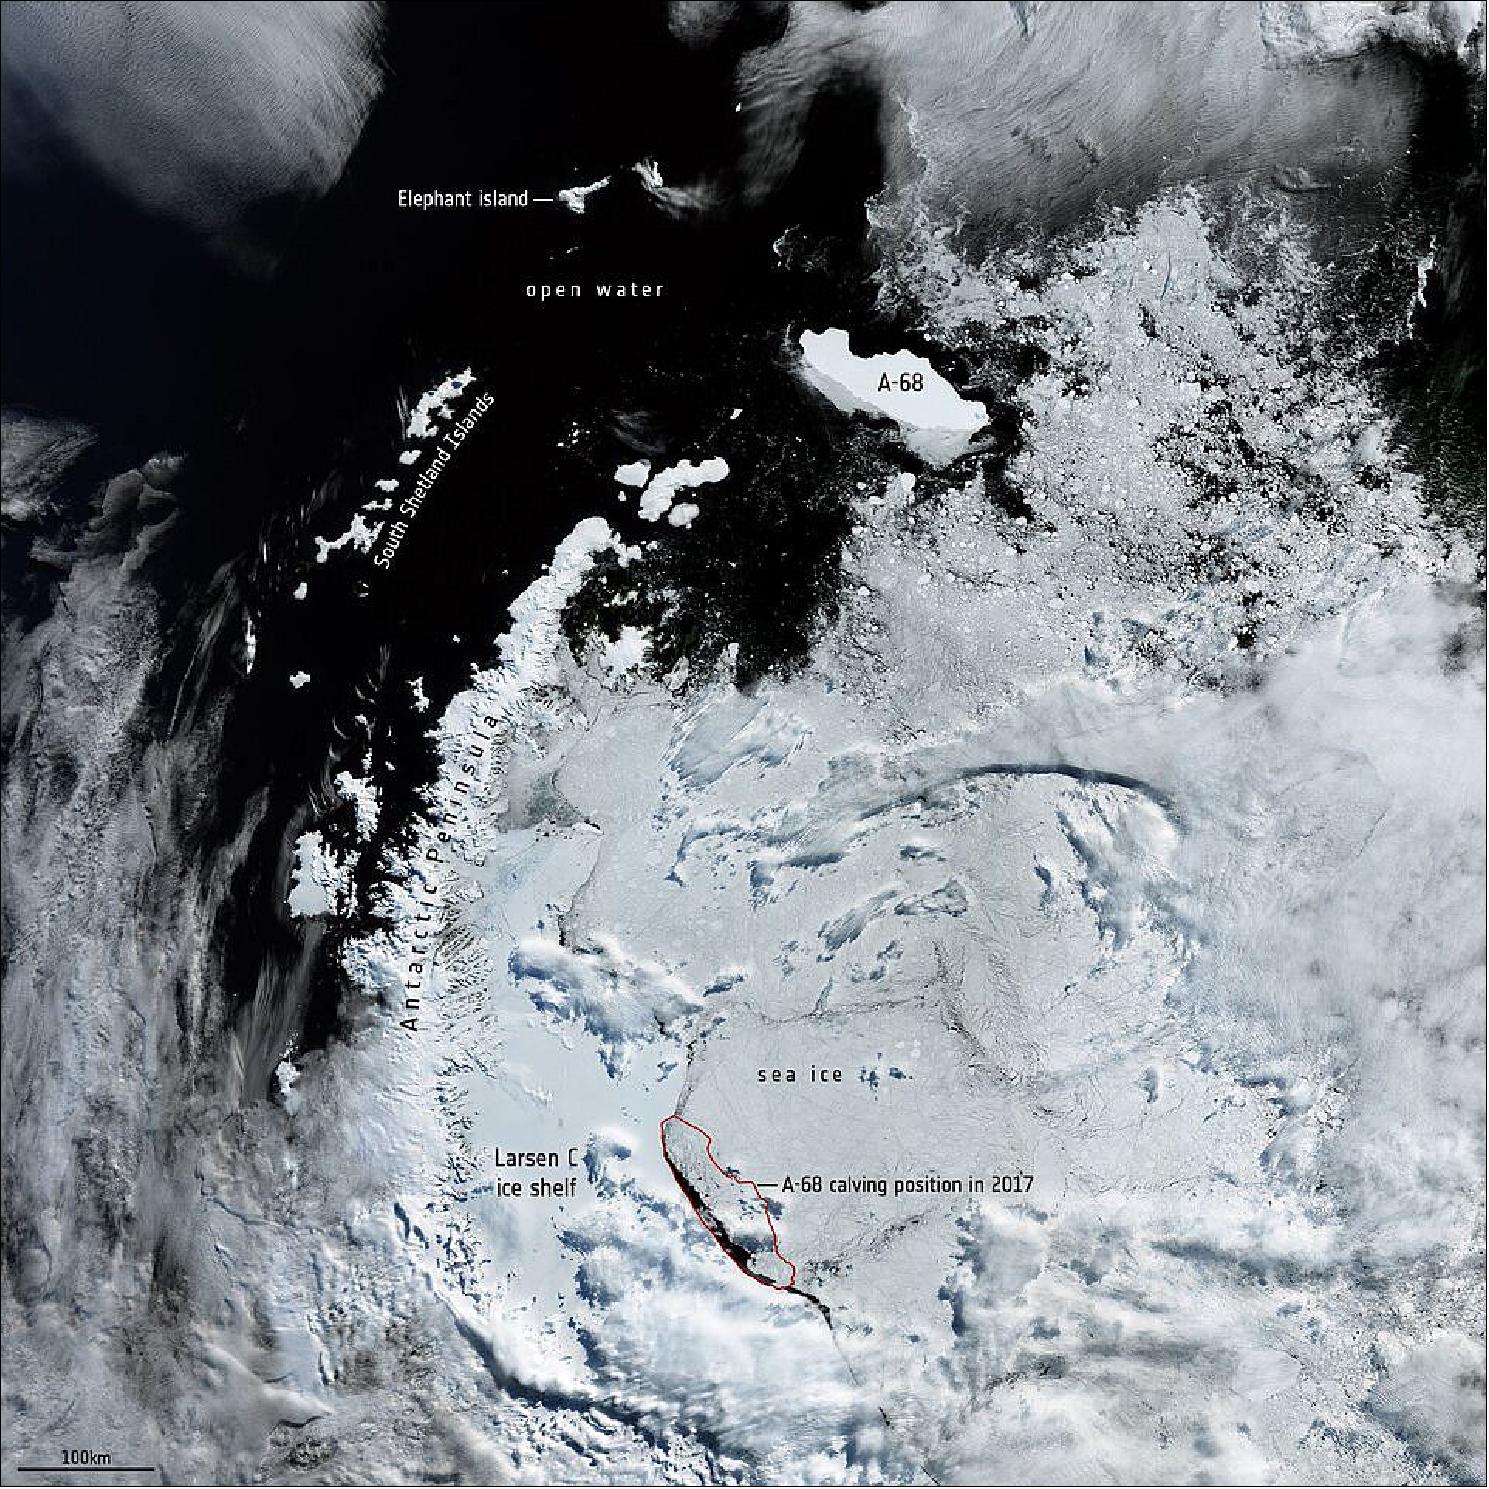
• July 10, 2020: The colossus iceberg that split from Antarctica’s Larsen C ice shelf on 12 July 2017 is now in the open waters of the South Atlantic near the South Orkney Islands, about 1050 km from its birthplace. Having lost two chunks of ice, this record berg is a little less huge than it once was – and now that it is in rougher waters, it may break up further. 14)
- When it calved, A-68 was about twice the size of Luxemburg and one of the largest icebergs on record, changing the outline of the Antarctic Peninsula forever. Despite its size, however, it is remarkably thin, just a couple of hundred meters thick.
- Over the last three years, satellite missions such as Copernicus Sentinel-1 have been used to track the berg as it drifted in the Southern Ocean. For the first two years, it remained close to its parent ice sheet, impeded by sea ice.
- However, it lost a chunk of ice almost immediately after being calved, resulting in it being renamed A-68A, and its offspring became A-68B. More recently, in April 2020, A-68A lost another chunk: A-68C.
- Rather unromantically, Antarctic icebergs are named from the Antarctic quadrant in which they were originally sighted, then a sequential number, then, if the iceberg breaks, a sequential letter.
- Although A-68A is a relatively thin iceberg, it has held together reasonably well, but satellites will be key to monitoring how it changes in open waters.
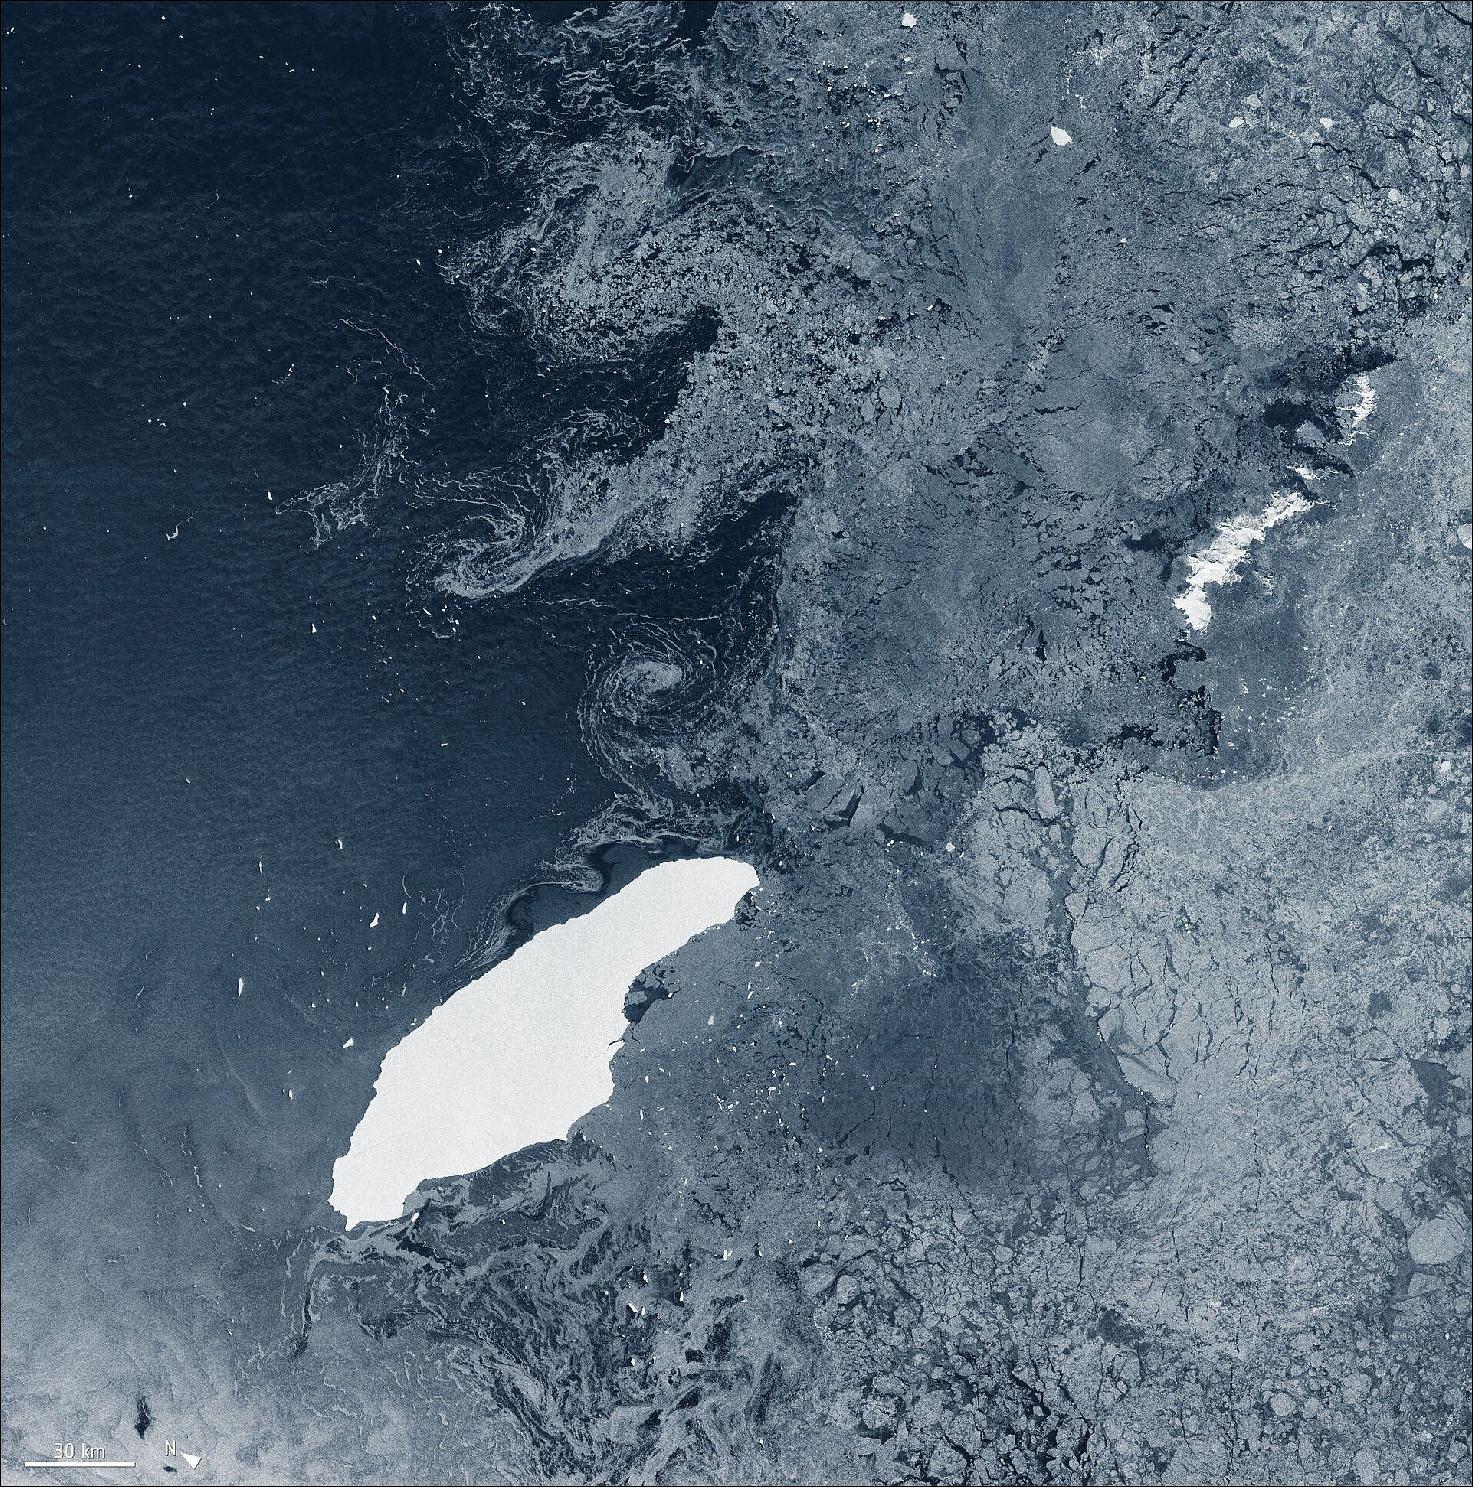
- Captured by the Copernicus Sentinel-1 radar mission, the image of Figure 17 shows the berg on 5 July 2020, a few days before its third birthday. Satellites carrying radar continue to deliver images regardless of the dark and bad weather, which is indispensable when monitoring the remote polar regions which are shrouded in darkness during the winter months.
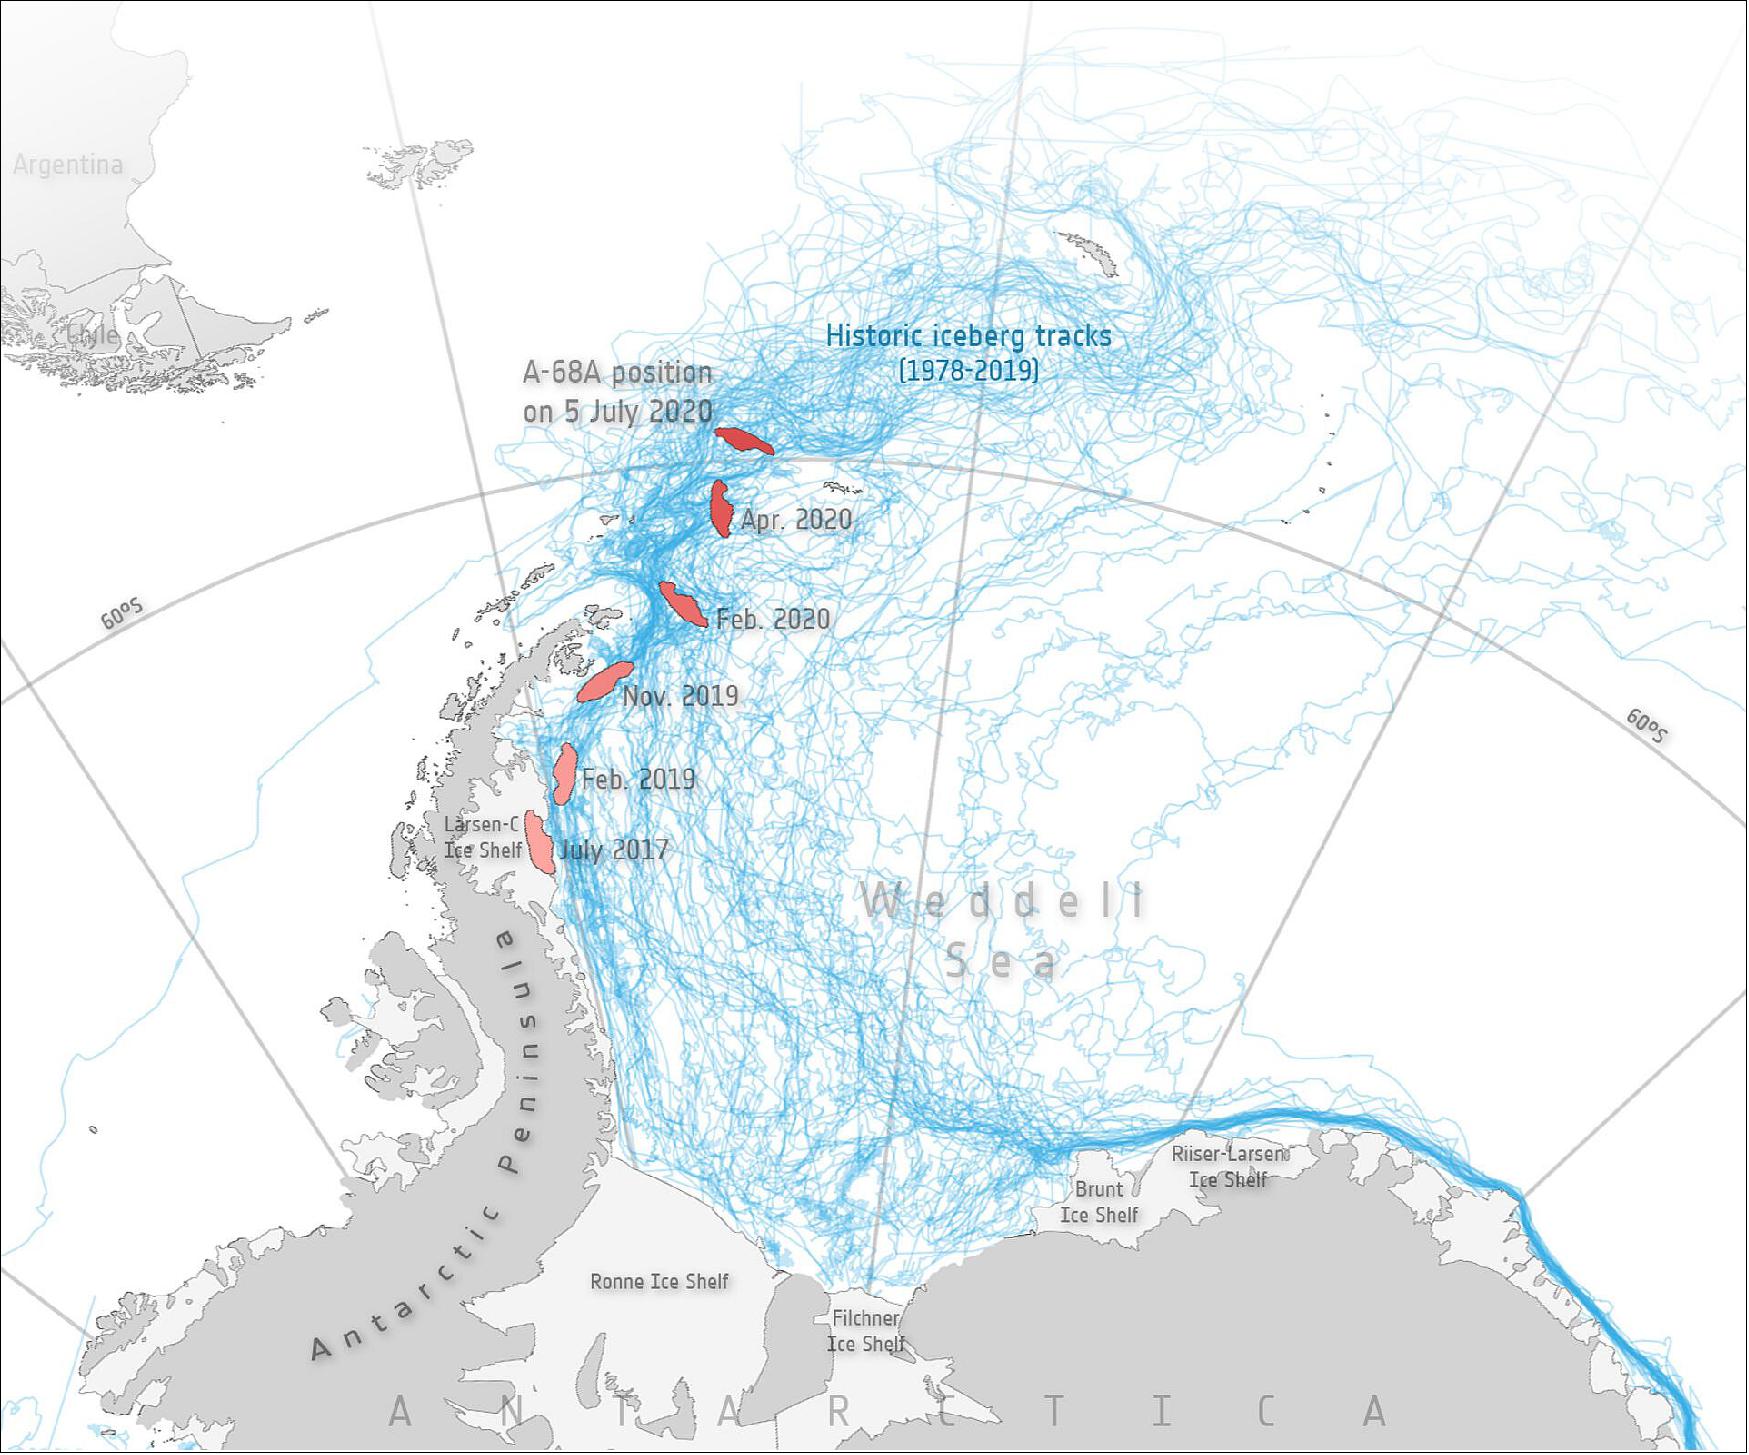
- The map (Figure 18) shows the different positions of A-68A during its three-year journey. The map not only highlights how long it remained close to the Larsen C ice sheet, but how, over the last year or so, its pace of drift has increased considerably.
- The wider-view image of Figure 19 from the Copernicus Sentinel-3 mission shows A-68A’s position in February 2020.
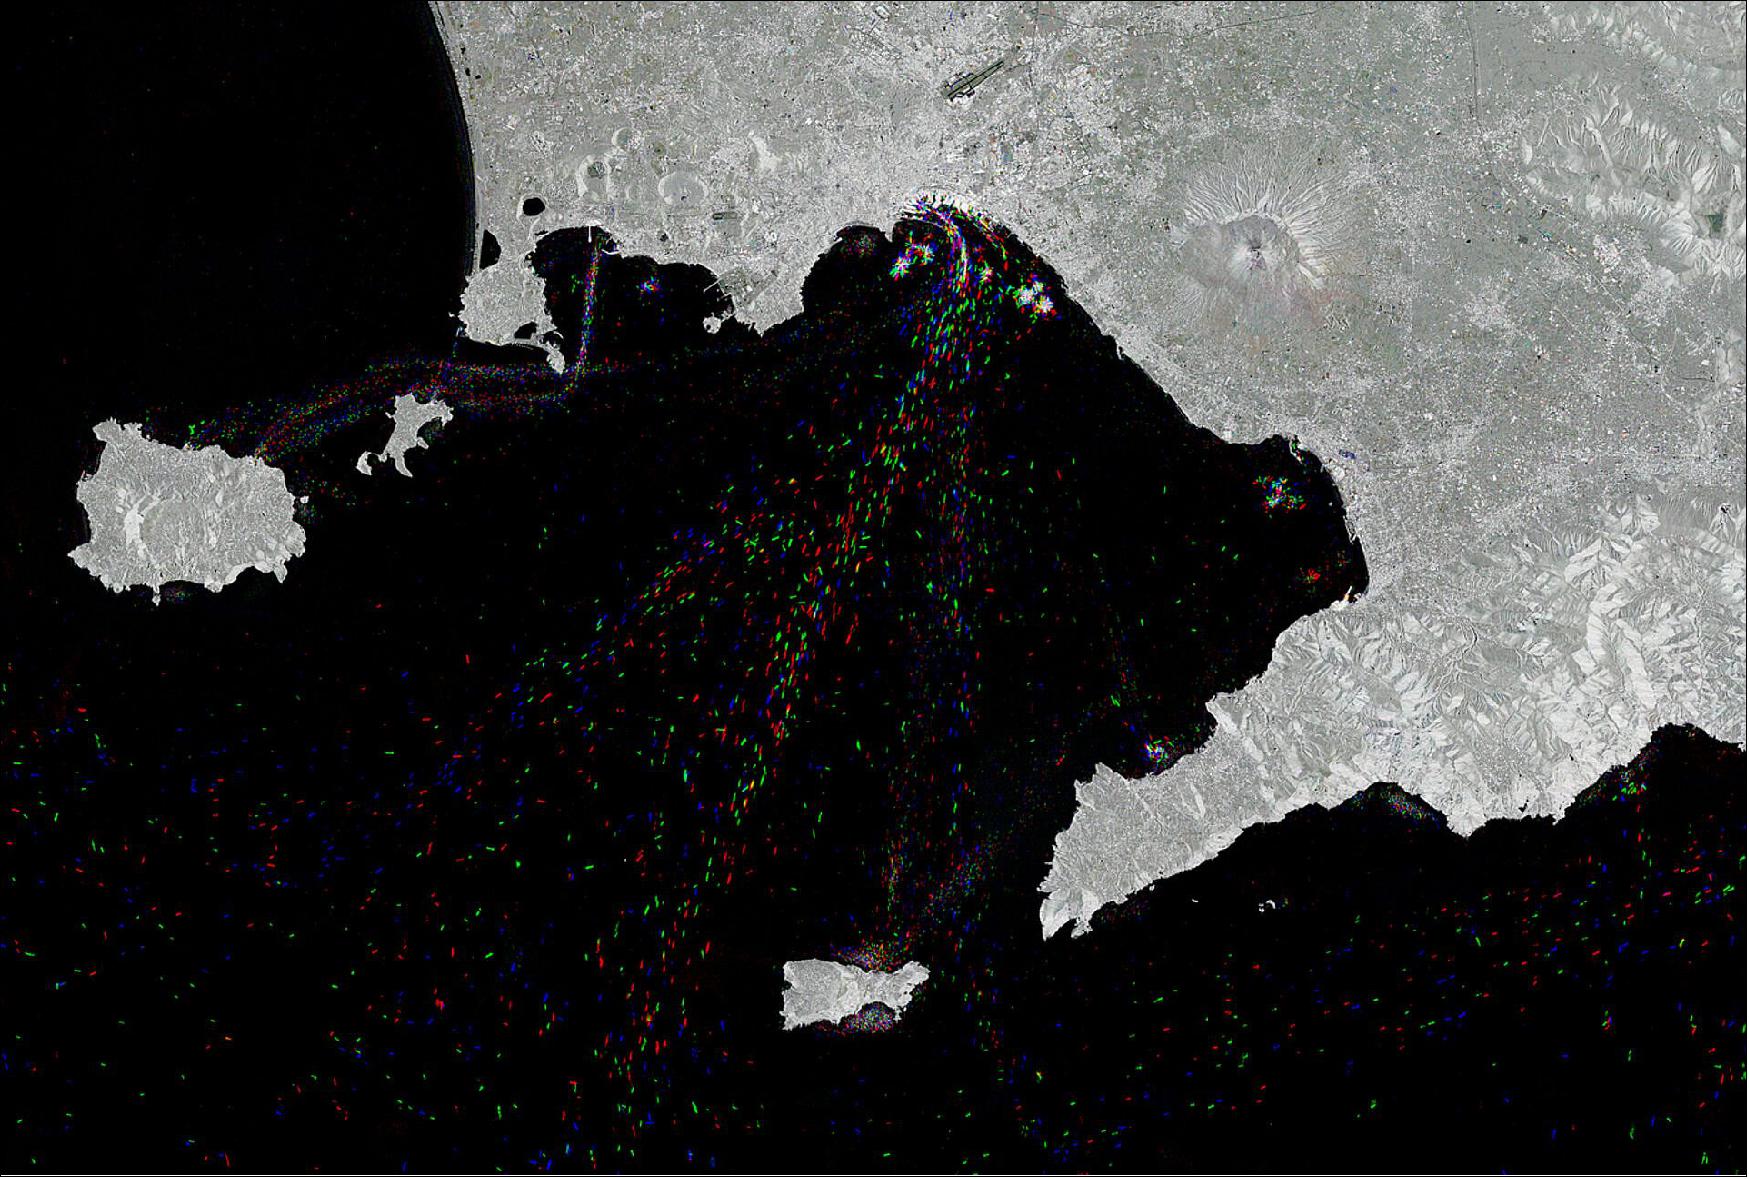
• July 10, 2020: The Copernicus Sentinel-1 mission takes us over the busy maritime traffic in the Bay of Naples, in southern Italy. 15)
- The two identical Copernicus Sentinel-1 satellites carry radar instruments to provide an all-weather, day-and-night supply of imagery of Earth’s surface. Here, three years of Sentinel-1 data over the same area, equal to hundreds of images, have been compressed into a single image.
- Many large vessels depart from the Port of Naples, one of the largest Italian seaports visible in the top-center of the image. From here, and the smaller Port of Pozzuoli in the left of the image, small leisure boats and ferries set sail to the nearby islands. Ischia, renowned for its thermal springs, and Procida are visible in the left of the image, in front of Pozzuoli, while the beautiful island of Capri is visible further south.
- Numerous boats are anchored off the island of Capri in the bottom center of the image. The island lies opposite the Sorrento peninsula, to which it was joined in prehistoric times. Two indentations can be seen in its cliff-lined coast: the Marina Grande on the north shore and the Marina Piccola on the south shore.
- Other vessels are docked off the coast of Sorrento, as well as off of the Amalfi coast in the right of the image.
- The Bay of Naples is famous for its scenic beauty, including the steep, volcanic hills surrounding it. The still-active Mount Vesuvius can be seen just inland from the bay, as a circular shape. Cities, such as Naples, as well as the other surrounding towns, are visible in white owing to the strong reflection of the radar signal.
• April 30, 2020: The notion that rain could lead to a volcanic eruption may seem strange, but scientists from the University of Miami in the USA, have used information from satellites, including the Copernicus Sentinel-1 mission, to discover that a period of heavy rainfall may have triggered the four month-long eruption of Hawaii’s Kilauea volcano in 2018. 16)
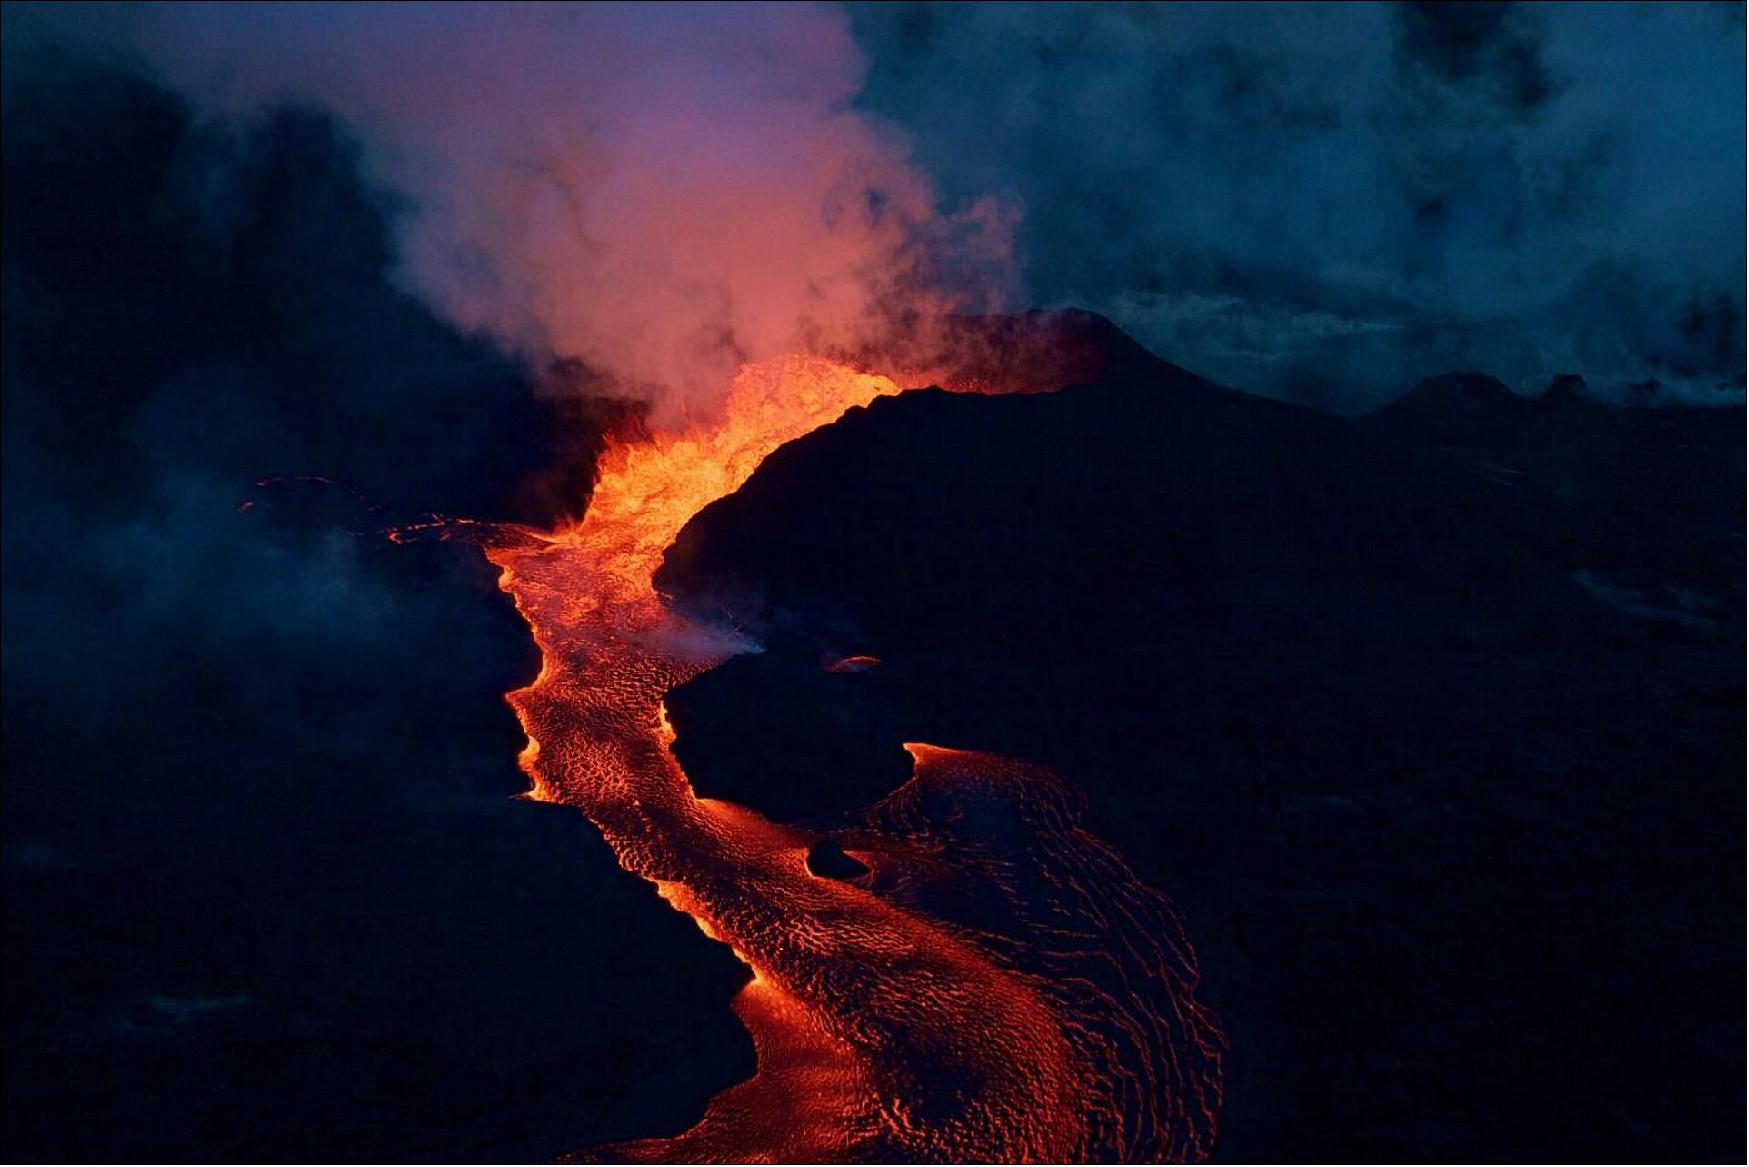
- Producing about 320,000 Olympic-sized swimming pools’ worth of lava that reshaped the landscape, destroyed hundreds of homes and caused the collapse of the summit caldera, the 2018 eruption was one of the most destructive in Kilauea’s recorded history.
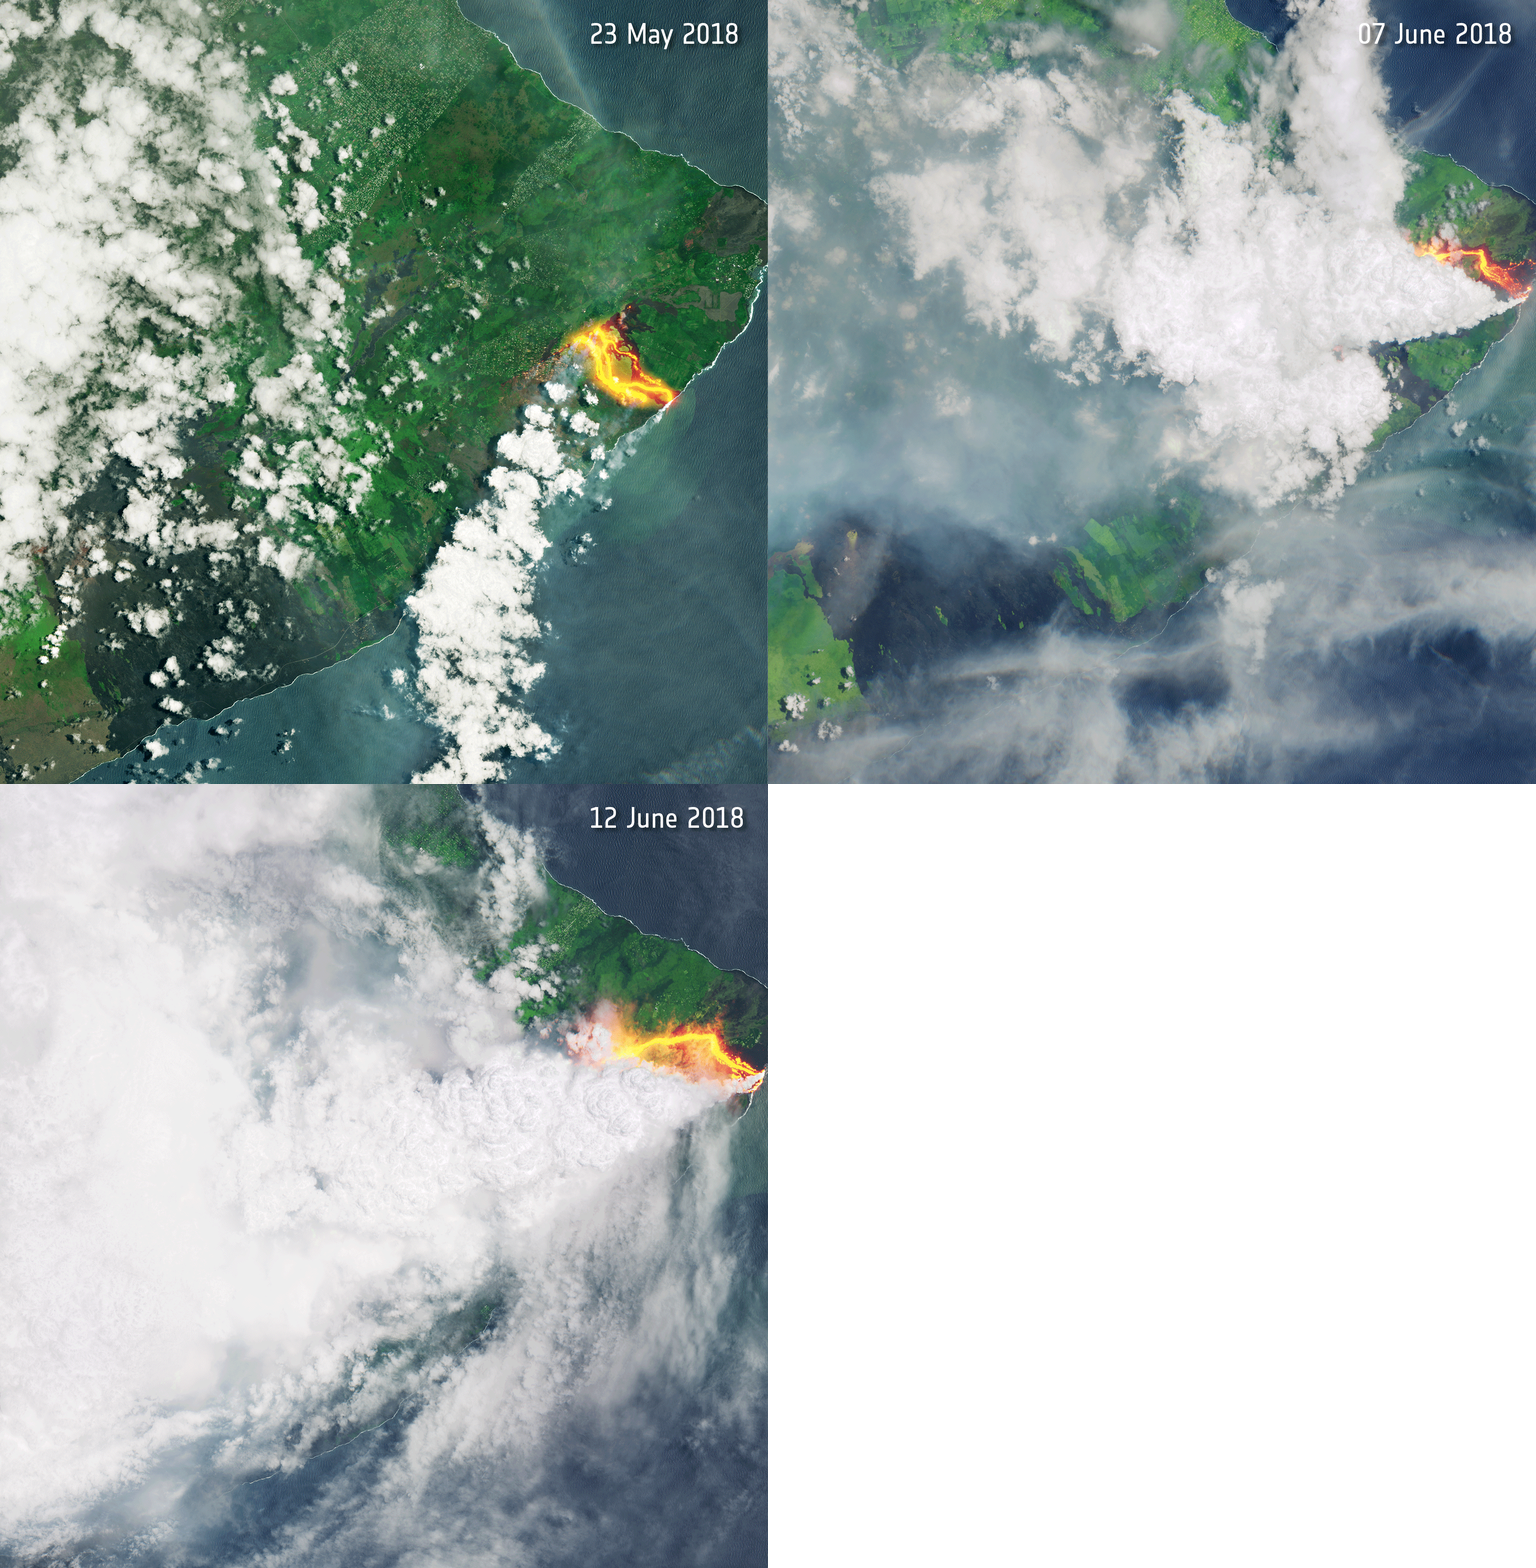
- A paper published recently in Nature proposes a new model to explain why this eruption happened. The authors, Jamie Farquharson and Falk Amelung from the University of Miami’s Rosenstiel School of Marine & Atmospheric Science, suggest that heavy rainfall may have been the culprit. 17)
- In the months before the eruption, Hawaii was inundated by an unusually prolonged period of heavy, and at times extreme, rainfall.
- The rainwater would have found its way through the pores of the volcanic rock and increased the pressure within – decreasing the rigidity of the rock and allowing magma to rise to the surface.
- Falk Amelung said, “We knew that changes in the water content in the Earth's subsurface can trigger earthquakes and landslides. Now we know that it can also trigger volcanic eruptions. Under pressure from magma, wet rock breaks easier than dry rock. It is as simple as that.”
- Using a combination of ground-based and satellite measurements of rainfall, Farquharson and Amelung modelled the fluid pressure within the volcano's edifice over time – a factor that can directly influence the tendency for mechanical failure in the ground, ultimately driving volcanic activity.
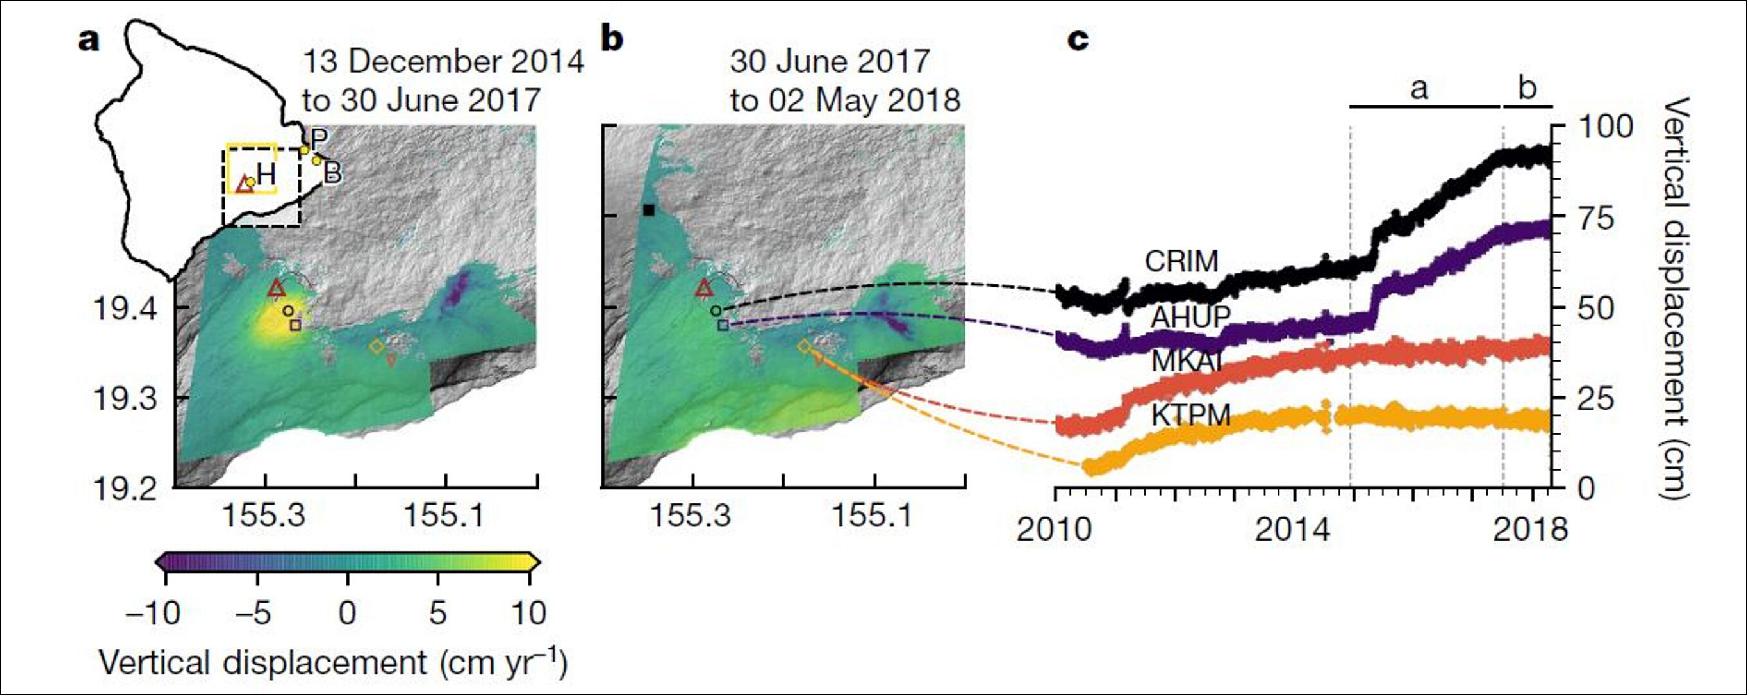
- This is not an entirely new theory, but it was previously thought that this could only happen at shallow depths. Here, the scientists conclude that the rain increased pore pressure deep down – at depths of up to 3 km.
- The team’s results highlight that fluid pressure was at its highest in almost half a century immediately prior to the eruption, which they propose facilitated magma movement beneath the volcano. Their hypothesis also explains why there was relatively little widespread uplift around the volcano in the months prior.
- “We would normally see the ground inflate, or ‘uplift’ before an eruption as the magma chamber swells. We used radar information from the Copernicus Sentinel-1 mission to see that the amount of inflation was low.
- “This lack of substantial inflation suggests that the intrusion–eruption could not only have been triggered by an influx of fresh magma from depth, but that it was caused by a weakening of the rift zone. The six-day repeat observations from the Sentinel-1 mission were key to our research.
- “A fact that must be considered when assessing volcanic hazards is that increasing extreme weather patterns associated with ongoing anthropogenic climate change could also increase the potential for rainfall-triggered volcanic activity.”
- The Copernicus Sentinel-1 mission is a constellation of two identical radar satellites offering the capability to monitor ground deformation with the technique of interferometry. The constellation provides the capability to image part of the globe in the same geometry every six days – a repeat that is ensured for the Group on Earth Observation’s Geohazard Supersites, to which Hawaii islands belong.
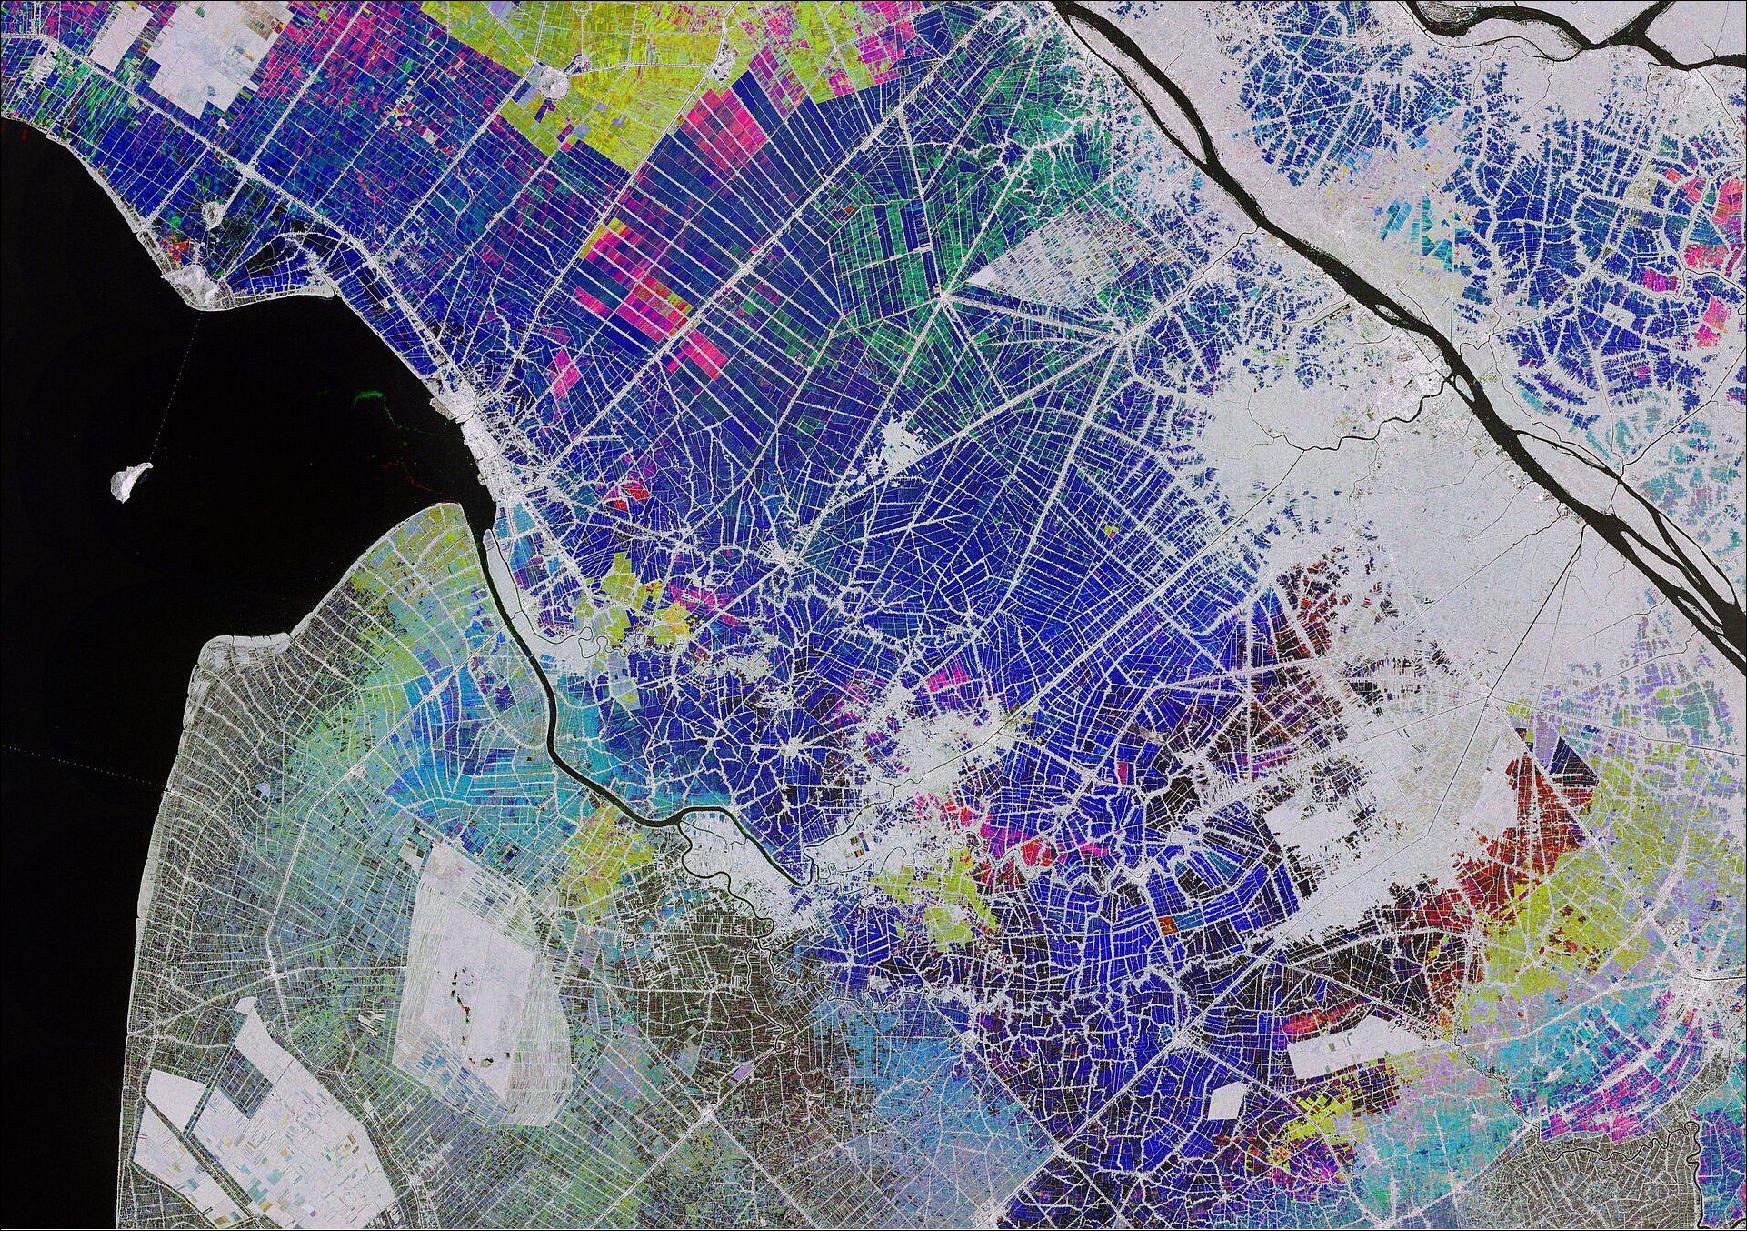
• March 27, 2020: The Copernicus Sentinel-1 mission takes us over part of the Mekong Delta – a major rice-producing region in southwest Vietnam. 18)
- In Vietnam, rice has been a strategic crop for national food security. Vietnam is the fifth largest producer of rice in the world, the majority of which is grown in the Mekong Delta – a vast flood plain and one of Asia’s most fertile agricultural zones.
- Such an enormous amount of rice is produced in the Mekong Delta that it is often referred to as Vietnam's 'rice bowl'. The rice grown here produces enough to make Vietnam the world's third biggest rice exporter – after India and Thailand.
- Bodies of water reflect the radar signal away from the satellite, making water appear dark. This can be seen in the Bassac River, also known as the Hau river, in the right of the image. Ships in the river can be seen as bright, multi-colored dots.
- The combination of radar images from the Copernicus Sentinel-1 mission can help monitor and map the evolution of rice cultivation. Radar sensors are particularly useful owing to their ability to detect waterlogged ground and penetrate the humid cloud coverage typical of Asian rice-cultivating regions.
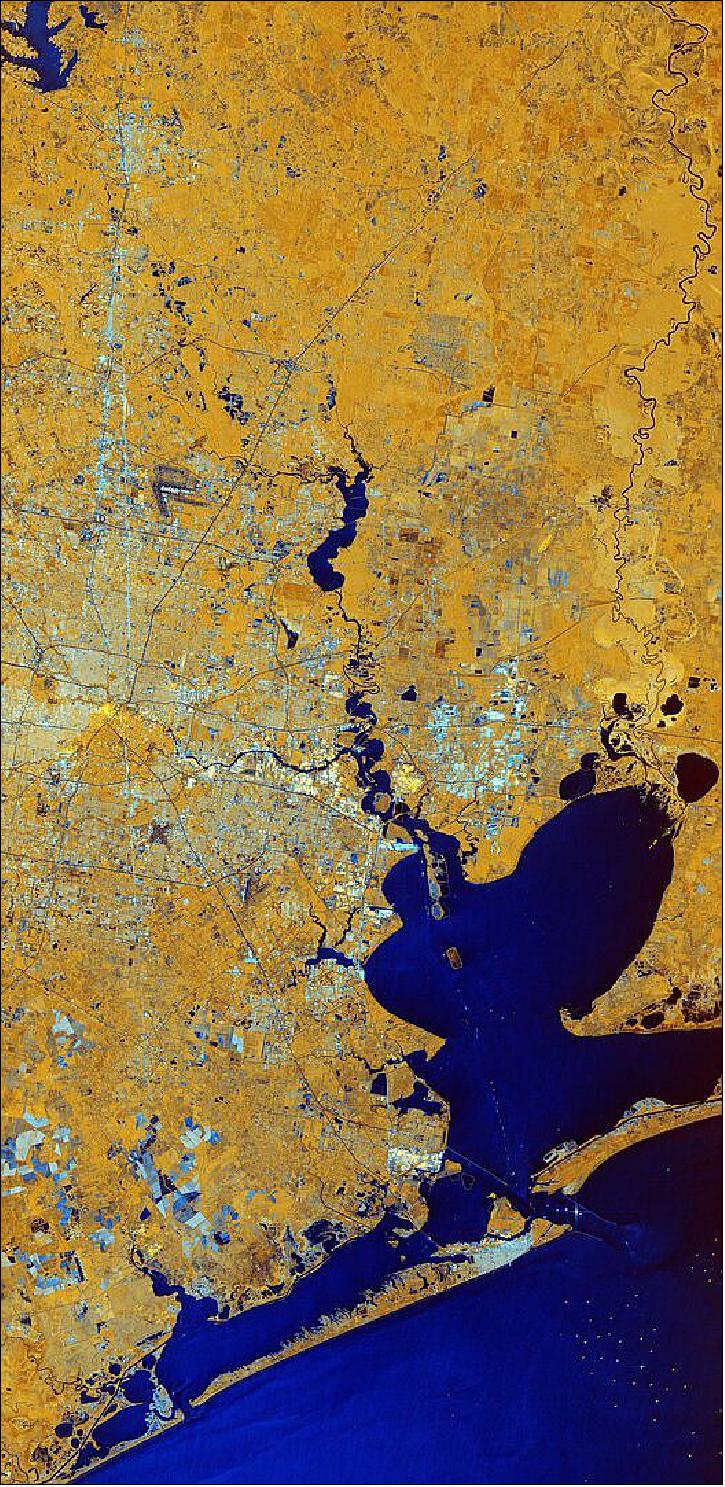
• February 21, 2020: In this week's edition of the Earth from Space program, the Copernicus Sentinel-1 mission takes us over Houston, the most populous city in Texas and the fourth largest in the US. 19)
- The two identical Copernicus Sentinel-1 satellites carry radar instruments to image Earth’s surface. Images acquired with radar are interpreted by studying the intensity of the signal scattered back to the satellite – which is related to the roughness of the ground.
- The colors of this week’s image come from the combination of two polarizations from the Copernicus Sentinel-1 radar mission, which have been converted into a single RGB image (Figure 26). Interpreting polarization can help scientists analyze Earth’s surface.
- With a population of over two million and covering an area of over 1600 km2, Houston is the state’s most populous city and the fourth largest city in the US.
- Houston is dissected by a series of bayous passing. Buffalo Bayou can be seen cutting through Houston, before joining Galveston Bay visible at the bottom of the image. Galveston Bay is around 55 km long and around 30 km wide, making it the largest estuary in Texas. The shallow bay has an average depth of around 2 m, which is unusually shallow for its size.
- The Port of Houston, which spreads across the northwest section of the bay, is one of the world’s largest ports, and many ships can be seen as multi colored dots in the bottom-right of the image.
- Houston is home to the NASA Lyndon B. Johnson Space Center (JSC), which lies west of Galveston Bay. The center acts as NASA’s lead center for astronaut training as well as the International Space Station mission operations. It was identified as mission control or simply ‘Houston’ during the Apollo, Gemini and Space Shuttle flights.
- The center also collaborates with other international facilities in a variety of scientific and engineering programs related to human space flight and planetary exploration. The Johnson Space Center is where many ESA astronauts are sent as part of their training and preparation for future space missions. This is where Luca Parmitano, who recently returned to Earth, trained for his Beyond mission to the International Space Station.
• February 11, 2020: As anticipated, Pine Island Glacier, known as PIG for short, in Antarctica has just spawned a huge iceberg. At over 300 sq km, about the size of Malta, this huge berg very quickly broke into many ‘piglet’ pieces the largest of which is dubbed B-49. 20)
- Pine Island Glacier, along with its neighbor Thwaites Glacier, connect the center of the West Antarctic Ice Sheet with the ocean – together discharging significant quantities of ice into the ocean. These two glaciers have been losing ice over the last 25 years. Owing to their extremely remote location, satellites play a critical role in measuring and monitoring Antarctic glaciology – revealing the timing and pace of glacial retreat in Antarctica. Since the early 1990s, the Pine Island Glacier’s ice velocity has increased dramatically to values which exceed 10 m a day. Its floating ice front, which has an average thickness of approximately 500 meters, has experienced a series of calving events over the past 30 years, some of which have abruptly changed the shape and position of the ice front.
- These changes have been mapped by ESA-built satellites since the 1990s, with calving events occurring in 1992, 1995, 2001, 2007, 2011, 2013, 2015, 2017, 2018, and now 2020.
- Mark Drinkwater, senior scientist and cryosphere specialist remarked, “The Copernicus twin Sentinel-1 all-weather satellites have established a porthole through which the public can watch events like this unfold in remote regions around the world. What is unsettling is that the daily data stream reveals the dramatic pace at which climate is redefining the face of Antarctica.”
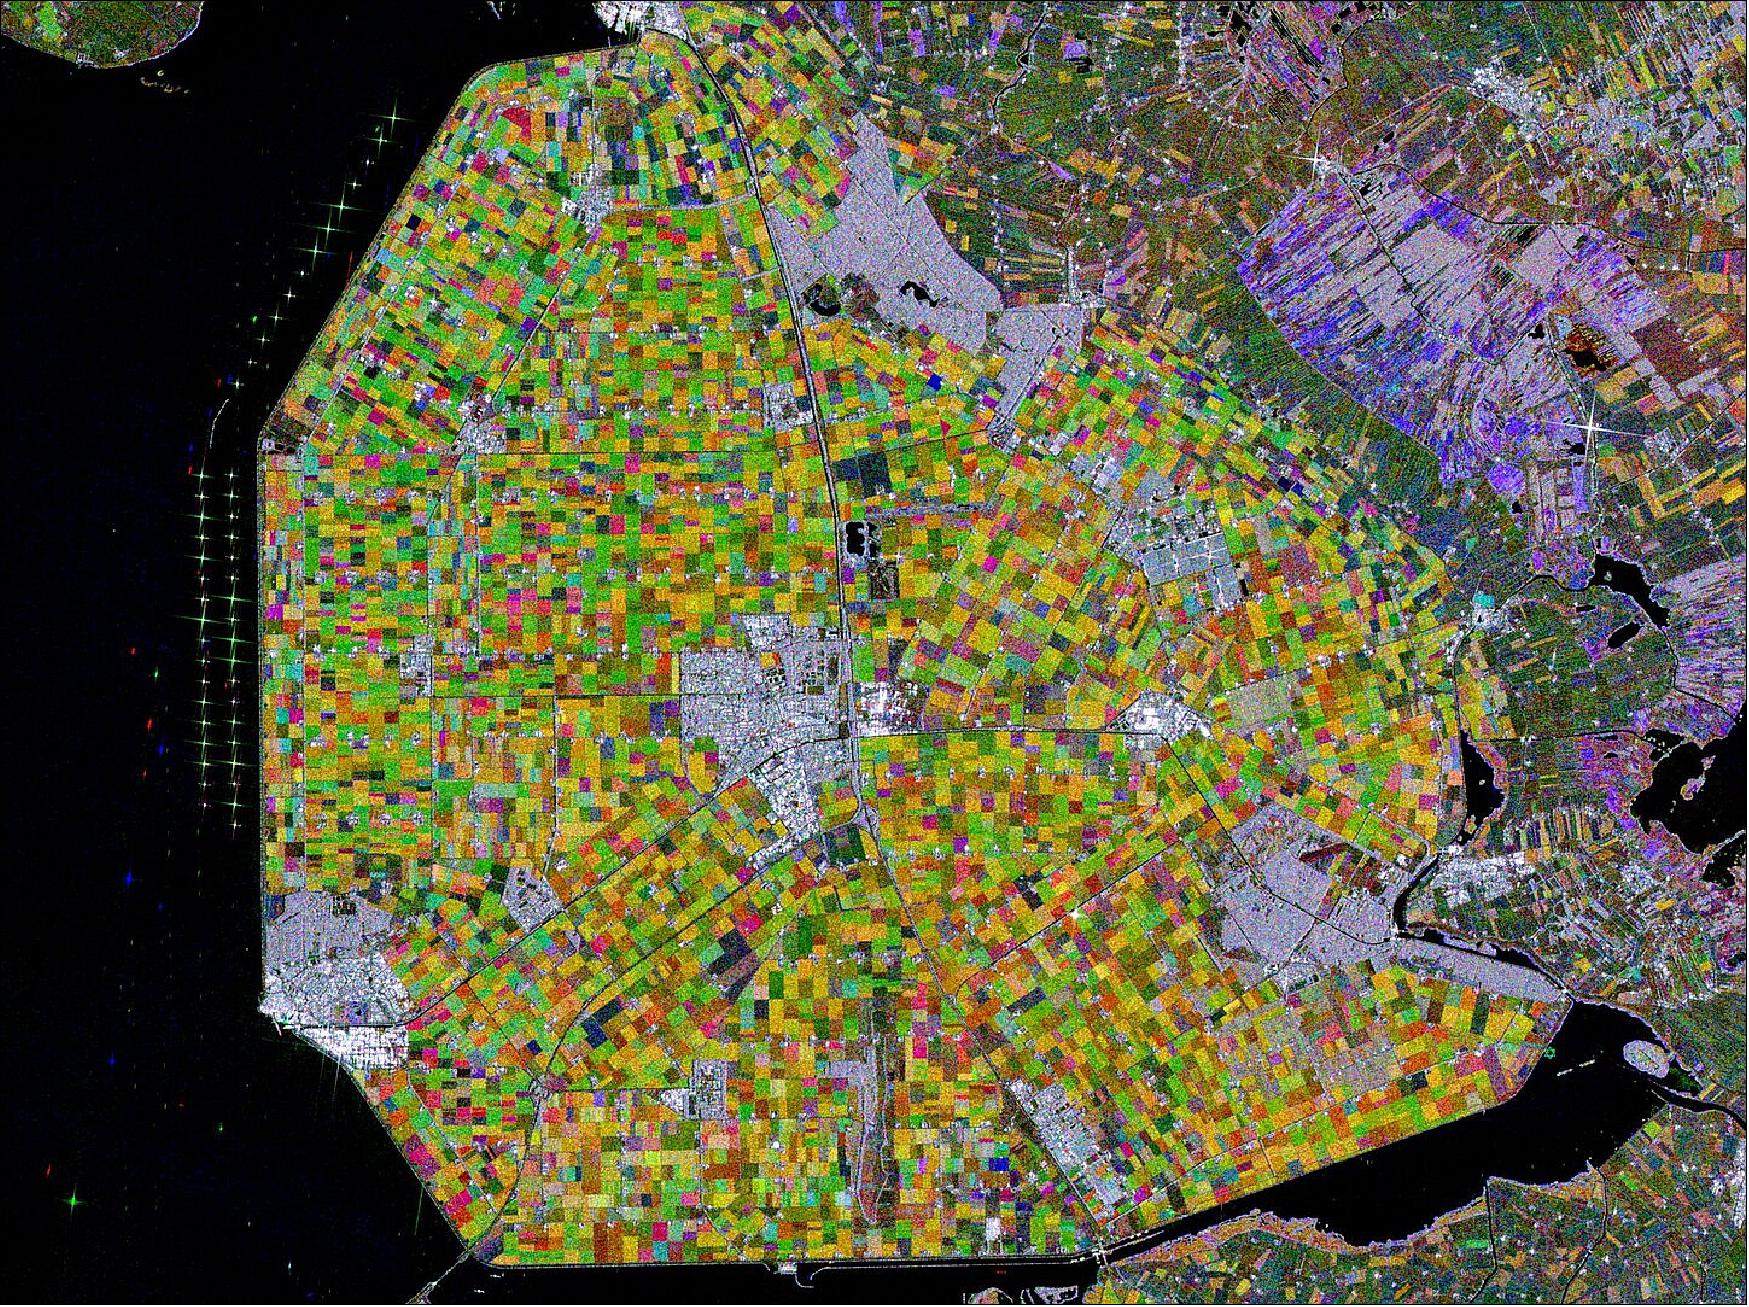
• February 7, 2020: The Copernicus Sentinel-1 mission takes us over part of the Dutch province of Flevoland – the newest province in the Netherlands and one of the largest land reclamation projects in the world. 21)
- With almost a third of the country lying below sea level, the Netherlands is famously known as a ‘low country,’ and has a long history of land reclamation.
- One reclamation project resulted in Flevoland. After a major flood it was decided to tame the Zuiderzee, a large, shallow inlet of the North Sea, to improve flood protection and also create additional land for agricultural use.
- The project entailed the creation of land known as polders. The ‘Noordoostpolder,’ or the Northeast polder is the focus of this image. Over the years, the region has developed to become a home to a modern and innovative agricultural industry. The province produces predominantly apples, cereals, potatoes and flowers – with each colorful patch in the image representing a different crop.
- Along the dikes of the Ijsselmeer, west of the Noordoostpolder, lies one of the largest wind farms in the Netherlands. The strong, almost star-shaped, reflections that can be seen near the shore are around 86 wind turbines. The wind farm is said to generate approximately 1.4 billion kWh of clean renewable energy per year – comparable to the power consumption of over 400,000 households.
- Images acquired with radar are interpreted by studying the intensity of the backscatter radar signal, which is related to the roughness of the ground. Cities and towns are visible in white owing to the stronger reflection of the signal. Emmeloord can be seen in the center of the Noordoostpolder, as well as several farms that appear as bright white dots along the roads.
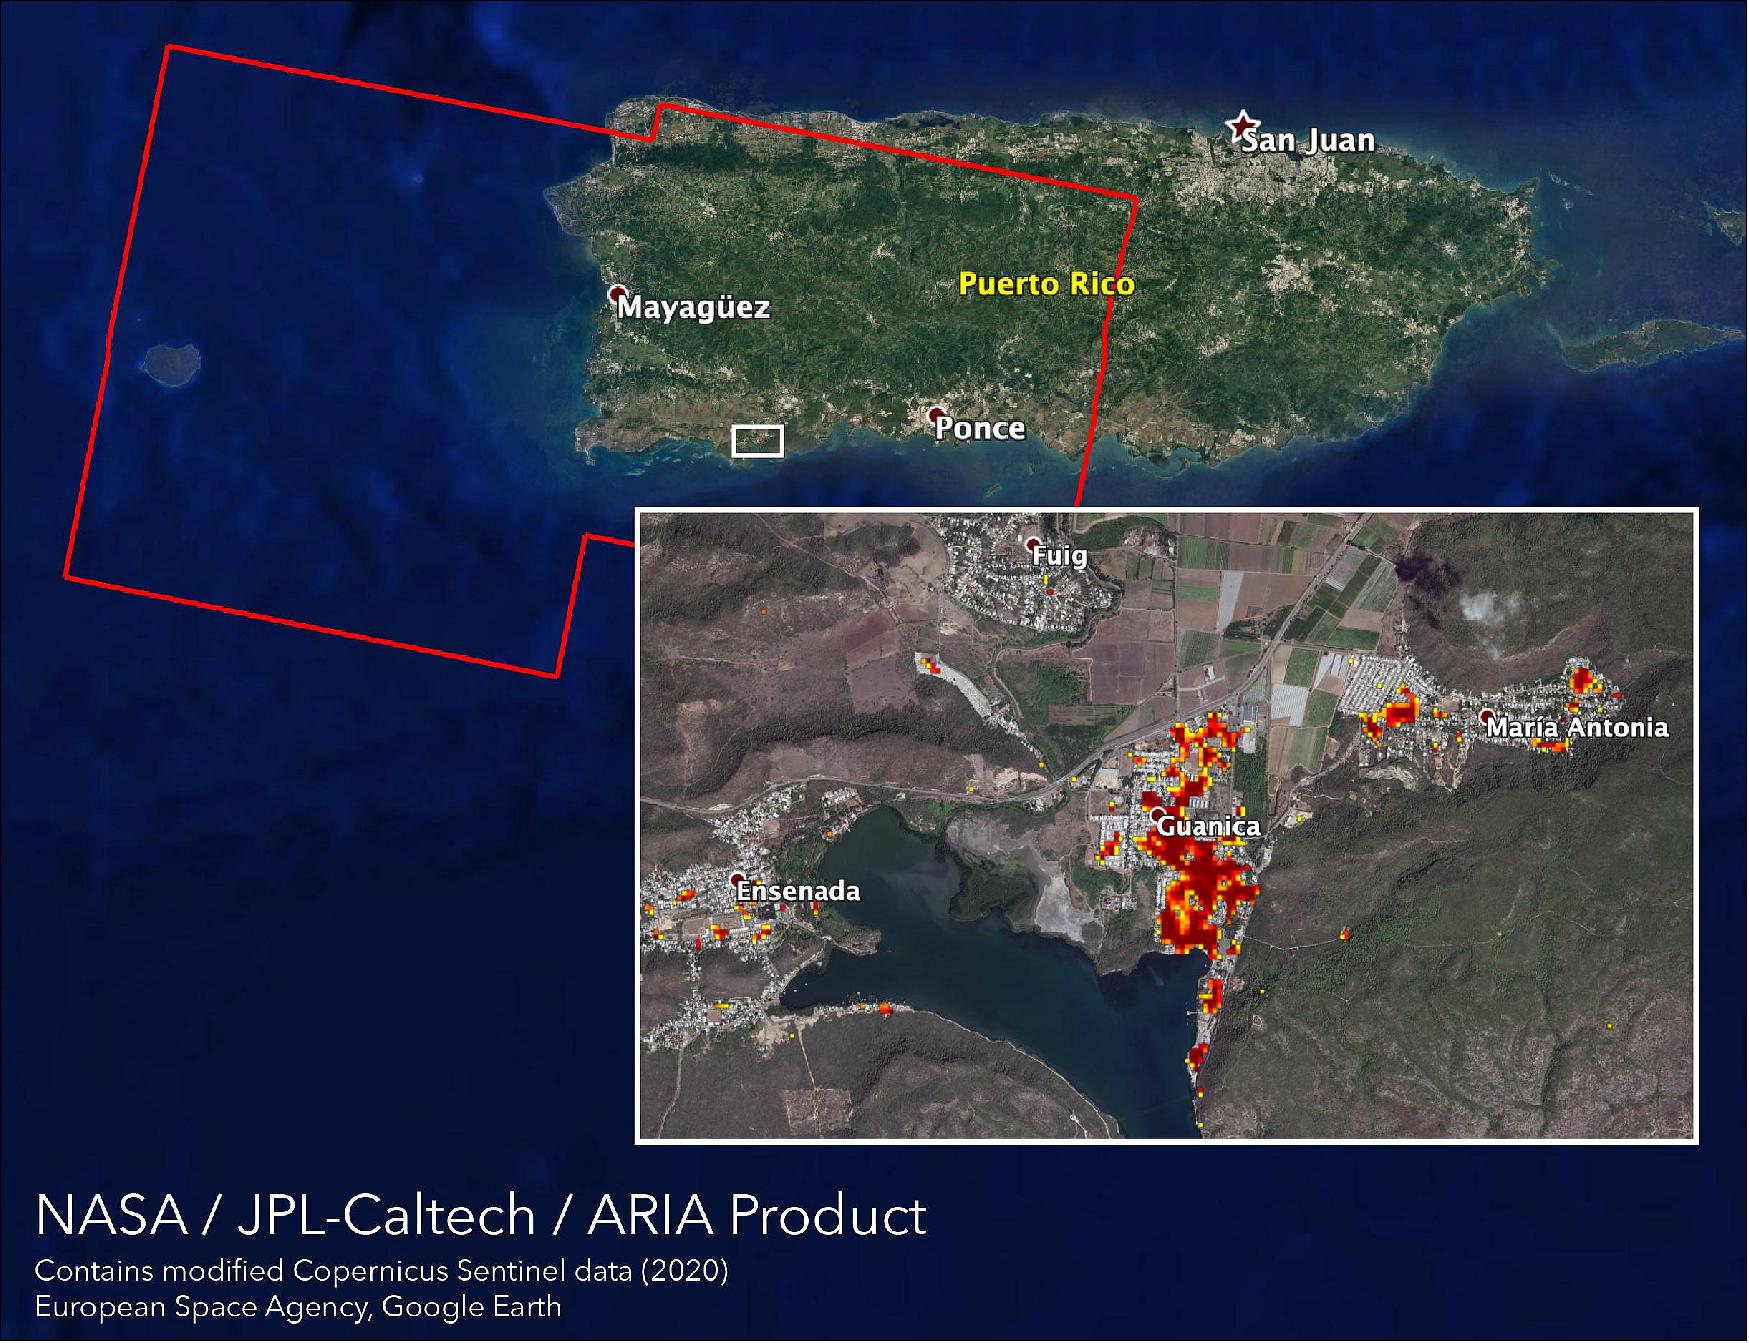
• January 15, 2020: Since a magnitude-6.4 earthquake struck Puerto Rico last week, aftershocks near its southwestern coast have been relentless. The frequency and intensity of the aftershocks continue to cause damage on this already-vulnerable part of the island. 22)
- NASA scientists are helping local and federal agencies assess the extent of that damage. Using synthetic aperture radar data from the Copernicus Sentinel-1 satellites operated by the European Space Agency (ESA), the Advanced Rapid Imaging and Analysis (ARIA) team at NASA's Jet Propulsion Laboratory and Caltech in Pasadena, California, created a new damage map that includes the southwestern coast near the main quake's epicenter.
- The ARIA team compared post-quake satellite data acquired on 14 January with data as far back as September 2019 to produce the map. The color variation from yellow to dark red indicates increasingly significant damage. Their analysis shows that Guanica, west of the city of Ponce, was particularly hard hit.
- The NASA Earth Applied Sciences Disasters Program has activated a Tier 1 response in support of this disaster and has been in contact with the Federal Emergency Management Agency, the United States Geological Survey, Health and Human Services and other agencies to provide NASA Earth-observing data in support of response and recovery efforts. A webpage has also been created on the NASA Disasters Mapping Portal to supply relevant geographic information system (GIS) data products.
• January 10, 2020: Scientists use satellite data to help response agencies identify damaged areas. Days after a 6.4-magnitude earthquake rocked Puerto Rico, followed by hundreds of aftershocks, the full extent of damage is only beginning to be realized. 23)
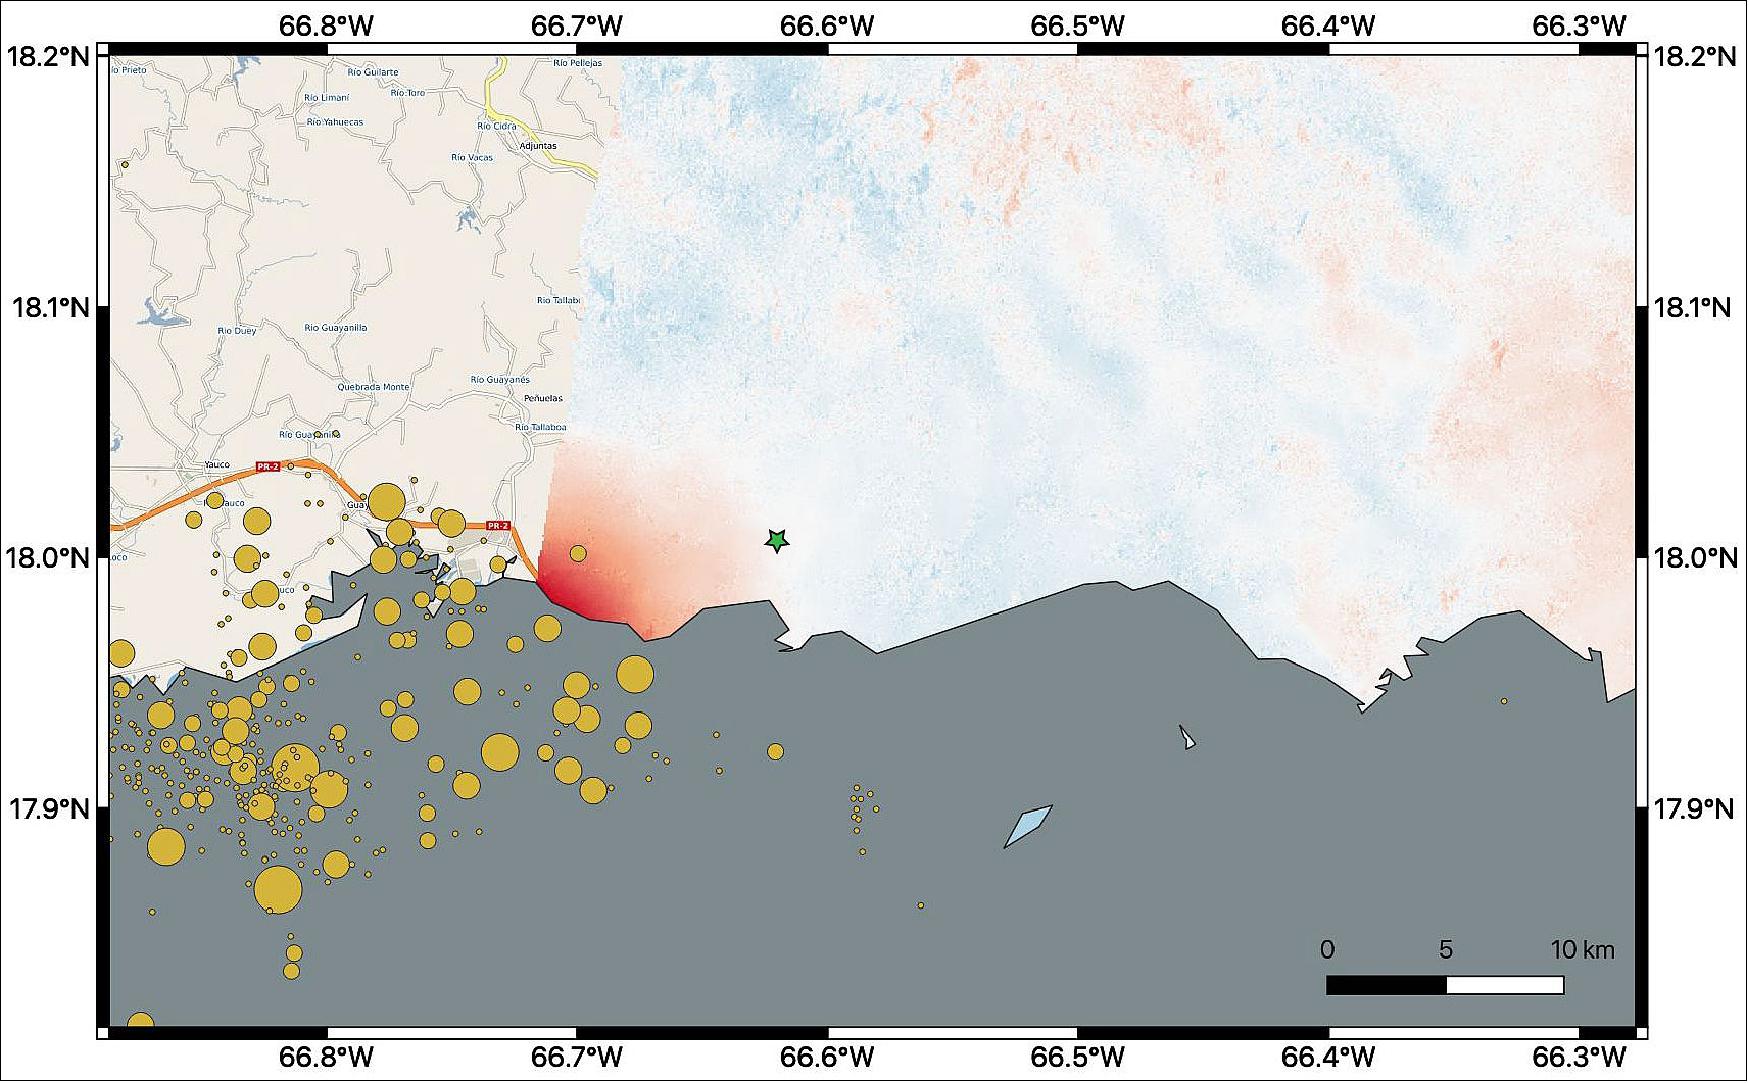
- NASA scientists are using satellite data to help federal and local agencies identify areas with potential damage. Earthquakes cause permanent changes to the ground surface. By comparing interferometric synthetic aperture radar (InSAR) data acquired on Jan. 9, 2020, with data acquired on Dec. 28, 2019, from the Copernicus Sentinel-1A satellite, the scientists were able to map where, how much and in what direction those changes occurred.
- Managed by the European Space Agency (ESA), the Copernicus Sentinel-1A satellite was able to see the eastern two-thirds of the island during the January 9 flyover. On the map (Figure 30), red indicates areas where the ground was changed, or displaced, with darker shades corresponding to more significant displacement. The scientists found that the greatest displacement from the flyover area occurred west of the city of Ponce (identified by the green star), not far from the quake's offshore epicenter. They recorded up to 14 cm of ground change there. The ground appeared to shift downward and slightly to the west.
- The quake epicenter and the cluster of quakes and aftershocks in the region identified by the United States Geological Survey (shown as orange circles) fall just west of the satellite's Jan. 9 track. Because of this, scientists also plan to analyze data from Sentinel-1A's forthcoming Jan. 14 flyover, which will include western Puerto Rico.
- The NASA Earth Applied Sciences Disasters Program has activated Tier 1 response in support of this disaster and is in contact with the Federal Emergency Management Agency, the United States Geological Survey and Health and Human Services (HHS) to provide NASA Earth-observing data in support of response and recovery efforts. Products in the process of being produced include Suomi-NPP-based "Black Marble" power outage maps, damage maps, and landslide maps. A webpage has also been created on the NASA Disasters Mapping Portal to supply relevant GIS data products.
- The map contains modified Copernicus Sentinel data processed by ESA and analyzed by scientists at NASA's Jet Propulsion Laboratory, and earthquake location data from the USGS.
1) ”Rovaniemi, Lapland,” ESA Applications, 18 December 2020, URL: https://www.esa.int/ESA_Multimedia/Images/2020/12/Rovaniemi_Lapland
2) ”Iceberg on collision course with South Georgia,” ESA Applications, 11 December 2020, URL: https://www.esa.int/ESA_Multimedia/Videos/2020/12/Iceberg_on_collision_course_with_South_Georgia
3) ”Giant berg on collision course with South Georgia,” ESA Applications, 10 November 2020, URL: https://www.esa.int/ESA_Multimedia/Images/2020/11/Giant_berg_on_collision_course_with_South_Georgia
4) ”Crete, Greece,” ESA Applications, 6 November 2020, URL: https://www.esa.int/ESA_Multimedia/Images/2020/11/Crete_Greece
5) ”Germany land motion mapped,” ESA Applications, 03 November 2020, URL: https://www.esa.int/Applications/Observing_the_Earth/
Copernicus/Sentinel-1/Germany_land_motion_mapped
6) ”California’s Rising and Sinking Coast,” NASA Earth Observatory, Image of the Day for 23 October 2020, URL: https://earthobservatory.nasa.gov/images/147439/californias-rising-and-sinking-coast
7) ”Worsening rifts and fractures spotted at two of Antarctica’s most important glaciers,” ESA Applications, 29 September 2020, URL: https://www.esa.int/Applications/Observing_the_Earth/
Worsening_rifts_and_fractures_spotted_at_two_of_Antarctica_s_most_important_glaciers
8) Stef Lhermitte, Sainan Sun, Christopher Shuman, Bert Wouters, Frank Pattyn, Jan Wuite, Etienne Berthier, and Thomas Nagler, ”Damage accelerates ice shelf instability and mass loss in Amundsen Sea Embayment,” PNAS (Proceedings of the National Academy of Sciences of the United States of America), Published: 14 September 2020, https://doi.org/10.1073/pnas.1912890117, URL: https://www.pnas.org/content/pnas/early/2020/09/08/1912890117.full.pdf
9) ”Amazon River,” ESA Applications, 11 September 2020, URL: https://www.esa.int/ESA_Multimedia/Images/2020/09/Amazon_River
10) ”Scientists Map Beirut Blast Damage,” NASA Earth Observatory, Image of the Day for 11 August 2020 of Sentinel-1A and -1B, URL: https://earthobservatory.nasa.gov
/images/147098/scientists-map-beirut-blast-damage
11) Ian J. O'Neill / Jane J. Lee, Esprit Smith, ”NASA Maps Beirut Blast Damage,” NASA Feature, 8 August 2020, URL: https://www.nasa.gov/feature/jpl/nasa-maps-beirut-blast-damage
12) ”Falkland Islands,” ESA Applications, 24 July 2020, URL: https://www.esa.int/ESA_Multimedia/Images/2020/07/Falkland_Islands
13) ”Mapping the Oaxaca earthquake from space,” ESA / Applications / Observing the Earth / Copernicus / Sentinel-1, 23 July 2020, URL: https://www.esa.int/Applications/Observing_the_Earth
/Copernicus/Sentinel-1/Mapping_the_Oaxaca_earthquake_from_space
14) ”Giant A-68 iceberg three years on,” ESA Applications, 10 July 2020, URL: https://www.esa.int/Applications/Observing_the_Earth/
Copernicus/Sentinel-1/Giant_A-68_iceberg_three_years_on
15) ”Bay of Naples, Italy,” ESA Applications, 10 July 2020, URL: https://www.esa.int/ESA_Multimedia/Images/2020/07/Bay_of_Naples_Italy
16) ”Can rain trigger a volcanic eruption?,” ESA / Applications / Observing the Earth / Copernicus / Sentinel-1, 30 April 2020, URL: http://www.esa.int/Applications/
Observing_the_Earth/Copernicus/Sentinel-1/Can_rain_trigger_a_volcanic_eruption
17) Jamie I. Farquharson & Falk Amelung, ”Extreme rainfall triggered the 2018 rift eruption at Kīlauea Volcano,” Nature, Volume 580, pp: 491-495, Published: 22 April 2020, https://doi.org
/10.1038/s41586-020-2172-5
18) ”Rice fields, Vietnam,” ESA Applications, 27 March 2020, URL: http://www.esa.int/ESA_Multimedia/Images/2020/03/Rice_fields_Vietnam
19) ”Houston, Texas,” ESA Applications, 21 February 2020, URL: https://www.esa.int/ESA_Multimedia/Images/2020/02/Houston_Texas
20) ”Pine Island Glacier spawns piglets,” ESA Applications, 11 February 2020, URL: http://www.esa.int/ESA_Multimedia/Videos/2020/02/Pine_Island_Glacier_spawns_piglets
21) ”Flevoland, the Netherlands,” ESA Applications, 7 February 2020, URL: https://www.esa.int/ESA_Multimedia/Images/2020/02/Flevoland_the_Netherlands
22) ”NASA's ARIA Team Helps in Puerto Rico Quake Response,” NASA/JPL News, 15 January 2020, URL: https://www.jpl.nasa.gov/news/news.php?release=2020-009
23) ”NASA Maps Ground Changes From Puerto Rico Quake,” NASA/JPL News, 10 January 2020, URL: https://www.jpl.nasa.gov/news/news.php?release=2020-006
The information compiled and edited in this article was provided by Herbert J. Kramer from his documentation of: ”Observation of the Earth and Its Environment: Survey of Missions and Sensors” (Springer Verlag) as well as many other sources after the publication of the 4th edition in 2002. - Comments and corrections to this article are always welcome for further updates (herb.kramer@gmx.net).