Copernicus: Sentinel-3 - 2018 to 2016
Sentinel-3 imagery from 2018-2016
• December 6, 2018: From 12 December 2018, Sentinel-3B OLCI Level-1 Products will be available at Near Real Time (NRT) and Non Time Critical (NTC) timeliness. These data are the first Sentinel-3B OLCI data to be released after the successful completion of the Sentinel-3B commissioning phase. 1)
- The Sentinel-3 Product Notice for OLCI Level 1 provides information on the OLCI current processing baseline, product quality, known limitations, and product availability status. It is relevant for both Sentinel-3A and Sentinel-3B OLCI products.
- To receive Sentinel-3B UNS (User Notification Service) alerts by email, make sure you update your UNS subscriptions via our Earth Observation Portal (EOP).
• December 3, 2018: From 6 December 2018, Sentinel-3B STM Level-1 and Marine Level-2 Products will be available at Near Real Time (NRT), Short Time Critical (STC) and Non Time Critical (NTC) timeliness. 2)
- These data are the first Sentinel-3B STM (Surface Topography Mission) data products to be released after the successful completion of the Sentinel-3B commissioning phase.
- The Sentinel-3 Product Notices for STM Level-1 and for Level-2 Marine provide information on the SRAL/MWR current processing baseline, product quality, known limitations, and product availability status. They are relevant for both Sentinel-3A and Sentinel-3B STM data products.
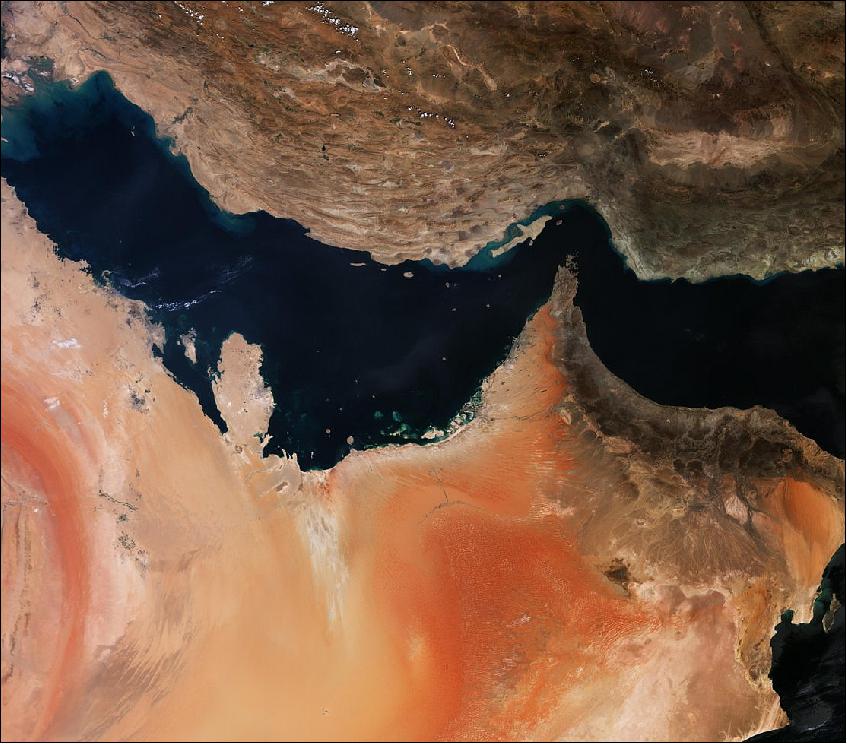
• November 23, 2018: The Copernicus Sentinel-3A satellite takes us over the Gulf. Also known as the Arabian Gulf and the Persian Gulf, this marginal sea of the Indian Ocean is just under 1000 km long and covers an area of around 250,000 km2 (Figure 3) . It is bordered by eight nations shown counter-clockwise from the top of the image – Iran, Iraq, Kuwait, Saudi Arabia, Bahrain, Qatar, United Arab Emirates and Oman. 3)
- Most of these countries are shown in a warm shade of orange in the lower part of the image. The variations in color in this area represent the different surface types and compositions. Some areas are purely sand, whilst others are a mixture of rocks and sand, or salt mineral deposits. Sand dunes are prevalent in the central area, depicting one of the largest and driest sand deserts in the world – the Rubh al Khali or the Empty Quarter.
- The satellite image shows in particular the significance of the Strait of Hormuz, the narrowest passage in the Gulf, a strait between the Persian Gulf and the Gulf of Oman. It provides the only sea passage from the Persian Gulf to the open ocean and is one of the world's most strategically important choke points. On the north coast lies Iran, and on the south coast the United Arab Emirates and Musandam, an exclave of Oman. At its narrowest, the strait has a width of 21 nautical miles (39 km). - About 20% of the world's petroleum (about 35% of the petroleum traded by sea) passes through the strait, making it a highly important strategic location for international trade.
- To reduce the risk of collision, ships moving through the Strait follow a Traffic Separation Scheme (TSS): inbound ships use one lane, outbound ships another, each lane being two miles wide. The lanes are separated by a two-mile-wide "median". To traverse the Strait, ships pass through the territorial waters of Iran and Oman under the transit passage provisions of the United Nations Convention on the Law of the Sea. The Strait of Hormuz is of vital importance of these waterways – not only economically, but also politically.
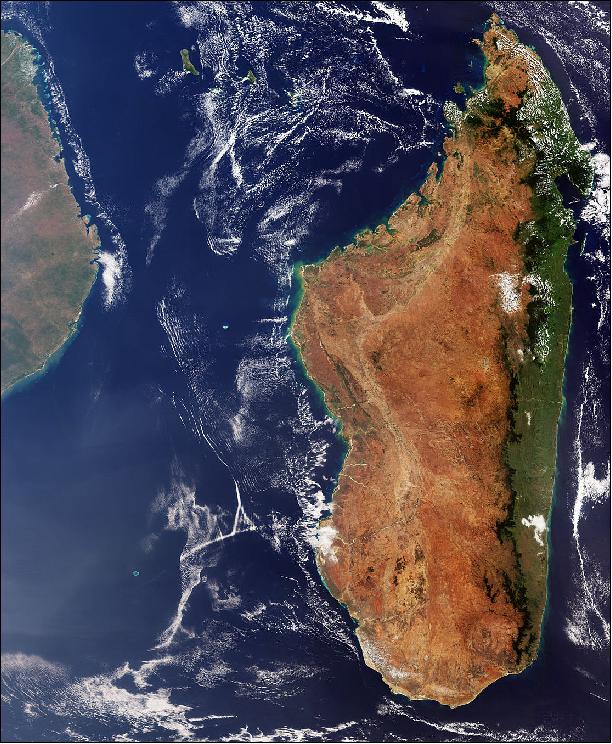
• November 9, 2018: The Copernicus Sentinel-3 mission takes us over Madagascar. This huge island nation, located off the east coast of Africa and seen in the left of the image, has a population of around 25 million. More than half of the country's inhabitants are aged under 25. The island is also home to rare flora and fauna, having developed its own ecosystems and wildlife since splitting from the African continent some 160 million years ago. 4)
- Preserving its impressive biodiversity is an ongoing challenge for the country. With an area of almost 600,000 km2, Madagascar is the fourth largest island in the world. Some of the world's most extensive coral reef systems, huge mangrove areas, and a vast array of birds, lemurs, and many other species can be found here. Deforestation poses a serious threat to the island's habitats, with illegal wildlife trade representing a further challenge.
- In this true-color image from Copernicus Sentinel-3's (OLCI (Ocean and Land Color Instrument), we can see sediment in the water along the coast. The island appears in green on the east coast, where the prevailing trade winds bring clouds and up to 3.5 m of rain per year to the low-lying coast.
- The central and western highlands and coast appear in brown and are much dryer, especially between May to October. The volcanic mountainous area of Ankaratra can be found in the central highlands. In the north of the island, the highest peak of Maromokotro stands almost 2900 m above sea level.
- The Mozambique Channel, which separates Madagascar from the continent, is an important shipping route for east Africa and home to significant tuna reserves. Efforts are underway to ensure that sustainability is considered in local development. Identifying and protecting critical habitats, such as migratory corridors, is part of this work.
- Sentinel-3 is a two-satellite mission to supply the coverage and data delivery needed for Europe's Copernicus environmental monitoring program. It provides critical information for a range of applications from marine observation to large-area vegetation monitoring.
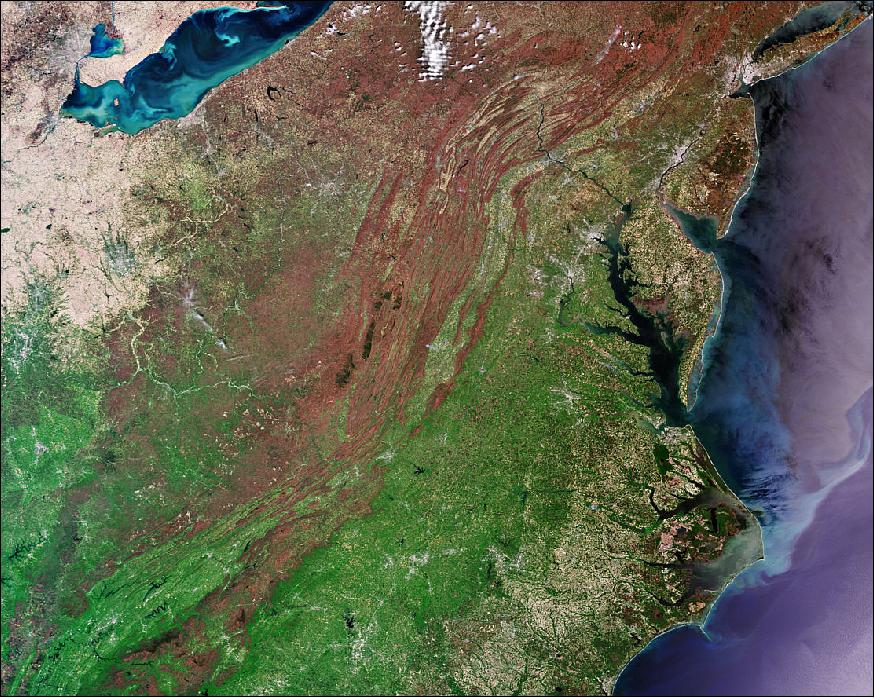
• October 5, 2018: The Copernicus Sentinel-3 satellite takes us over eastern US. Spanning a huge area, including the states of Ohio, Maryland, West Virginia and Delaware, a number of major cities can be seen in this true-color image. The megacity of New York is visible in the top right. A megacity is defined by the United Nations as a city with a population of over ten million. According to the latest estimates there will be 43 megacities across the globe by 2030. 5) The image of Figure 5 is also featured on the Earth from Space video program
- Further down the coast, the US capital of Washington, D.C. can be seen in the upper-central part of the image. Washington, D.C. is a territory, not a state. The first part of the capital's name is in honor of the first president of the US, George Washington, and D.C. stands for District of Columbia, derived from Christopher Columbus.
- The brown color, that dominates the central part of the image, represents mountainous areas and forests, running through West Virginia and beyond. Known as the Mountain State, this is the only state completely within the Appalachian Mountain region. At around 460 m, its average elevation is higher than any other state east of the Mississippi River.
- To the north of West Virginia, Pennsylvania, which takes its name from a combination of Latin words, meaning ‘Penn's woods', stretches up towards New York. Half of this state is covered by forests, including the Allegheny National Forest, which can be seen in the top-center of the image.
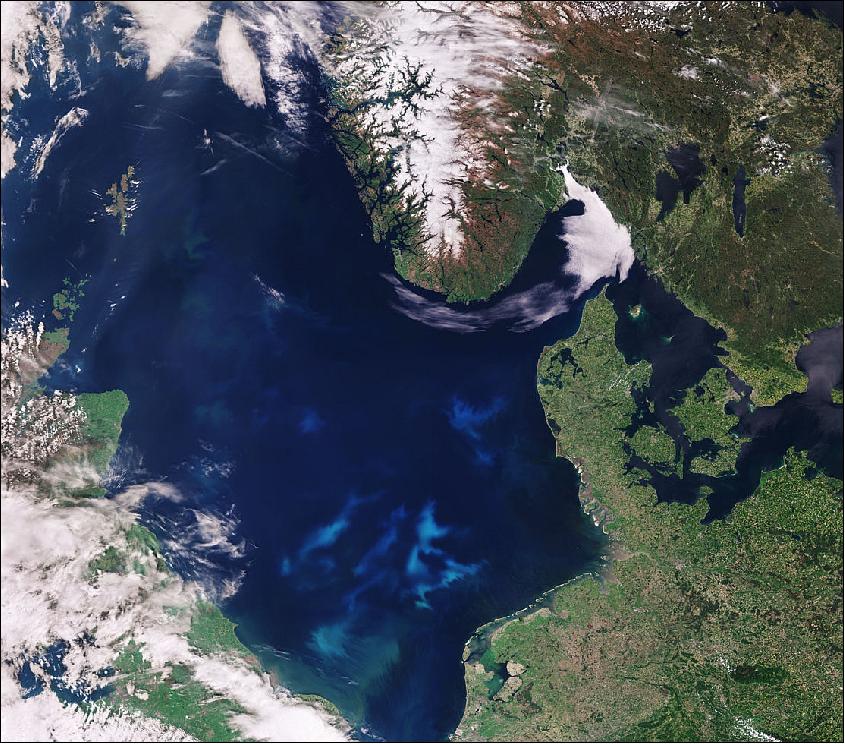
• September 7, 2018: The Copernicus Sentinel-3A satellite takes us over the North Sea, revealing a significant algae bloom covering most of the southern part. One of Europe's most productive fisheries, the North Sea covers an area of 570, 000 km2 and is linked to the Atlantic by one of the world's busiest shipping regions – the English Channel. 6)
- The image of Figure 6 covers a large section of Scandinavia, including Norway, the south of Sweden, and Denmark, stretching down to Germany and the Netherlands in the bottom right. On the left of the image we can see the east coast of Scotland and the Northern Isles, comprising two archipelagos – Orkney and Shetland. This image is also featured on the Earth from Space video program. 7)
- Harmful algal blooms caused by excessive growth of marine algae have occurred in the North Sea and the English Channel area in recent years, with satellite data being used to track their growth and spread. These data can then be used to help develop alert systems to mitigate against damaging impacts for tourism and fishing industries.
- Harmful blooms, which pose a threat to various forms of water life, are thought to carry an annual cost of over 900 million euros to these industries in the EU.
- Helping to map algal blooms and providing critical information for marine operations are just some of the ways that the two-satellite Sentinel-3 is used for Europe's Copernicus environmental monitoring program. Since 2016, Sentinel-3A has been measuring our oceans, land, ice and atmosphere to monitor and understand large-scale global dynamics. In April 2018, it was joined by its twin satellite Sentinel-3B.
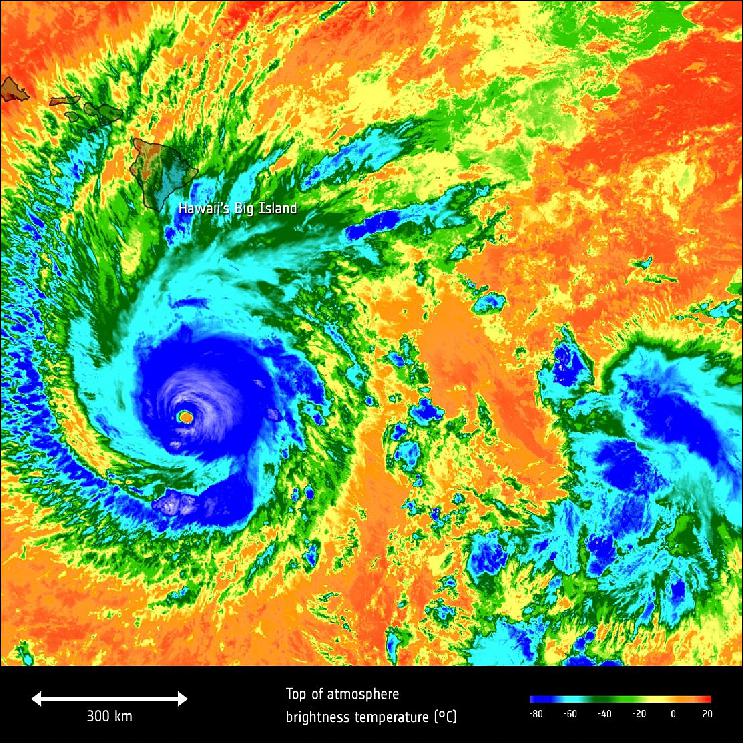
• August 24, 2018: The Copernicus Sentinel-3A satellite took the temperature at the top of Hurricane Lane as it headed towards Hawaii's Big Island on 22 August 2018. Lane weakened to a Category 3 storm on 23 August, just before it hit Hawaii. Still a powerful storm, it has brought torrential rain to the Big Island. The island is still reeling from months of devastating lava flows from the Kilauea volcano and is now coping with heavy rain and flooding. The brightness temperature of the clouds at the top of the storm, some 12–15 km above the ocean, range from about –80°C near the eye of the storm to about 15°C at the edges (Figure 7). 8)
- Hurricanes are one of the forces of nature that can be tracked only by satellites, providing up-to-date imagery so that authorities know when to take precautionary measures. Satellites deliver information on a storm's extent, wind speed and path, and on key features such as cloud thickness, temperature, and water and ice content. Sentinel-3's Sea and Land Surface Temperature Radiometer measures energy radiating from Earth's surface in nine spectral bands.
• July 2018: Full coverage and revisit performance are achieved with both Sentinel-3A and Sentinel-3B in orbit. In order to guarantee long-term continuity of the Sentinel-3 mission, additional satellites (Sentinel-3C and Sentinel-3D) are under development as replacements to the initial satellite pair (S-3A and S-3B). In this way the series of Sentinel-3 satellites will ensure global, frequent and near-realtime ocean, ice and land monitoring, with the provision of observation data in routine, long term (up to 20 years of operations) and continuous fashion, with a consistent quality and a high level of reliability and availability. 9)
Sentinel-3 operations: The Sentinel-3A mission was launched in February 2016 and the Sentinel-3B mission in April 2018. The Sentinel-3 missions are jointly operated by ESA and EUMETSAT. ESA is responsible for the operations, maintenance and evolution of the Sentinel-3 ground segment on land related products and EUMETSAT for the marine products. All facilities supporting the Sentinel-3 operations are in place: • Data acquisition and near real time (NRT) product generation, including data downlink and processing (NRT and offline) is performed at the Svalbard station, • Processing and Archiving Centers (PAC), which perform the Sentinels' systematic non-time-critical data processing, the on-the-fly data processing for specific cases and the reprocessing in case of processing algorithms or calibration parameters upgrades: - OLCI (Ocean and Land Color Instrument) processing and archiving is performed at DLR (German Aerospace Center), Oberpfaffenhofen - SRAL (SAR Radar Altimeter) processing and archiving is performed at CLS (Collecte Localisation Satellites), a CNES subsidiary with HQ in Toulouse. - SLSTR (Sea and Land Surface Temperature Radiometer) and S-3 synergy products processing and archiving is performed by ACRI-ST, Sophia - Antipolis, France - EUMETSAT's marine center acts as PAC for marine products, Darmstadt, Germany. | |
Current status and new developments: The Sentinel-3A mission reached its full operational capacity in Nov-2017. The overall status of the Sentinel-3A mission is nominal, with all subsystem performing nominally. All instruments, including OLCI, SRAL, SLSTR and MWR, are switched on and performing as expected. The Flight Operations Segment (FOS) for Routine Operations is operating nominally. The Payload Data Ground Segment (PDGS) for Land and Marine is in routine operations. After the S3B satellite launch in April 2018, the commissioning phase started allowing in-orbit verification of spacecraft and its payload and a calibration and validation of the corresponding products. Certain activities are synchronized between S3A and S3B to allow the best comparisons (e.g., OLCI solar calibrations or SLSTR straylight tests). This will be conducted during the specifically planned ‘tandem phase'. The outcome of the activities will be reviewed and concluded during the In-Orbit Commissioning Review (IOCR) expected in October 2018. After the IOCR, Sentinel-3B will drift away from Sentinel-3A and arrive at its baseline position at ±140° to Sentinel-3A. | |
Sentinel-3A/-B tandem activities: Even though Sentinel-3A and Sentinel-3B are identical in design, it is expected that differences in performance of payload instruments will exist due to subtle differences and tolerances of materials, manufacture and pre-flight characterization. This means that small measurement differences between satellite payloads are likely which, if not accounted for properly, will have a detrimental impact on output products. Therefore, it was decided that Sentinel-3A and Sentinel-3B will conduct a "Tandem Mission" during the early Phase of the Sentinel-3B lifetime (Launch+ ~6 months). In a feasibility study combined with an instrument-by-instrument scientific assessment it was concluded that a Tandem Mission for Sentinel-3A and -3B separated by 30 s presents a near ideal situation (30 s corresponds to a separation in position around the orbit of approximately 210 km). This allows that the optical instruments can view the same area, almost simultaneously, allowing direct comparisons of the data from the two satellites and minimizing the uncertainty introduced by ocean and atmospheric variability in the measurements. Furthermore, it minimizes the uncertainties of atmospheric and surface reflectance variations between the Sentinel-3A and Sentinel-3B optical instruments with respect to the ocean/land signal. As a result it will provide statistically significant data sets in a relatively short period of time allowing to intercalibrate/compare over a variety of surfaces, i.e., different signal levels and product types. |
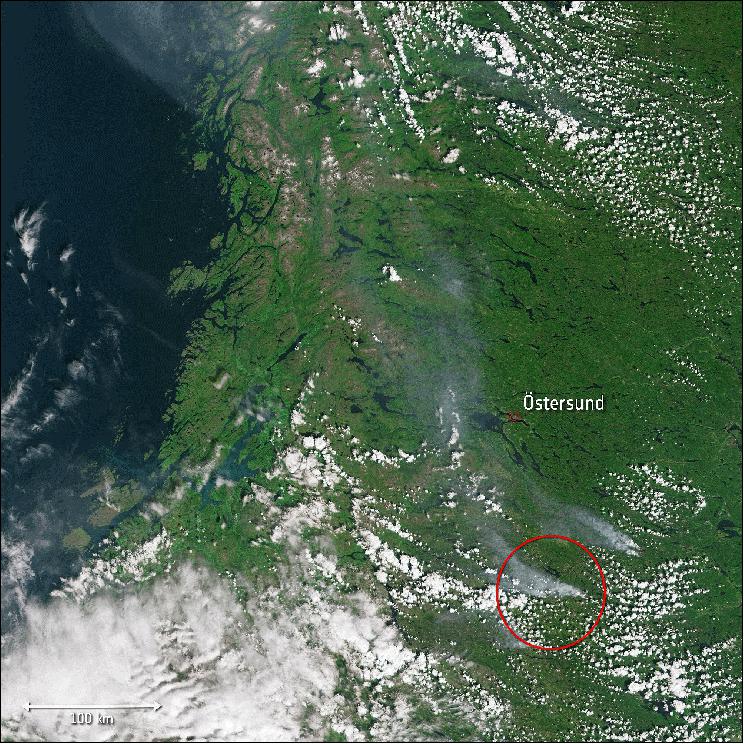
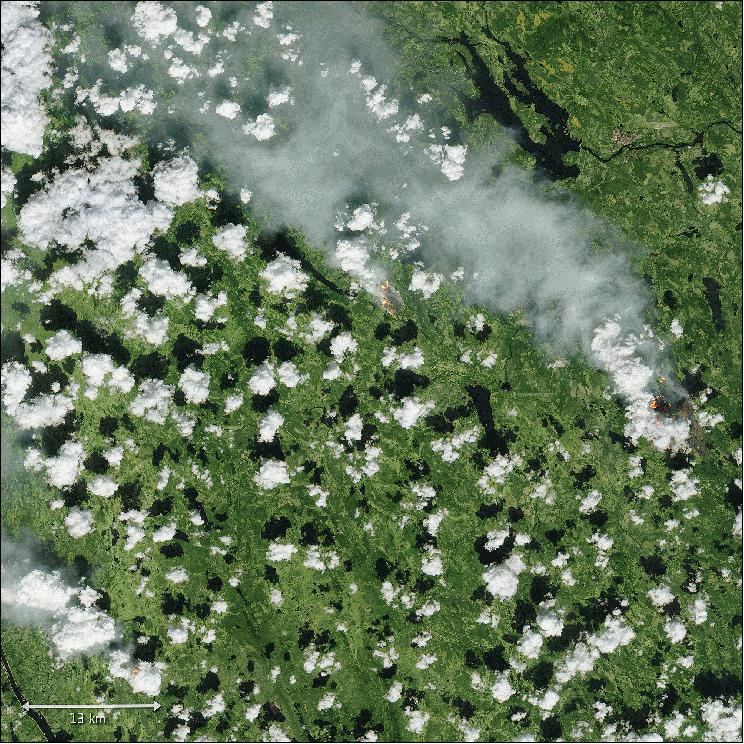
• July 20, 2018: With Europe in the grip of a heatwave and little rain, the scorched ground and dry vegetation is succumbing to fire. Fires have now broken out as far as the Arctic Circle, in Sweden. This animation shows images from the Copernicus Sentinel-2 (Figure 10) and Sentinel-3 (Figure 9) missions. Sentinel-2 carries a high-resolution MSI (Multispectral Imager) and Sentinel-3 carries a suite of instruments including an OLCI (Ocean and Land Color Instrument). The missions offer complementary views of Earth to help monitor environmental change and events such as these fires. 10)
- The fires have led to the authorities evacuating some villages and appealing for help from other countries, and concerns that the current record temperatures and drought are linked to climate change.
- There are said to be around 50 fires now burning in the country. Through July there have been three times as many fires as there were last year.
- Jonas Olsson from the Swedish Meteorological and Hydrological Institute is reported to have said, "It's very, very dry in most of Sweden. The flows in the rivers and lakes are exceptionally low, except in the very northern part of the country. We have water shortages. Rainfall has only been around a seventh of the normal amount, the lowest since record-keeping began in the late 19th century."
- While the focus is clearly on trying to extinguish these fires, the Copernicus Sentinel missions offer an eye in the sky to identify where fires have broken out. This is especially valuable in areas that are sparsely populated.
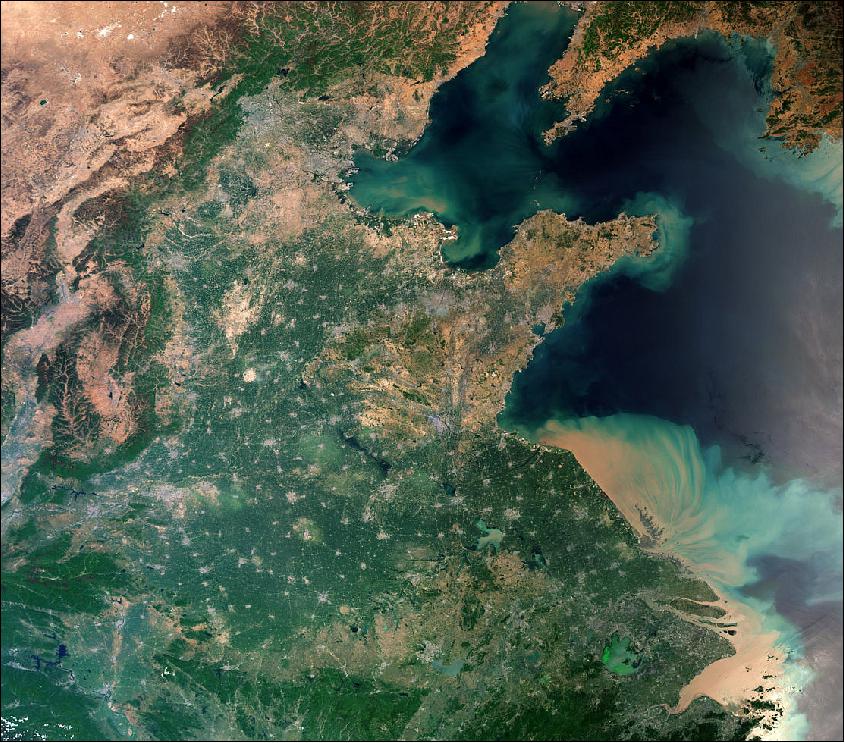
• July 13, 2018: The Copernicus Sentinel-3A satellite takes us over Shanghai, China. One of the most populous cities in the world and home to over 24 million people, the city is visible in the lower right of the image just above the Yangtze River mouth. As a significant global financial center it is also the site of the world's busiest container ports because of its strategic location on the Yangtze River delta. 11)
- The image of Figure 11, which was captured on 29 April 2017, is also featured on the Earth from Space video program.
- The Taihu Lake is shown in green in the lower right part of the image. In 2007, an algal bloom on the lake caused major problems with water supplies in the neighboring city of Wuxi. Such algal blooms may well be linked to the discharge of phosphates found in fertilizers used in industry and agriculture into the water.
- Steps have been taken to limit the use of such fertilizers in a bid to reduce algal blooms, which can significantly alter the ecology of the environment below the surface and pose a threat to various forms of water life.
• June 19,2018: The key to monitoring Earth's changing environment and to guaranteeing a consistent stream of satellite data to improve our daily lives is to take the same measurements over the course of decades. But how do you know that measurements from successive satellites, even though identical in build, are like for like? The answer, for the Copernicus Sentinel-3 mission, is to engage in some nifty orbital flying. 12)
- Sentinel-3 is a two-satellite mission to supply the coverage and data delivery needed for Europe's Copernicus environmental monitoring program.
- Launched in 2016, Sentinel-3A has been measuring our oceans, land, ice and atmosphere to monitor and understand large-scale global dynamics and to provide critical information for marine operations, and more.
- Its twin, Sentinel-3B, was launched in April 2018 and is having its instruments calibrated and being commissioned for service. Once Sentinel-3B is operational, the two satellites will orbit Earth 140° apart.
- Now, however, the satellites have been positioned much closer together, flying a mere 30 seconds apart. Travelling at 7.4 km/s, the separation equates to a distance of 223 km. - The reason for this is to see how their instruments compare.
- Even though the two Sentinel-3 satellites are identical, each carrying a radar altimeter, a radiometer and an imaging spectrometer, there's a chance that their instruments could behave slightly differently. It is important that any differences are carefully accounted for otherwise the information they deliver could be misinterpreted as changes happening on Earth's surface.
- Given the satellites' current brief separation, their measurements should be virtually the same. This tandem phase is also important for the future Sentinel-3 satellites.
- ESA's ocean scientist, Craig Donlon, explains, "Our Sentinel-3 ocean climate record will eventually be derived from four satellites because we will be launching two further Sentinel-3s in the future. We need to understand the small differences between each successive satellite instrument as these influence our ability to determine accurate climate trends. The four-month Sentinel-3 tandem phase is a fantastic opportunity to do this and will provide results so that climate scientists can use all Sentinel-3 data with confidence."
- ESA's Sentinel-3 project manager, Bruno Berruti, said, "Following liftoff and the usual checks, the operations team has been expertly flying Sentinel-3B so that it gradually flies closer to Sentinel-3A. We recently reached the magic separation of 30 seconds and I am happy to say that we are now officially in the tandem phase. This will last around four months, after which the two satellites will be gently moved apart until they reach their operational separation of 140°. This is different to the other Sentinel missions, but for our mission it is better to measure ocean features such as eddies as accurately as possible."
- ESA's Sentinel-3 mission manager, Susanne Mecklenburg, added, "So far, we are really happy with the results of the tandem phase. Measurements from the satellites' instrument packages seem to be very much aligned, but we will be analyzing the results very carefully over the next months to make sure we account for any minor differences."
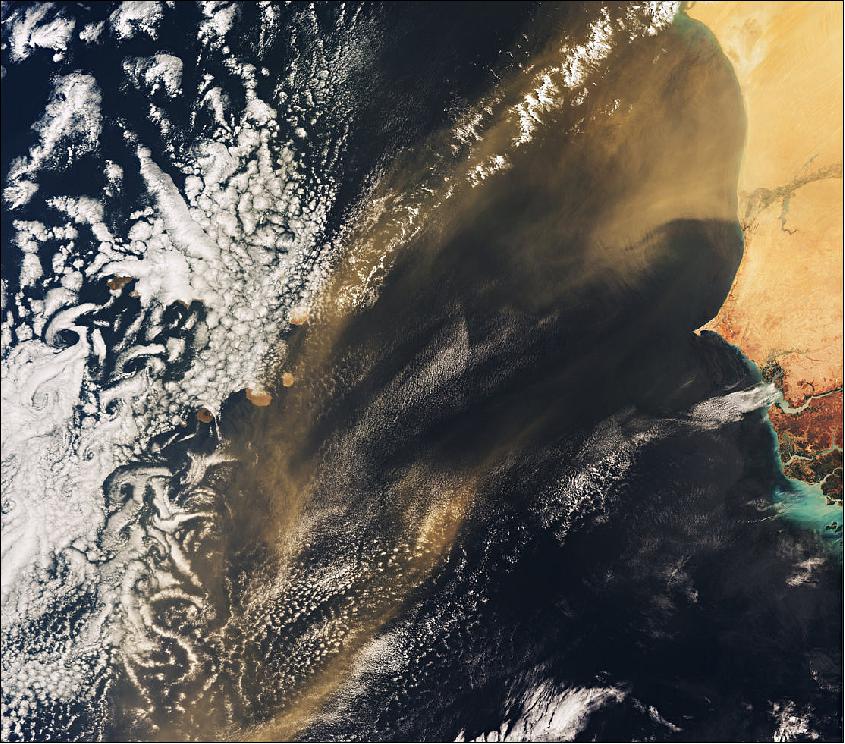
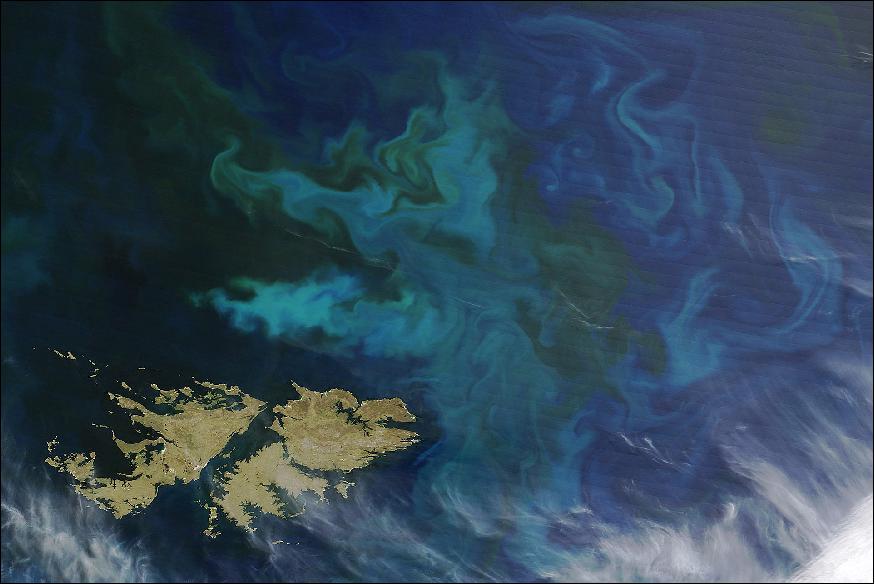
• June 8, 2018: For World Oceans Day, the Copernicus Sentinel-3A satellite takes us over the Atlantic Ocean and the Republic of Cabo Verde. Several of the small islands that make up the archipelago of Cabo Verde can be seen peeking out from beneath the clouds (Figure 13). These 10 volcanic islands, with a total area of about 4000 km 2, lie in the Atlantic Ocean about 570 km off the west coast of Senegal and Mauritania, which frame the image on the right. 13) 14)
- The most striking thing about this image, however, is the dust and sand being carried by the wind towards Cabo Verde from Africa. The sand comes mainly from the Sahara and Sahel region. Owing to Cabo Verde's position and the trade winds, these storms are not uncommon and can disrupt air traffic.
- However, this sand also fertilizes the ocean with nutrients and promotes the growth of phytoplankton, which are microscopic plants that sustain the marine food web. The iron in the dust is particularly important. Without iron mammals cannot make haemoglobin to transport oxygen around the bloodstream and plants cannot make chlorophyll to photosynthesize. Research has shown that around 80% of iron in samples of water taken across the North Atlantic originates from the Sahara. It can be assumed, therefore, that life in the deep ocean depends on this delivery of fertilizer from one of the world's most parched regions.
- World Oceans Day takes place on 8 June each year and celebrates the ocean, its importance in all our lives, and how we can protect it.
- Historically, the name "Cape Verde" has been used in English for the archipelago and, since independence in 1975, for the country. In 2013, the Cape Verdean government determined that the Portuguese designation Cabo Verde would henceforth be used for official purposes, such as at the United Nations, even in English contexts. Cape Verde is a member of the African Union.
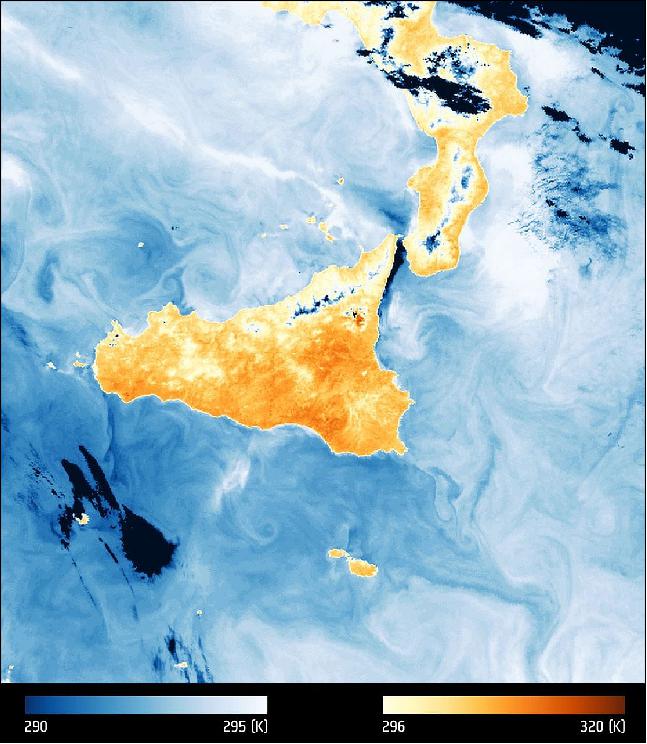
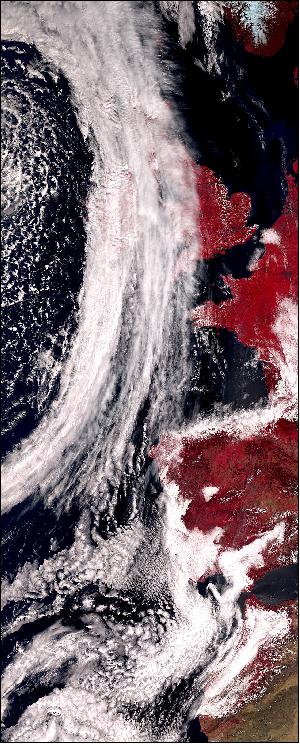
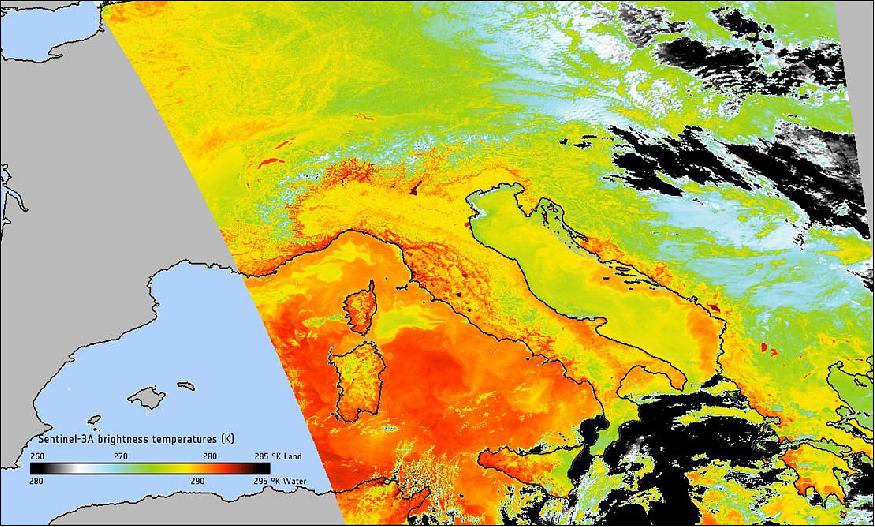
• June 5, 2018: Launched on 25 April 2018, Sentinel-3B has already delivered some impressive first images from its ocean and land color instrument, from its altimeter and from the optical channels of its radiometer. With the radiometer's thermal-infrared channels now turned on, the satellite completes its set of firsts with an image that depicts thermal signatures over southern Italy, the Mediterranean Sea and Sicily – with the hotspot of Mount Etna clearly visible. This image shows the ‘brightness temperature', which corresponds to radiation emitted from the surface. Further processing is needed to turn this into an actual temperature map. The land surface is shown in red–orange colors, corresponding to a brightness temperature range of 296–320K. The blue colors over the ocean correspond to a range of 290–295K. The dark blue–black areas correspond to clouds, which are opaque to thermal-infrared radiation and so prevent a view of the ocean or land surface. 15)
- Mount Etna, Europe's largest and most active volcano in Europe, appears much hotter than the surrounding land. In a state of almost continuous unrest, the volcano is currently classified as having ‘minor activity'.
- Over the oceans, the Sentinel-3 radiometer is important for providing SST (Sea Surface Temperature) measurements for oceanographic and weather forecasting centers. Over land, the instrument can be used, in particular, to monitor urban heat islands and wildfires.
- Sentinel-3B joins its identical twin, Sentinel-3A, in orbit. This pairing of satellites increases coverage and data delivery for the European Union's Copernicus environment program.
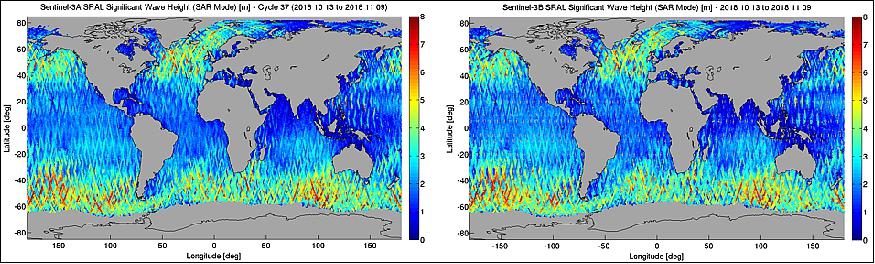
• May 11, 2018: Sentinel-3B has also delivered first data from its altimeter, SRAL (SAR Radar Altimeter), – which means that all of the instruments are working well. 16)
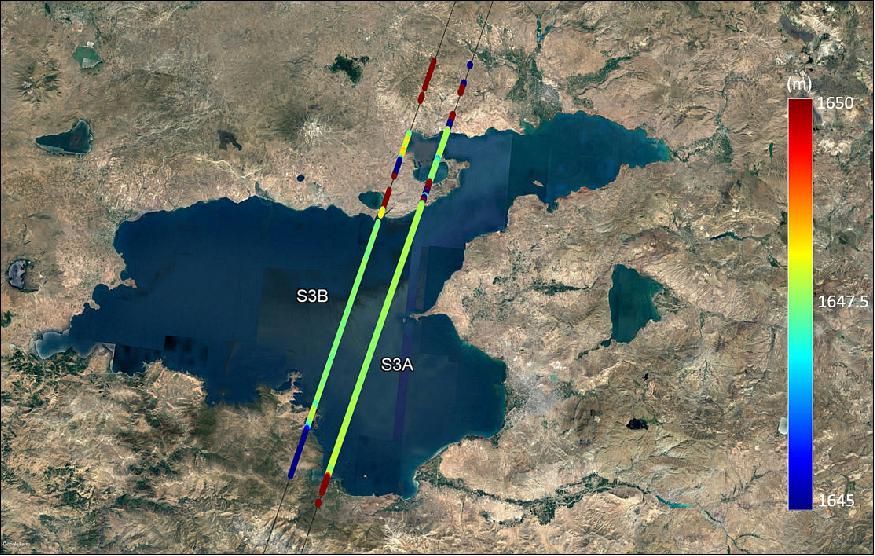
- Sentinel-3B will not be fully commissioned for service for another five months or so, but even at this early stage in its life in orbit, these data compare well with those of its fully-operational twin, Sentinel-3A. The altimeter is particularly important for measuring changes in sea level, but as this example shows, the instrument also contributes to monitoring the height of lake water through the Copernicus Global Land Service. It is also used to measure the height of ice.
• May 11, 2018: The high-precision sea level anomaly measurements from SRAL (Synthetic Aperture Radar Altimeter) on Sentinel-3B enhance the Copernicus altimeter constellation of Sentinel-3A and Jason-3, along with Jason-2. 17)
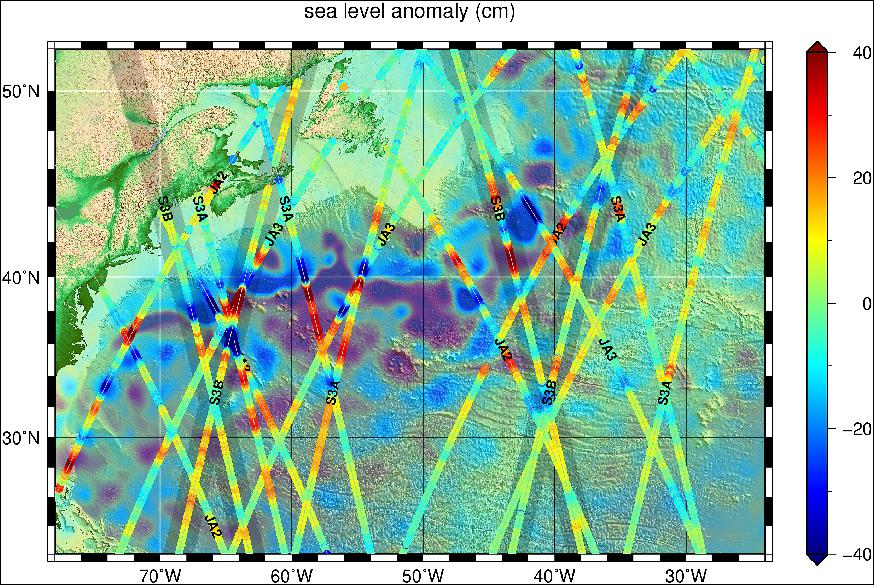
- Pierre Yves Le Traon, Scientific Director at Mercator Ocean, which operates the Copernicus Marine Environment Monitoring Service (CMEMS), said receiving data from altimeters on two Sentinel-3 satellites will bring benefits to marine safety and industries.
- "The joint use of Sentinel-3A and Sentinel-3B high precision altimeters will improve capabilities of CMEMS to forecast waves and ocean currents at fine scale," Le Traon said. "This is highly needed for the applications we service, such as marine safety, maritime transport and offshore operations."
• May 10, 2018: The SLSTR (Sea and Land Surface Temperature Radiometer) is particularly sophisticated, measuring energy radiating from Earth's surface in nine spectral bands, including visible and infrared. It also includes dedicated channels for measuring fires. This early image came from its optical channels. 18)
- SLSTR measures the energy radiating from the Earth's surface in nine spectral bands, including visible and infrared. The thermal channels will be switched on once the instrument has completed outgassing water vapor, and the infrared channels have been cooled to the operating temperatures. 19)
- Sentinel-3B is currently flying in tandem with its twin, Sentinel-A, which was launched in 2016, so that their observations can be cross calibrated. The spacecraft are part of a series of Sentinel satellites under the umbrella of the EU's Copernicus program, which takes a continuous "health check" of our planet.
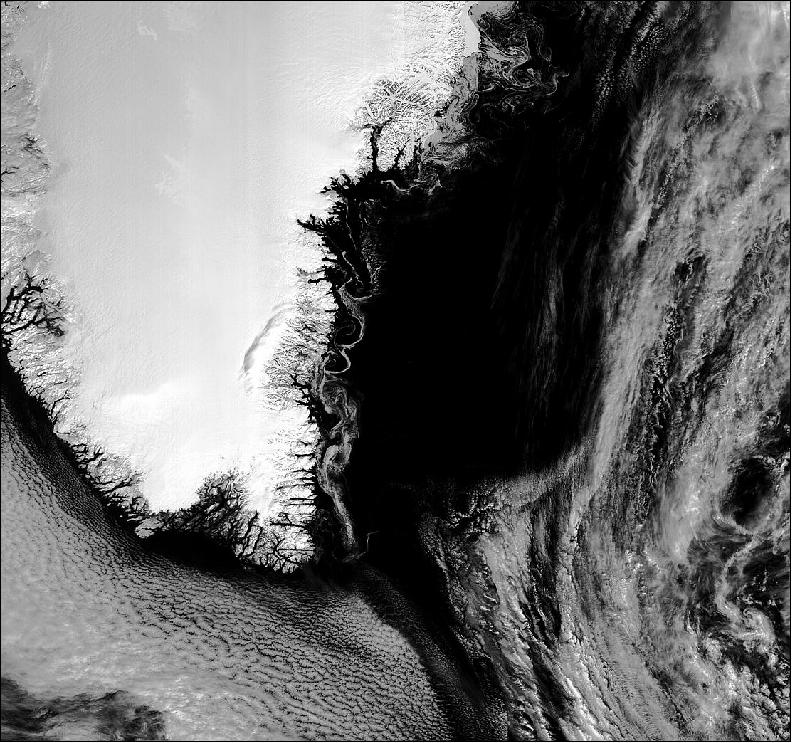
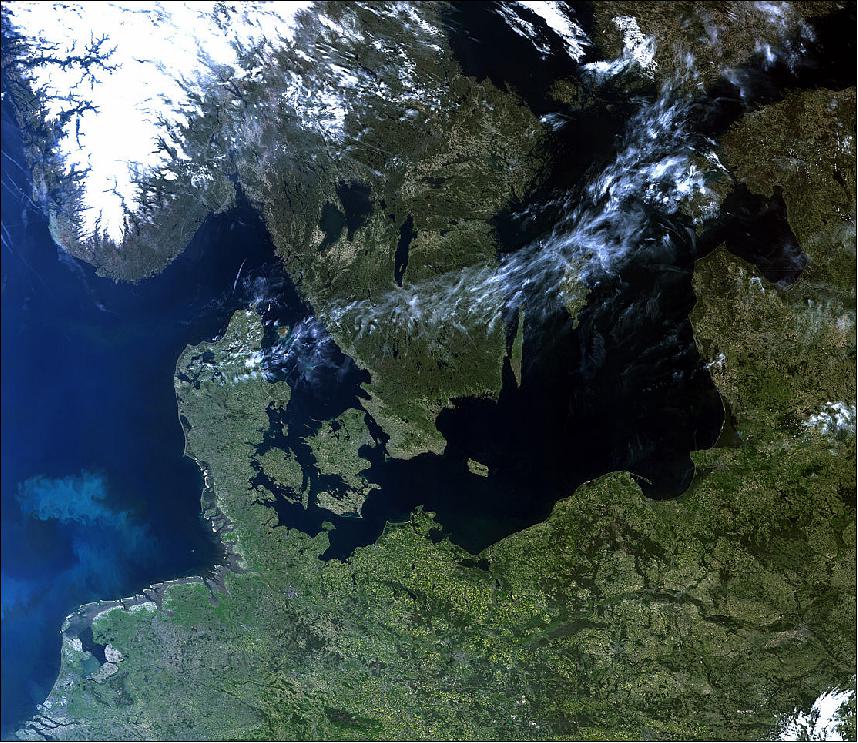
• May 9, 2018: Less than two weeks after it was launched, the Copernicus Sentinel-3B satellite has delivered its first images of Earth. Exceeding expectations, this first set of images include the sunset over Antarctica, sea ice in the Arctic and a view of northern Europe. 20)
- The very first image, captured on 7 May at 10:33 GMT , shows the transition between day and night over the Weddell Sea in Antarctica. The satellite also captured swirls of sea ice off Greenland on the same day. Another in this first set of images offers a rare cloud-free view of northern Europe. They were taken by OLCI (Ocean and Land Color Instrument) on Sentinel-3B.
- Josef Aschbacher, ESA's Director of Earth Observation Programs, said, "The launch of Sentinel-3B completed the first batch of Sentinels that we are delivering for Copernicus. We finished the launch and early orbit phase in a record time and we are now getting on with the task of commissioning the satellite for service. These first images from the ocean and land color instrument already show how the satellite is set to play its role in providing a stream of high-quality environmental data to improve lives, boost the economy and protect our world."
- Over oceans, OLCI measures the temperature, color and height of the sea surface as well as the thickness of sea ice. These measurements are used, for example, to monitor changes in Earth's climate and for more hands-on applications such as for monitoring marine pollution. Over land, this innovative mission monitors wildfires, maps the way land is used, checks vegetation health and measures the height of rivers and lakes.
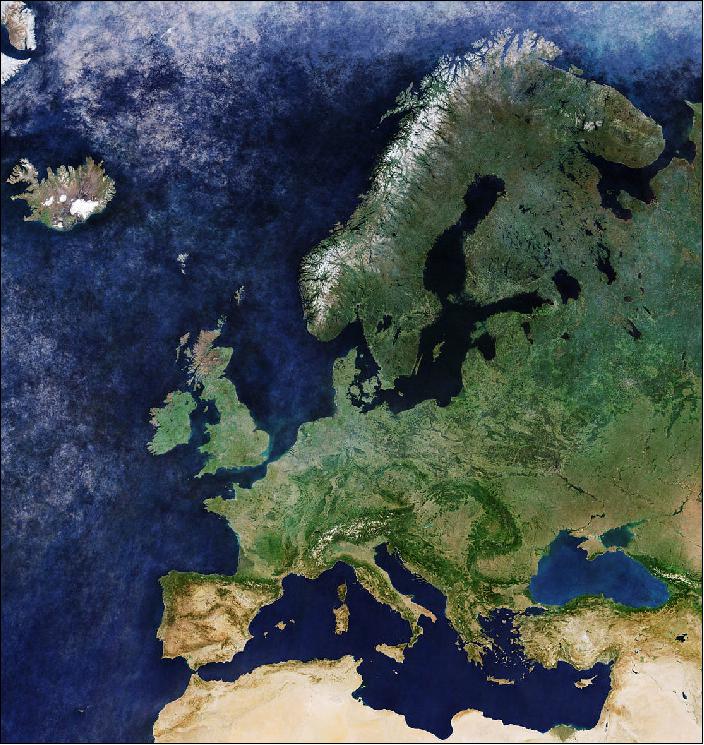
• April 27, 2018: This mosaic of cloud-free images from the Copernicus Sentinel-3A satellite spans the entire continent of Europe, and more. The view stretches from Iceland in the northwest across to Scandinavia and Russia in the northeast, and from the northern tips of Norway and Finland to as far south as Algeria, Libya and Egypt. 21)
- While the satellite's OLCI (Ocean and Land Color Instrument) depicts the green of summer in many parts of Europe, the dryness that summer brings, particularly to the south, can also be seen in parts of Spain, Italy and Turkey, for example.
- This week, aerospace fans have had their eyes firmly set on the ILA Berlin Air Show in Germany. Berlin lies in the center of the image (Figure 21). Here, participants have been learning about new space technologies as well as being treated to latest results from satellite missions such as ESA's Gaia, which has been used to chart the position, brightness and motion of more than a billion stars. With the second Sentinel-3 satellite, Sentinel-3B, lifting off from Russia this week, the focus has also been this latest Copernicus mission.
- Like Gaia maps stars thousands of light-years away to understand the Universe, the Sentinel-3 mission observes our home planet to understand large-scale environmental dynamics. Based on a constellation of two identical satellites, the Sentinel-3 mission carries a suite of instruments to measure our oceans, land and ice.
- Over land, this innovative mission is being used to map the way land is used, provide indices of vegetation, monitor wildfires and measure the height of rivers and lakes. Over oceans it measures the temperature, color and height of the sea surface as well as the thickness of sea ice.
• April 26, 2018: With the launch of Sentinel-3B, the first set of Sentinels for Copernicus is now in orbit delivering an almost mind-boggling amount of data. While this wealth of information advances environmental monitoring, it also opens up huge business opportunities. To help bring these data to market, ESA and SAP have joined forces to create the World Space Alliance. SAP (Systems, Applications & Products in Data Processing) is a German-based (HQs in Walldorf) European multinational software corporation that makes enterprise software to manage business operations and customer relations. 22)
- ESA and SAP first teamed up two years ago to close the gap between traditional Earth observation and the digitalized business world. Building on this fruitful partnership, the two organizations today signed another agreement to strengthen the use of digital technologies and Earth observation data for a range of business sectors.
- Josef Aschbacher, Director of Earth Observation Programs at ESA, said, "Data from the Sentinels are, of course, open and freely available to everybody, but through our partnership with SAP we are working on making data products that businesses can easily tap into."
- The World Space Alliance will be powered by the SAP Cloud Platform. In turn, ESA also benefits from the platform's big-data handling and dissemination capabilities. The data it uses will come primarily from the Copernicus Sentinel missions, but also from other satellite missions that contribute to Copernicus.
- The agreement was signed at the ILA Berlin Air Show on 26 April 2018, this new agreement paves the way to strengthen the use of digital technologies and Earth observation data for a range of business sectors.
• April 26, 2018: ESA's mission control team keeping a close watch on the launch and progress of Sentinel-3B as it joined its identical twin, Sentinel-3A, to complete a constellation that will provide global monitoring of Earth's oceans, land, ice and atmosphere for Europe's Copernicus environmental monitoring program. 23)
- Europe's Copernicus program now has three complete two-satellite constellations in orbit plus an additional single satellite, Sentinel-5P, a mission to monitor air pollution.
- At the end of the commissioning phase, encompassing the first five months in orbit to test the functionality of the satellite, ESA will hand over operations of the satellite to EUMETSAT. ESA and EUMETSAT manage the mission jointly with ESA producing land products and EUMETSAT marine products for application through the Copernicus services.
" For users of Sentinel-3 data, we need to provide measurements from both Sentinel-3A and Sentinel-3B. This means that we need to harmonize the measurements from both satellites so that there are no differences in terms of their calibration. This is why we have a tandem phase of the Sentinel-3 mission. The ocean and the atmosphere are "seen" together by the sensors of the two satellites and they can change quite rapidly. The further in time the satellites are apart, the larger those variations can be and they are difficult to remove from our measurements. We want to minimize those variations when synchronizing the calibration of our Sentinel-3 instruments. If we fly our satellites close together then the atmosphere and the ocean are for all practical purposes the same. Then, when we compare the data from each satellite, we can be confident that we are looking at differences that are related to the instruments rather than to instruments and the ocean and atmosphere signal variability. The tandem was proposed to address the Global Climate Observing System (GCOS) Climate Monitoring Principles that require a tandem phase for inter-calibration purposes. As we have a Copernicus Climate Change Service, we need to address these type of climate-related requirements. Sentinel-6 will operate a 12-month tandem phase with Jason-3 in a similar manner. This is because small differences in the satellite calibrations matter for sea level rise monitoring. " |
- In two years since its launch, the Sentinel-3A satellite has delivered over 500 Terabytes of data about the Earth's oceans, land, ice and atmosphere. Its free and open data has allowed us to improve our understanding of large-scale global dynamics beyond expectations. Now, after two years of a solo journey, the Sentinel-3A finally has a twin – Sentinel-3B (Ref. 24).
• April 25, 2018: Just 92 minutes after liftoff, Sentinel-3B sent its first signals to the Kiruna station in Sweden. Data links were quickly established by teams at ESA's operations center in Darmstadt, Germany, allowing them to assume control of the satellite (Ref. NO TAG#.
- During the three-day launch and the early orbit phase, controllers will check that all the satellite's systems are working and begin calibrating the instruments to commission the satellite. The mission is expected to begin routine operations after five months.
- "This is the seventh launch of a Sentinel satellite in the last four years. It is a clear demonstration of what European cooperation can achieve and it is another piece to operating the largest Earth observation program in the world, together with our partners from the European Commission and EUMETSAT," said ESA Director General Jan Wörner.
- With this launch, the first set of Sentinel missions for the European Union's Copernicus environmental monitoring network are in orbit, carrying a range of technologies to monitor Earth's land, oceans and atmosphere.
- ESA's Director of Earth Observation Programs, Josef Aschbacher, said, "With Sentinel-3B, Europe has put the first constellation of Sentinel missions into orbit – this is no small job and has required strong support by all involved. It allows us to get a very detailed picture of our planet on a daily basis and provides crucial information for policy makers. "It also offers lots of opportunities for commercial companies to develop new innovative services. And, the free and open data policy allows every citizen to have updates for their own use. When we designed such a satellite constellation 20 years ago not everyone was convinced Europe could do that. I am glad to see this has become reality and that it is now a large European success story."
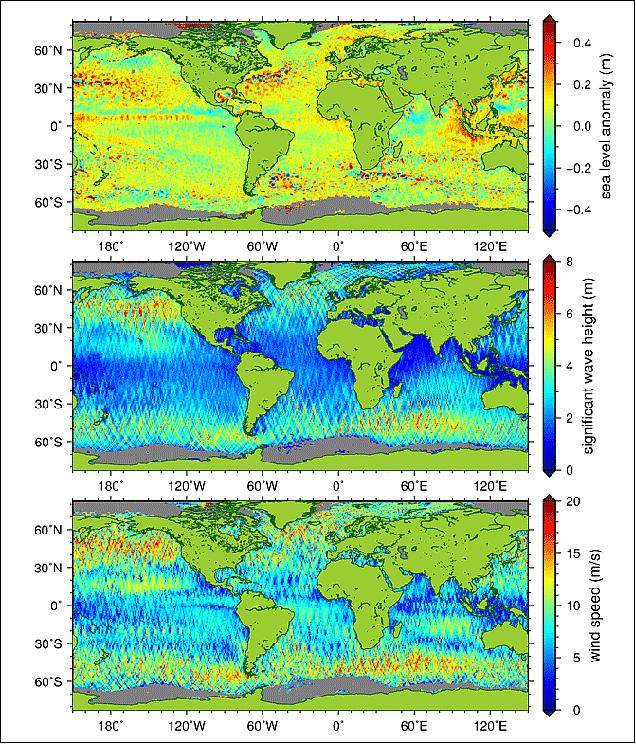
• April 13, 2018: EUMETSAT collects and disseminates data from three instruments carried by the Sentinel-3 satellites. They are: OLCI (Ocean and Land Color Instrument), SLSTR (Sea and Land Surface Temperature Radiometer), and SRAL (Synthetic Aperture Radar Altimeter). The SRAL instrument has been designed to deliver accurate measurements of sea surface height, significant wave height and surface wind speeds over the world's oceans. 25)
- Sea level rise is an important indicator of climate change. Globally, the sea level has been rising by an average of just over 3mm per year for the past 20 years. However, the rise is not uniform – it varies considerably around the world. Additionally, the rate of sea level rise is increasing by about 1mm per year each decade. This suggests that by the end of the century the sea level could have risen by as much as 65cm more than current projections.
- EUMETSAT Project Scientist and Altimetry Expert Remko Scharroo said the SRAL measures an array of important data in addition to sea level. "Sea surface height data from the satellite's altimeter have significantly improved our capability to analyze and forecast ocean currents," Scharroo said. "This is essential for the applications we serve such as marine safety, ship routing and predicting the fate of marine pollution events. Another set of data maps significant wave height, which again is important information needed for ship safety. Finally, the SRAL also provides accurate topography measurements over sea ice, ice sheets, rivers and lakes."
- The successful launch of Sentinel-3B at the end of April will represent the full deployment of the Sentinel-3 mission. Sentinel-3A was launched in February 2016 and has been delivering observations for two years. The two satellites are needed to provide the full set of measurements required by users.
- This includes for use in ocean meteorology, which is all about capturing significant wave height, wind speed and sea level measurements. Altimetry ensures the monitoring of ocean currents and eddies which carry a lot of energy throughout the ocean and interact with the atmosphere, thereby influencing the weather.
- An important example is the forecasting of hurricanes. Altimeters can help derive the latent heat in oceans. "You might argue that the SLSTR instrument does the same thing, that it measures heat in the ocean," Scharroo said. "But these are two different types of measurements entirely. "While sea surface temperature covers the total top layer of the ocean, it does not tell you much about the structure below. For this, you need altimeter measurements. Water expands when it's hot. The more heat penetrate the depth of the oceans, the higher the sea level rises and that will give you vital information about the column of water underneath. In short, the SLSTR provides information about the surface but not about the column of water underneath or the latent heat."
- Scharroo said both measurements were valid and important. "There is no competition between the instruments, believe me," he said. "It is in synergy that they work best."
• April 9, 2018: EUMETSAT operates the Sentinel-3 satellites on behalf of the EU and delivers the marine mission. 26)
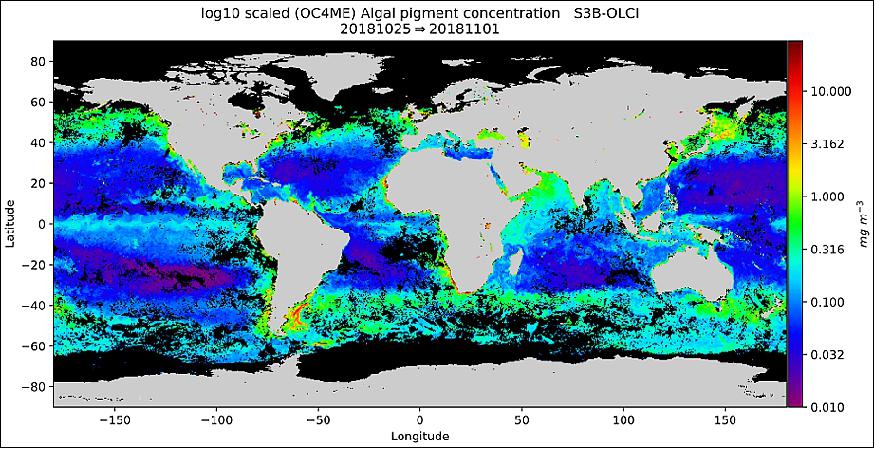
- Ocean Color data can be used for a wide variety of purposes. They can help to track and forecast harmful algal blooms, which can endanger humans, marine or freshwater life and aquaculture. These data also support the monitoring of coastal water quality, by tracking eutrophication, nuisance blooms, sedimentation and erosion.
- Ocean color data are also of a truly global importance as they help monitor climate change: ocean color is one of the so-called Essential Climate Variables (ECV) listed by the WMO (World Meteorological Organization) that help detect changes in biological activity in the ocean's surface layer.
- Ewa Kwiatkowska, EUMETSAT Remote Sensing Scientist explains: "Phytoplankton take up carbon dioxide (CO2) during photosynthesis, making the ocean the most important carbon sink. Alternatively, ocean color data can be used to monitor the annual global uptake of CO2 by phytoplankton on a global scale."
- Observations of ocean color support many industries, including fisheries and aquaculture, because of the phytoplankton role at the base of the aquatic food chain. They also support studies of the Earth system, for instance through monitoring El Niño/La Niña events and their impacts on ocean living ecosystems.
- She added: "Ocean color data can aid reporting obligations of the European Union's legislation within Marine Strategy Framework Directive and Water Framework Directive, the goal of which is to achieve or maintain Good Environmental Status of the seas by the year 2020."
- To ensure a steady flow of these vital data, two Sentinels are a must as Kwiatkowska explains. "Harmful outbreaks of algal bloom, require constant and consistent monitoring and forecasting from the OLCI instrument. With a cloud cover and gaps in coverage between successive orbits, there could be a discontinuity in the observations – with possibly detrimental effects.
- She continued "Also, there is a need to time phytoplankton blooms for ecosystem forecasts and to detect trends in eutrophication, where water body gets over-enriched with an excess amount of nutrients. This process induces growth of plants and algae and due to the biomass load, may result in oxygen depletion of the water body."
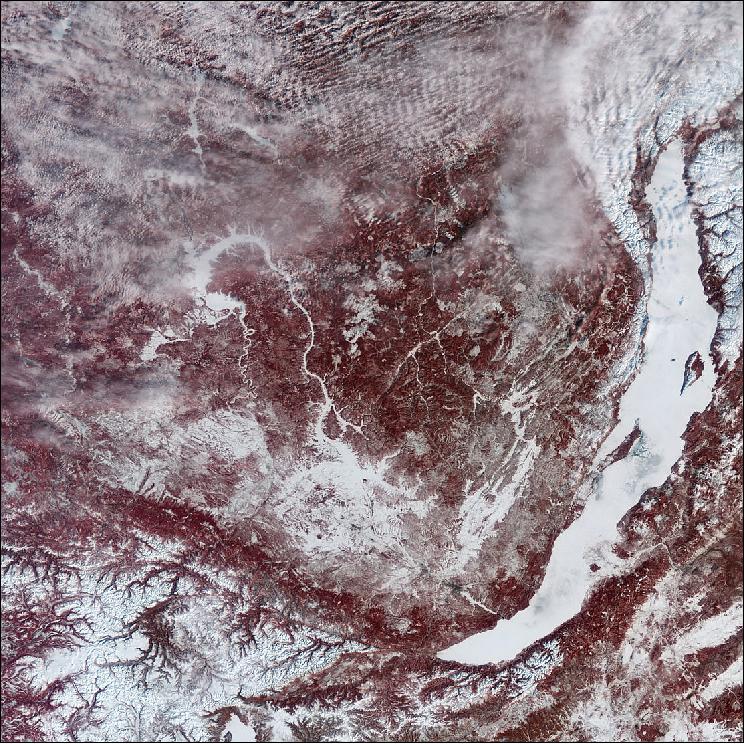
• April 6, 2018: The Copernicus Sentinel-3A satellite takes us over southern Siberia and the world's largest freshwater lake: Lake Baikal. Imaged on 14 March 2017, this deep lake is covered by ice. The entire lake is typically covered between January and May and in some places the ice can be more than 2 m thick. 27) 28)
- Holding around 23 000 km3 of water, Lake Baikal is the largest freshwater lake by volume in the world. It contains about 20% of the world's fresh surface water, which is more than all of the North American Great Lakes put together. Baikal water is extraordinarily clean, transparent and saturated with oxygen. The high transparency is thanks to numerous aquatic organisms purifying the water and making it similar to distilled water.
- At 25 million years, this remarkable lake is also the oldest in the world. It is known as the Galapagos of Russia because its age and isolation have produced rich and unusual water wildlife, which is of exceptional value to evolutionary science. Occasionally, new species are discovered and it has been estimated that we know of only 70–80% of all the species inhabiting the lake. For these reasons, in 1996 it was listed as a UNESCO World Heritage Site. The lake is surrounded by mountain-taiga landscapes, which are also protected to preserve their natural state.
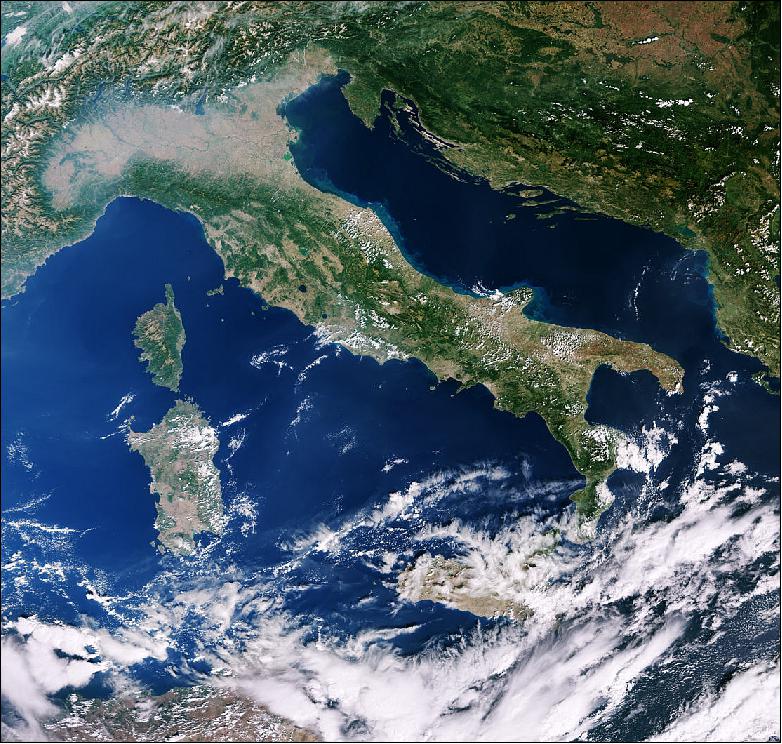
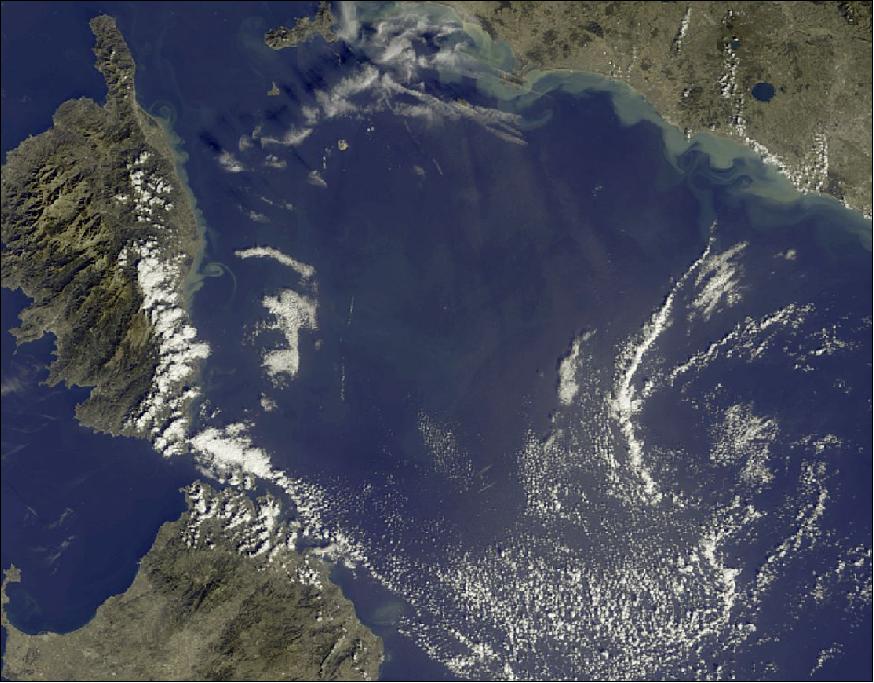
• March 9, 2018: The Copernicus Sentinel-3A satellite carries a suite of state-of-the art sensors that deliver a wealth of information to monitor our changing world, but this image was captured with its OLCI (Ocean and Land Color Instrument) . With a swath-width of 1270 km, this instrument delivers images that can span several countries, as we see here. 29)
- From east to west, the image features the islands of Corsica and Sardinia in the Mediterranean Sea, Italy and across the Adriatic Sea to Croatia, Bosnia and Herzegovina, Serbia, and to the western edges of Romania. To the north and partly obscured by clouds, lie Germany, Switzerland, Austria and the Alps.
- South of the Alps, haze hovers over Italy's Po Valley. Following the Po River to the east, the sediment it carries can be seen entering the Adriatic Sea. In fact, sediments line most of the eastern coast of Italy, giving it a greenish blue frame, while the western coast is mostly sediment-free.
- As the colors in this image suggest, the camera can be used to monitor ocean ecosystems and vegetation on land – all of which will bring significant benefits to society through more informed decision-making.
- Sentinel-3A will soon be joined in orbit by its twin Sentinel-3B, which is scheduled for liftoff from Russia on 25 April. The pairing of identical satellites provides the best coverage and data delivery for Europe's Copernicus program – the largest environmental monitoring program in the world.
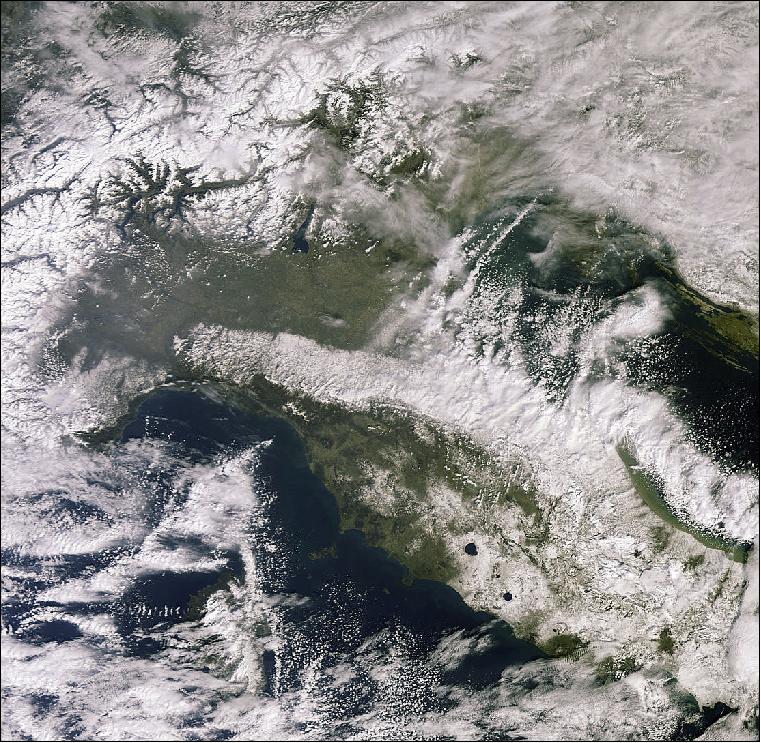
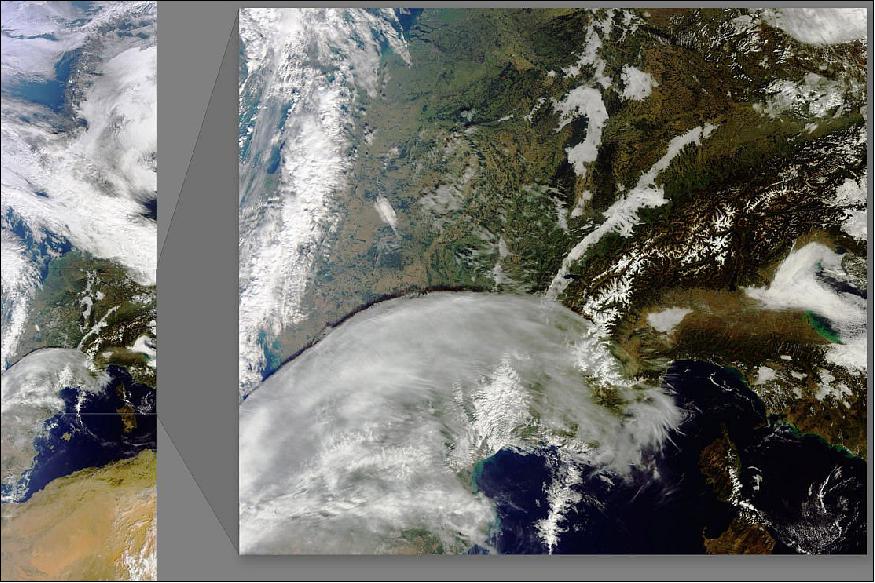
• February 28, 2018: Italy is usually associated with relatively warm weather, but this week it, too, has fallen victim to the cold snap nicknamed the Beast from the East. 30)
- Freezing temperatures carried on winds from Siberia have brought snow to much of Europe, causing widespread disruption. As this image captured on 27 February by the Copernicus Sentinel-3A satellite shows, Italy in southern Europe was not spared. Temperatures in Rome (bottom right of the image) are normally between 6°C and 14°C, but this week it has been down to –5°C during the night, and it is the first time the city has seen snowfall in six years. Naples also had its heaviest snowfall in decades.
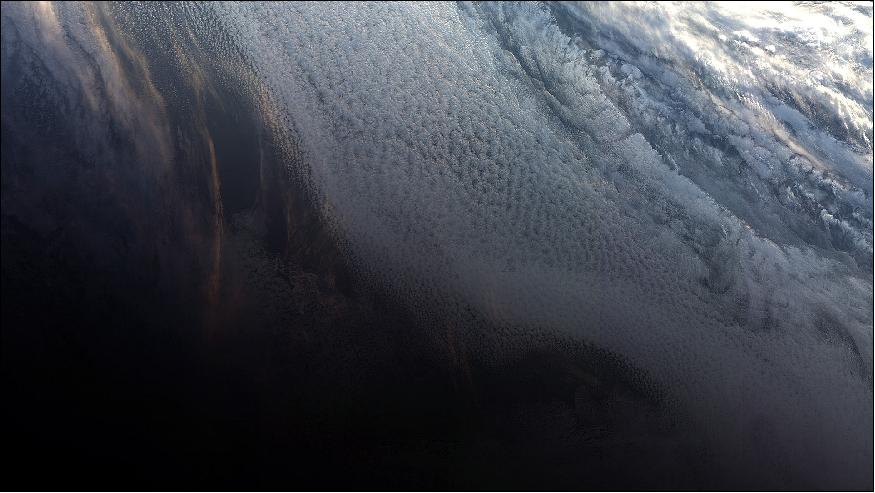
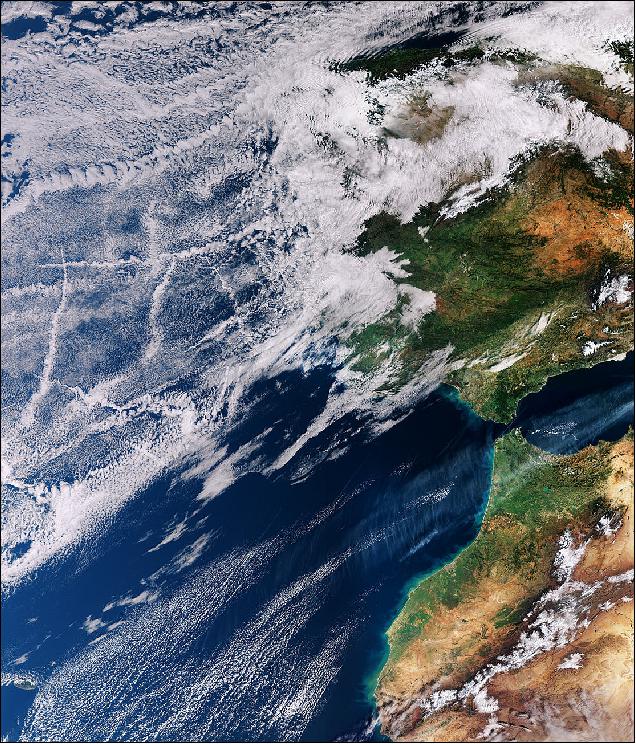
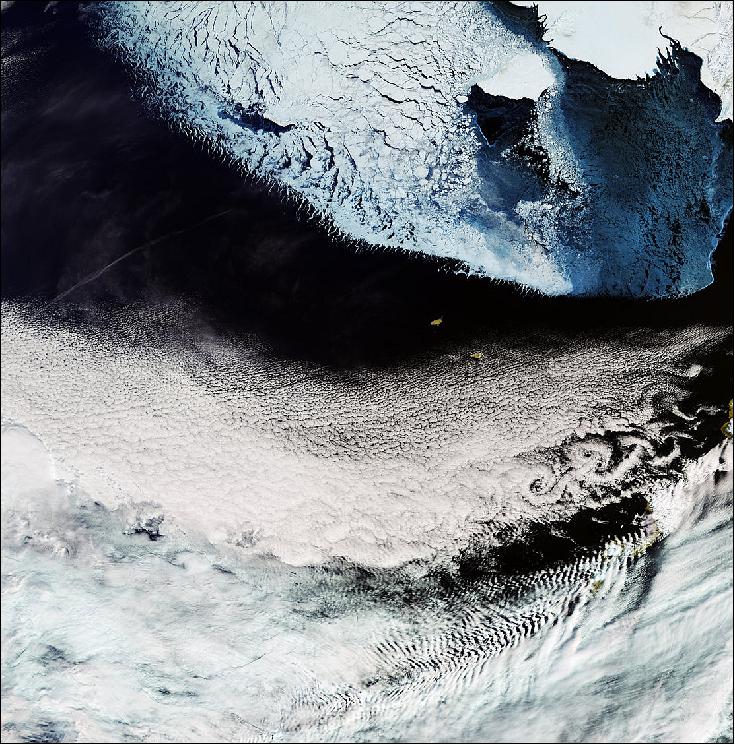
• February 9, 2018: The Copernicus Sentinel-3A satellite takes us over the Atlantic Ocean close to Spain and Portugal where the sky not only features clouds but also crisscross tracks from maritime vessels. 31)
- The familiar condensation trails – or contrails – we see in the sky usually come from aircraft, so it might seem strange that ships can also occasionally leave their mark in the sky. This rarely seen maritime twist on aircraft contrails was captured by Sentinel-3A on 16 January 2018. Known as ship tracks, these narrow cloud streaks form when water vapor condenses around small particles that ships emit in their exhaust fumes. They typically form when low-lying stratus and cumulus clouds are present and when the air surrounding the ship is calm.
- Like aircraft contrails, ship tracks may also play a role in our climate by reducing the amount of sunlight that reaches Earth's surface or conversely by trapping the Sun's radiation in our atmosphere – but this remains an uncertain aspect of climate science.
- The Copernicus Sentinel-3A satellite carries a suite of sensors including OLCI (Ocean and Land Color Instrument), which was used to capture this image of Figure 27.
• January 11, 2018: Wave information is crucial for people working at sea, to be able to navigate and operate safely. A new product based on satellite altimeter data detailing ‘Significant Wave Height' now enables this. 32)
- High waves are not only dangerous but can threaten delicate procedures at sea, so wave information is paramount for operating safely and efficiently. For instance, in oil and gas offshore platform operations, historic data and forecasts of wave heights are vital for the safety of personnel, equipment and the environment.
- Marine renewable energy operations and site studies require similar information on waves and ship routing can also be improved by such forecasts.
- In physical oceanography, the SWH (Significant Wave Height) is defined traditionally as the mean wave height (trough to crest) of the highest third of the waves. This mathematical definition of ocean wave height is intended to express the height that would be estimated by a trained observer, capturing the most significant waves over the water surface.
- Satellite wave measurements come from two main sources: altimetry and SAR (Synthetic Aperture Radar). The SWH can be obtained through altimetry and directional and spectral information with SAR.
- CMEMS (Copernicus Marine Environment Monitoring Service) released the first realtime global wave product based on satellite data, broadening its offer—previously based on numerical wave forecast models. Released in the summer of 2017, this new product from satellite altimeter data contains the Significant Wave Height from Jason-3 and from the Copernicus Sentinel-3A satellite altimeter data, provided within three hours after data acquisition.
- It provides quality-filtered and inter-calibrated along-track high-resolution SWH (one measurement every 0.7 km, or every second). These measurements contribute to global ocean coverage along the satellite ground tracks with 0.7 km resolution.
- Such satellite wave products represent actual measurements of the waves, covering the entire Earth, regularly and homogeneously over several years. They often offer a better portrayal of extreme events, which numerical models tend to under estimate.
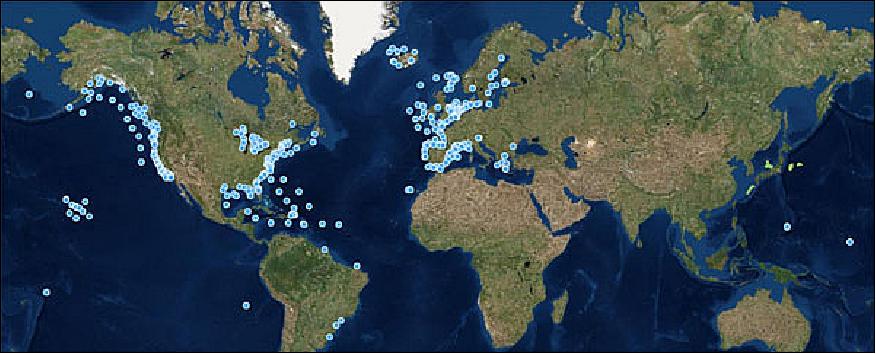
- In-situ wave data, typically provided by buoys, are similarly very helpful but in many open-water areas such moored buoys are not available, mainly due to the technical difficulty and cost of installing and maintaining them in deep ocean, far from the coast (Figure 28).
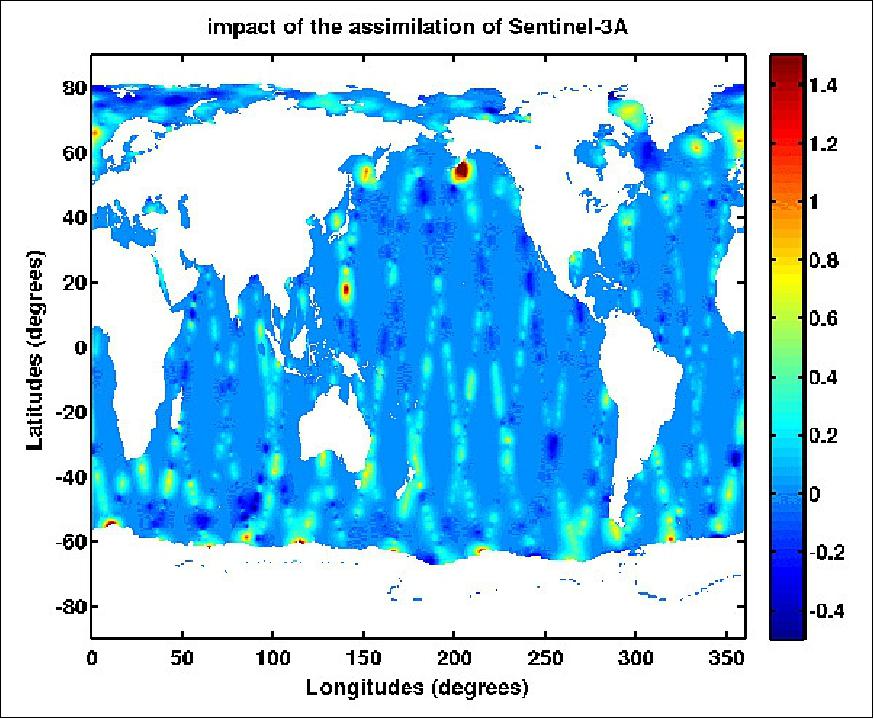
- Sentinel-3A's wave data are also assimilated into numerical realtime wave models to provide wave forecasts with better accuracy. For example, assimilation into the CMEMS global wave forecast model has a strong impact in the north-west of the Pacific Ocean related to the typhoon season and in the Gulf of Mexico after Hurricane Harvey (Figure 29).
- Dr Romain Husson, responsible for wave products at CLS for CMEMS, says, "In the first quarter of 2018, CMEMS will also deliver wave products derived from Sentinel-1A and -1B's SAR instruments. With respect to altimetry, SAR has the unique ability to measure the wave period and direction on top of the SWH and is particularly well suited for long waves, sometimes also referred to as swell."
• December 22, 2017: EUMETSAT has released a series of videos that provide training on how to access, download and manipulate Sentinel-3 marine data from its Copernicus Online Data Access (CODA) platform. - A set of three Copernicus Sentinel-3 marine user handbooks has also been published. They will enable end users to become familiar with the main features of products based on data coming from instruments onboard Sentinel-3. 33)
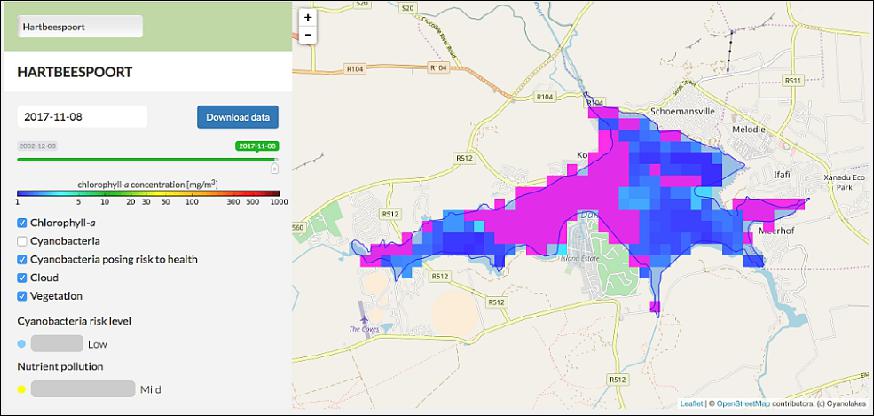
• December 21, 2017: Monitoring large, remote bodies of water is logistically challenging, time consuming and expensive. Responding quickly to events that pose a risk to human health has been almost impossible, given the size of some lakes and seas. An innovative satellite data service is now able to change things around. 34)
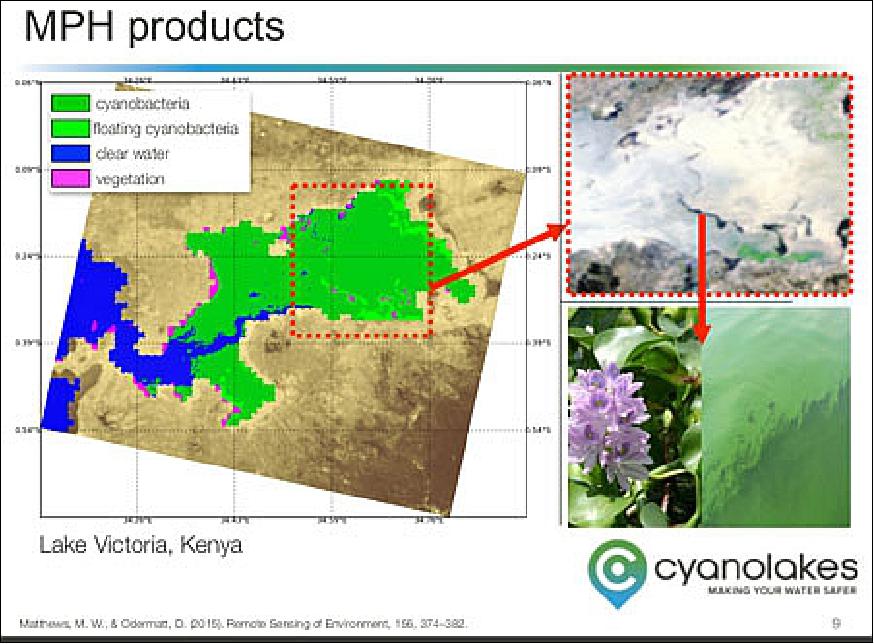
- Based on satellite remote-sensing data, CyanoLakes RealTime is an online monitoring and mapping service, designed by leading specialist scientists at CyanoLakes (Pty) Ltd. It significantly improves water and health authorities' ability to monitor, respond to and manage cyanobacteria, algal blooms and water weeds in both fresh and salt waters.
- Cyanobacteria blooms pose a serious health threat to humans and animals and are increasingly common due to pollution and a warming climate. Eutrophication can devastate natural ecosystems and increases the cost of water treatment.
- In October 2014, Mark Matthews won the Copernicus Masters Ideas Challenge for applications using satellites. He developed an algorithm able to distinguish between cyanobacteria and algae, which was recognized as a breakthrough in research and innovation, and also solved many of the challenges associated with using satellite data for routine monitoring applications.
- With his new algorithm, Dr. Matthews envisaged an online information service providing daily warnings on the health risks from cyanobacteria blooms. This would allow water and health authorities an unprecedented ability to monitor in near-real time for cyanobacteria and algal blooms, ultimately protecting the general public from this kind of pollution.
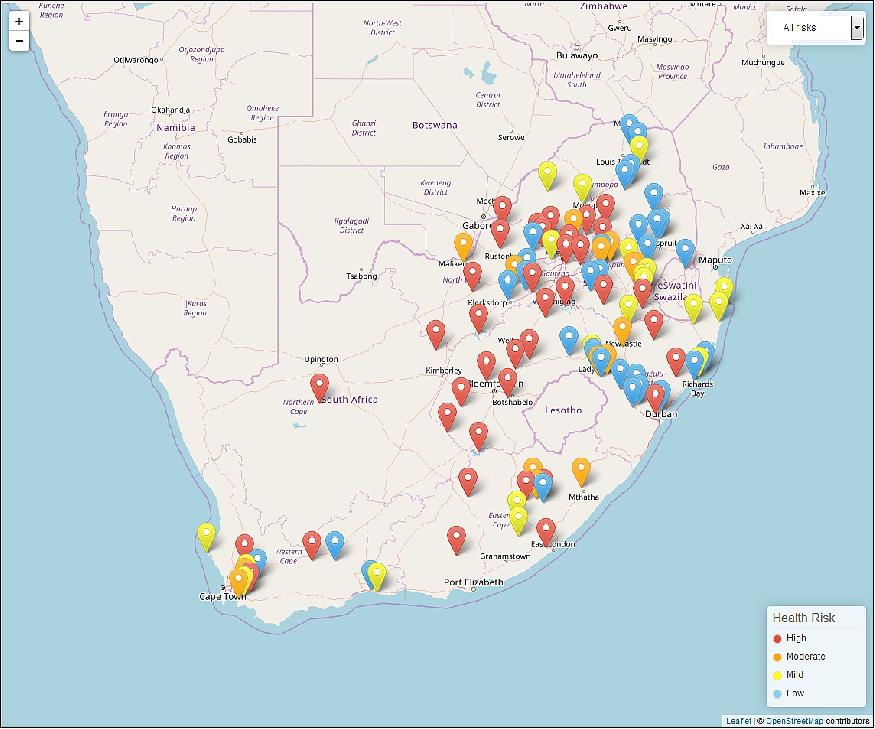
- In 2015, after being awarded with a research grant by the Water Research Commission, CyanoLakes (Pty) Ltd began working on a prototype for South Africa.
- The South African Department of Water and Sanitation became the first user of the prototype, using the information to fill gaps in their monitoring database and for reporting.
- In January 2017, following the public release of data from the Copernicus Sentinel-3 satellite, the prototype started to be used in near realtime operations, enabling a variety of solutions for many fields.
- These applications included filling information gaps in data-poor regions for water scientists and engineers, improving the safety of water sport events, providing aquaculture operators with warnings of harmful algal blooms to reduce economic losses, and wide-scale monitoring and mapping of cyanobacteria blooms and eutrophication for water and health authorities.
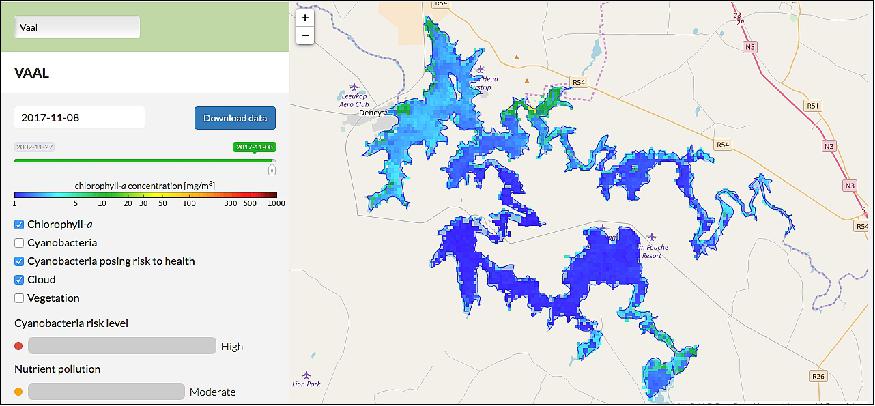
- The OLCI (Ocean and Land Color Instrument) on Sentinel-3A is currently the only sensor in space with the necessary spectral bands, radiometric sensitivity, spatial resolution and coverage for near realtime services related to the detection of cyanobacteria.
- Using the prototype service, the Department of Water and Sanitation was able to monitor the massive outbreak of the invasive water hyacinth at Hartbeespoort dam, which occurred during 2016–17.
- Dr Matthews said, "Sentinel-3 is the backbone of the CyanoLakes RealTime service, given its unique instrument characteristics. Without it, we could not provide our service to the market. We are excited about the launch of Sentinel-3B in 2018 because it will allow us to provide an even better service, with daily updates to clients anywhere around the globe."
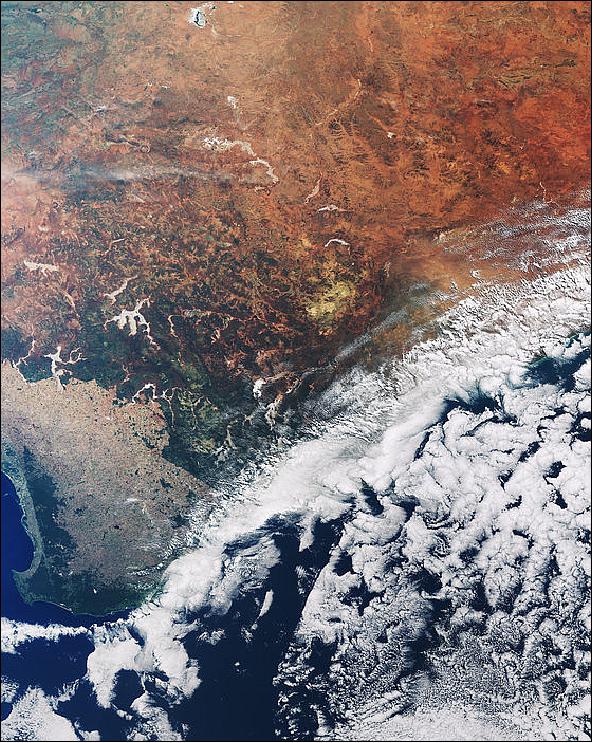
• November 3, 2017: From the fourth most populous city to the rugged Outback, the Sentinel-3A satellite gives us a wide-ranging view over Australia's southwestern corner. This perspective from space clearly illustrates human's influence on our environment: the agricultural landscape that dominates in the lower-left is suddenly interrupted by the more densely vegetated national parks and forests.
- The city of Perth is located on the coast along the left edge of the image (Figure 34). About 150 km north of Perth sits ESA's tracking station at New Norcia, where a 35 m diameter radio dish communicates with deep-space missions such as Rosetta and Mars Express.
- Moving further inland, grasslands give way to the deserts of Australia's vast and remote interior – known as the Outback – with a landscape dominated by red soil and sparse vegetation. Several large salt lakes are visible across the image in white, including the appropriately named Lake Disappointment by explorer Frank Hann in search of fresh water (top of image).
- Clouds over the ocean obstruct our view of the southern coast, but the lack of cloud cover over the interior desert pronounces the dry climate, which is a consequence of global wind patterns.
- Sentinel-3 offers a ‘bigger picture' for Europe's Copernicus program by systematically monitoring Earth's oceans, land, ice and atmosphere to understand large-scale global dynamics.
- While the satellite mission carries a suite of cutting-edge instruments, this image, also featured on the Earth from Space video program, was captured on 9 April 2017 by the satellite's OLCI (Ocean and Land Color Instrument), which helps to monitor ocean ecosystems, supports crop management and agriculture, and provides estimates of atmospheric aerosol and clouds.
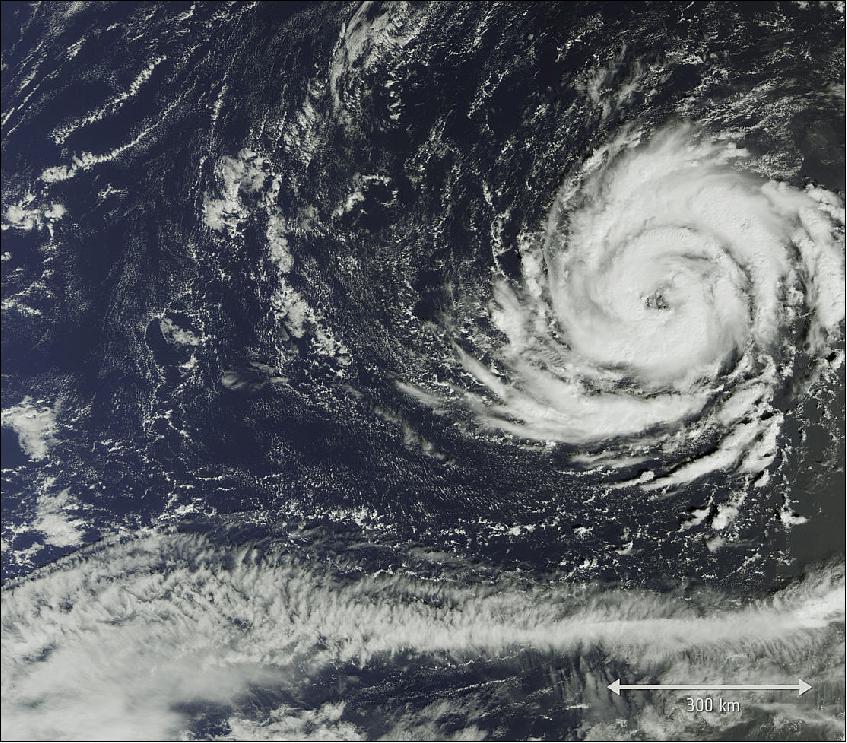
• October 12, 2017: The Copernicus Sentinel-3A satellite captured this image on 11 October 2017 (Figure 35), when Hurricane Ophelia was about 1300 km southwest of the Azores islands and some 2000 km off the African coast. 35)
- Originally classified as a tropical storm, it has been upgraded to a hurricane. The US National Hurricane Center said that Ophelia could become even stronger in the next days.
• On 28 August, 2017, EUMETSAT's near-real-time dissemination service went to the next level when EUMETSAT's CODA (Copernicus Online Data Access) service, became operationally available to users via the new single-sign on option. 36)
- It ensures that CODA users can access both Copernicus and data from EUMETSAT's Earth observation portal with one username and password.
- In combination with EUMETCast - a flexible multicasting service delivering the unified data streams from Copernicus and EUMETSAT's own missions, as well as EUMETview - an interactive visualization service especially for satellite imagery, EUMETSAT's data services provide solutions for a variety of different needs:
a) Sourcing Copernicus Data with CODA: EUMETSAT's CODA service is a rolling archive featuring a month's worth of Sentinel-3 data through an uncomplicated web interface as well as a scripting service, which allows users to automate bulk data downloads (within certain parameters).
After an extensive pilot phase, the CODA service is now fully available to users. CODA is particularly relevant for the ocean and remote sensing scientists, but its benefits reach beyond the scientific community. Developers in the public and private sector, be it for products or information services, can use CODA to develop innovative applications.
Hayley Evers King (Plymouth Marine Laboratory) summarizes her experience: "CODA is ideal for our daily business. It allows us to investigate specific areas and locate data for a particular region anywhere on the globe. This is, for example, useful when spotting algae blooms. The handling is particularly easy and follows a streamlined, user-friendly process. CODA allows us to select data without needing much experience. This is immensely helpful."
b) Data dissemination via EUMETCast: The vast majority of marine data from the Copernicus-3A satellite, operated by EUMETSAT on behalf of the European Union, are now available on EUMETCast. With this milestone, EUMETSAT's flexible multicasting service now delivers unified data streams to Copernicus users integrating observations from Copernicus and its own missions. This new marine data stream, involving products from Sentinel-3A, Jason-3, Metop and Meteosat creates a broad range of opportunities for the downstream development of applications, services and – ultimately – added value in Europe.
For Hayley Evers King (Plymouth Marine Laboratory) EUMETCast is important because "... it allows us to routinely and quickly access large amounts of data. We use it together with CODA and EUMETview; having these various sources of data access will increase the number of users for Copernicus data."
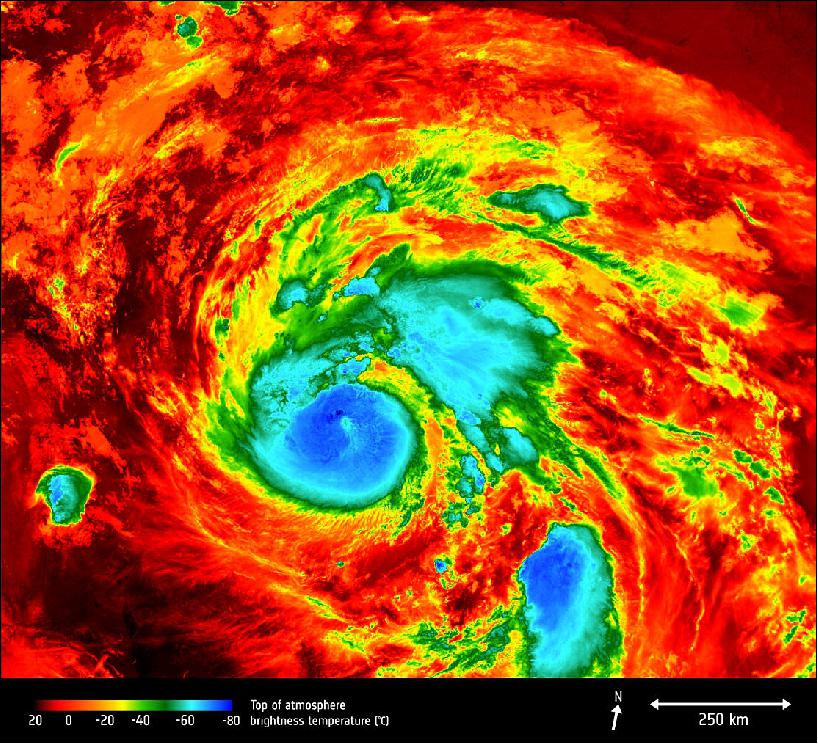
• August 25, 2017: The Copernicus Sentinel-3A satellite saw the temperature at the top of Hurricane Harvey on 25 August 2017 at 04:06 GMT as the storm approached the US state of Texas. The brightness temperature of the clouds at the top of the storm, some 12–15 km above the ocean, range from about –80°C near the eye of the storm to about 20°C at the edges. 37)
- Hurricanes are one of the forces of nature that can be tracked only by satellites, providing up-to-date imagery so that authorities know when to take precautionary measures. Satellites deliver information on a storm's extent, wind speed and path, and on key features such as cloud thickness, temperature, and water and ice content.
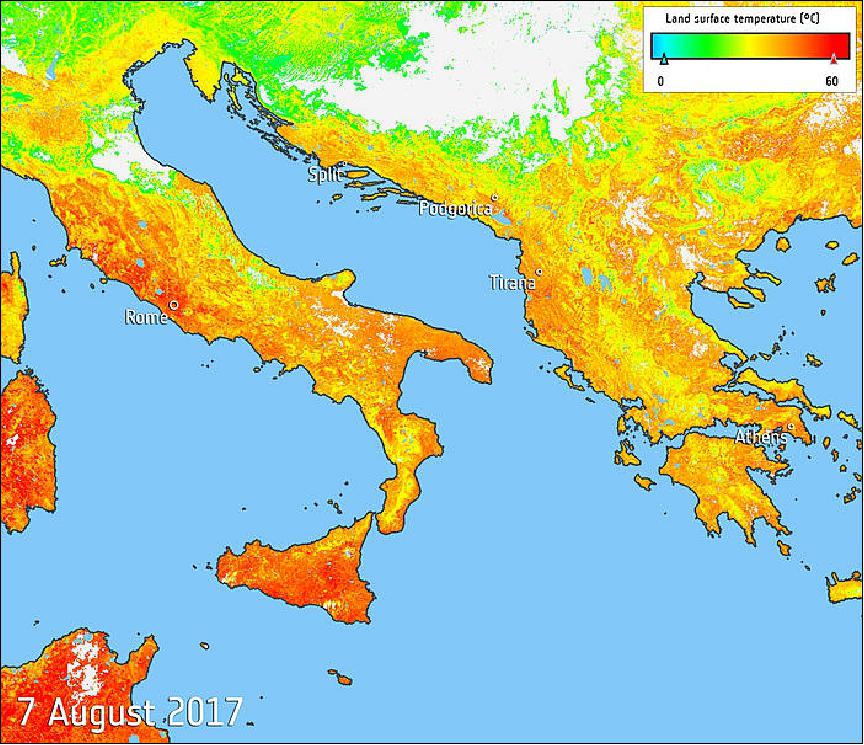
• August 11, 2017: Southern Europe is in the grip of a relentless heatwave, fuelling wildfires and water shortages. Information from the Copernicus Sentinel-3A satellite has been used to map the sweltering heat across the region. 38)
- The map of Figure 37 shows that on 7 August 2017, temperatures of the land surface rose above 40°C – not an usual occurrence over the last weeks. Much of Italy, including Rome, Naples, Florence, Sardinia and Sicily has been suffering these highs. With numerous towns and cities on the ministry of health's maximum heat alert, the Italians have aptly dubbed the heatwave ‘Lucifer'. Extreme temperatures have also been recorded in Spain and Portugal, the Balkans and Greece.
- As well as wildfires and water shortages, the heat has also led to some tourist attractions being closed, ill health and even some fatalities, and the drought is also threatening crops.
- The map uses data from the satellite's SLSTR (Sea and Land Surface Temperature Radiometer), which measures energy radiating from Earth's surface in nine spectral bands – the map therefore represents temperature of the land surface, not air temperature which is normally used in forecasts. The white areas in the image are where cloud obscured readings of land temperature.
• July 6, 2017: With the Copernicus Sentinel-3A satellite fully fledged and its data freely available, the task of monitoring and understanding our changing planet has been made that much easier. Seeing the effect spring has on our plant life is just one of its many uses. — Launched in February 2016 and carrying a suite of instruments, Sentinel-3 is the most complex of all the Sentinel missions. 39)
- As the workhorse mission for Europe's environmental monitoring Copernicus program, it measures Earth's oceans, land, ice and atmosphere systematically so that large-scale global changes can be monitored and understood. While Sentinel-3 offers this ‘big picture', it can also be used to monitor smaller-scale environmental issues such as urban heat islands.
- Sentinel-3 is well on the way to being at the heart of operational oceanography, but it also provides unique and timely information about changing land cover and vegetation health.
- For instance, the animation of Figure 38 uses information from the satellite's ocean and land color instrument to measure changing amounts of chlorophyll in plants. Here we clearly see the progress of spring greening in the northern hemisphere, for example.
- Since its initial commissioning, when the satellite and instruments were meticulously fine-tuned, Sentinel-3A has been in a ‘ramp up' phase. - This means that over the last year, while the satellite was being prepared for its life as a fully operational mission, only ‘direct instrument' data were available. Another step in the processing chain is needed to translate them into more tangible information for users worldwide.
- This milestone has now been passed so that the best quality data possible are now freely available from the satellite's ocean and land color instrument and from the sea and land surface temperature sensor, which measures energy radiating from Earth's surface.
- This level of data from its other instrument – a radar altimeter, which measures the height of the sea surface, rivers, lakes and land – have been available since last December.
- ESA's Sentinel-3 mission manager, Susanne Mecklenburg, explained, "Sentinel-3 is an extremely complex mission, and I'm very proud to say that it's delivering on its promise.
- "We have been working closely with our colleagues at Eumetsat to make sure it is ready to deliver top-quality data. This is important because while Eumetsat operates the satellite, both organizations manage the mission together.
- "ESA is responsible for the land data products and Eumetsat for the marine products – all of which are made available for the Copernicus services and other users. Measurements made by the satellite's color instrument over land now offer users key information to monitor the health of our vegetation, which is essential for agricultural practices, and to help plan resources. This also complements other missions such as the Copernicus Sentinel-2 and Proba-V. Together, they will be a powerful tool to map our changing lands."
- Sentinel-3 shows how Earth's surface temperature changes, which is also important for weather forecasting and for monitoring climate change. Over land, measurements can be used for urban planning, for example.
- Later in the year, data products will also be available for monitoring fires.
- More information is available at the Sentinel online website. There are a number of entry points to access data such as the Copernicus Open Access Hub.
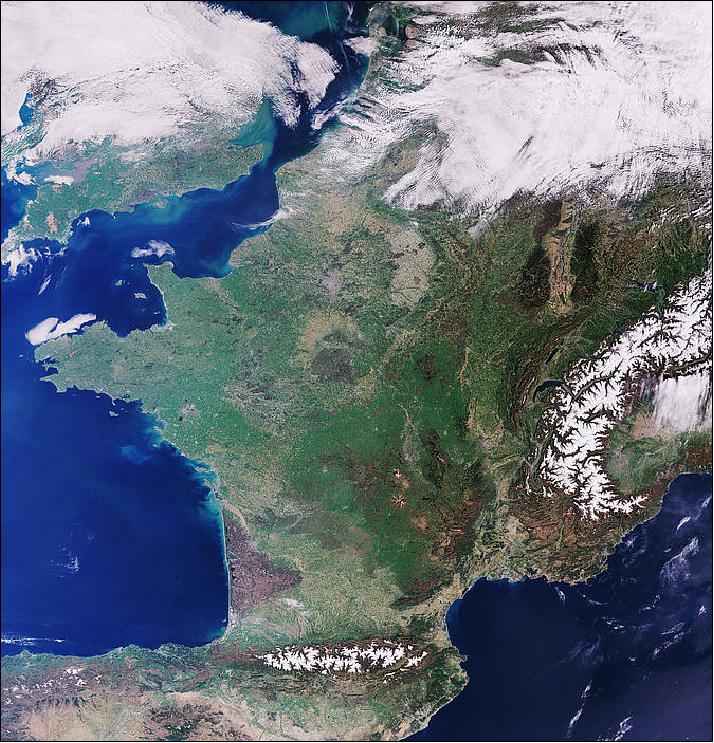
• June 23, 2017: Sentinel-3 gives us a nearly cloud-free view of France and the surrounding countries (Figure 41). Much of the landscape is covered with agricultural features. In fact, farmers manage nearly half of Europe's land area. While agriculture brings benefits for economy and food security, it puts the environment under pressure. Satellites can help to map and monitor land use, and the information they provide can be used to improve agricultural practices. 40)
- On the right side of the image we can see the snow-covered Alps, while the Pyrenees mountains are visible near the bottom.
- To the west of the Alps a green area of mountains and plateaus is visible, called the Massif Central. The region has more than 400 volcanoes, considered by scientists to be extinct.
- On the right side of the image, the light brown area flanked by dark areas is the Rhine River forming part of France's border with Germany. The dark area to the east is the Black Forest, while the dark area to the west are the Vosges Mountains.
- Just above the center of the image, we can see Paris – the site of ESA's headquarters as well as the Paris Air & Space Show taking place this week.
• April 27, 2017: The Copernicus Sentinel-3A satellite brings us over the Bering Sea, north of the Alaska Peninsula, on 26 March. Seasonal sea ice dominates the upper part of the image. Ice plays an important role in the sea's ecosystem. Growing algae attach to the bottom of the ice; when the ice melts in the spring, it leaves behind a layer of nutrient-rich freshwater on which the algae thrive. Organisms higher up the food chain then eat the algae. 41)
- In the top-right corner of Figure 42, we can see part of Alaska's mainland blanketed with snow, as well as Nunivak Island appearing like a massive piece of floating ice. At the center of the image are the islands of Saint Paul and Saint George – part of the Pribilof Islands. An estimated two million seabirds nest on these islands annually.
- The swirling clouds on the right side of the image are the result of a meteorological phenomenon known as a von Kármán vortex street. As wind-driven clouds pass over the Unimak Island on the right edge of the image, they flow around the high volcanoes to form the large spinning eddies that can clearly be seen in the image.
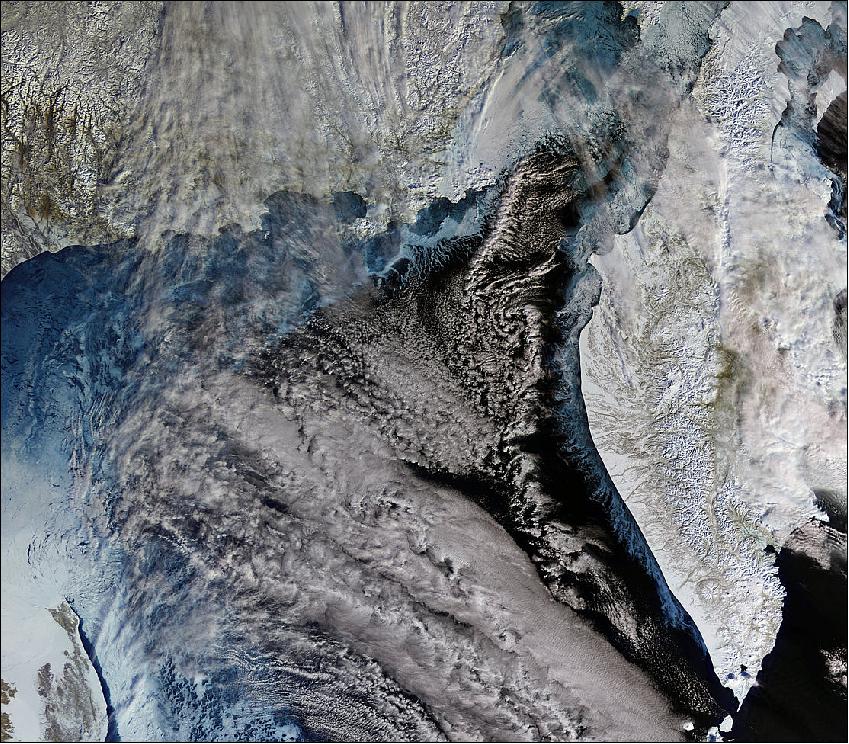
• March 10, 2017: A Sentinel-3 image in the Russian Far East and of the Kamchatka Peninsula is provided , located between the Pacific Ocean to the east and the Sea of Okhotsk to the west, where clouds blend with the ice and snow beneath from the bird's-eye view (Figure 43). One of the fascinating features is the pattern of floating sea ice, appearing in light blue. Along the left, one can see cracks in the ice covering the water. In the middle/right, small pieces of fragmented ice, driven by wind and currents, create the swirls of blue along the coast of the Kamchatka Peninsula. 42)
- Kamchatka, a 1250 km long peninsula with an area of 270, 000 km2, has a landscape covered with volcanoes due to its location along the highly active Pacific ‘Ring of Fire'. There are about 160 volcanoes on the peninsula, 29 of which are still active. The central mountain range running down the spine of the peninsula, is visible in the image, while the eastern range is mostly covered by clouds. Between them lies the central valley, appearing somewhat brown from the lack of snow cover.
- It is no surprise that the area is often referred to as the ‘land of fire and ice'. Owing to minimal development, the peninsula is known for its abundance of large brown bears. Other common animals include foxes, wolves, reindeer and wolverines.
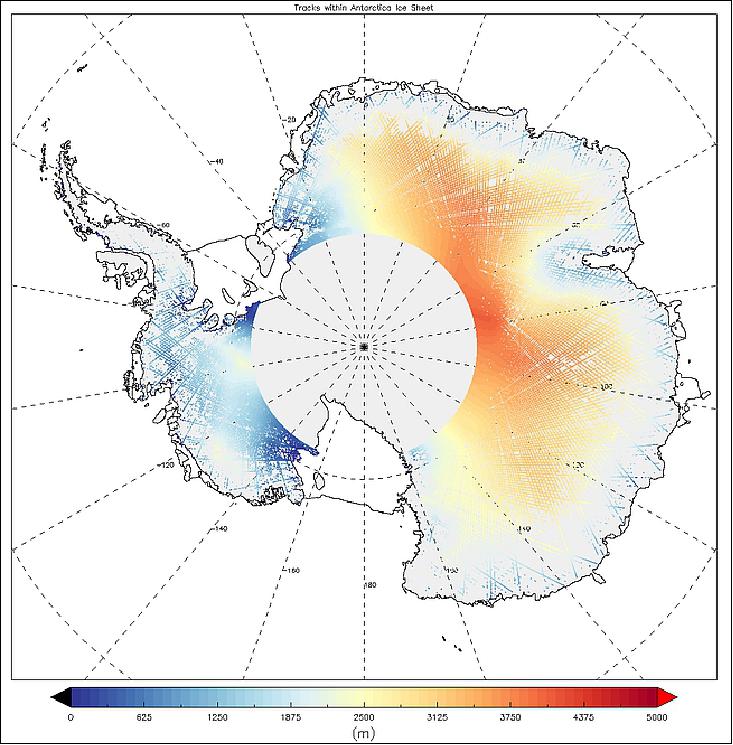
• December 13, 2016: Launched in February 2016 with a suite of cutting-edge instruments, Sentinel-3A is arguably the most comprehensive of all the Copernicus Sentinel missions. Since then, the satellite has been thoroughly tested and fine-tuned. This led to the release of its first Earth color data in October and first radiometer data last month. Now, the public also have access to data from its radar altimeter. 43)
- Sentinel-3A's topography package will bring a step change in satellite altimetry, measuring the height of the sea surface, waves and surface wind speed over the oceans. It also provides accurate topography measurements over sea ice, ice sheets, rivers, lakes and land. Over the oceans, the radar altimeter contributes information for forecasting, which is essential for safe maritime operations, for example. Monitoring sea-level change and diminishing Arctic ice is also important for monitoring the effects brought about by climate change.
- As the image of Antarctica shows (Figure 44), the radar altimeter is also important for measuring changes in the height of land ice. The data may seem relatively sparse at the moment, but this is because they only show a few days' readings. Accurately measuring changes in the height of the huge ice sheets that blanket Antarctica and Greenland is important for climate research and understanding sea-level change.
- ESA's CryoSat mission currently measures changes in ice height and paved the way for Sentinel-3's radar altimeter. Importantly, Sentinel-3's radar altimeter is the first to provide 100% coverage over all of Earth's surfaces in ‘synthetic aperture radar' mode. For accuracy, Sentinel-3's topography package also includes a microwave radiometer that is used to correct measurements from the radar altimeter affected by water vapor in the atmosphere.
- While changes in ice height may be relatively slow, the radar altimeter will also be used to measure changes that can be more abrupt, such as the height of water in lakes and rivers.
- The Sentinel-3 mission is managed jointly by ESA and EUMETSAT. The day-to-day operations of the Sentinel-3A satellite are carried out by EUMETSAT. ESA, as the developer of the mission, continues to monitor its health and performance. ESA is responsible for the land data products and EUMETSAT for the marine products – all of which are made available for application through Copernicus services.
• November 17, 2016: Following the release of Sentinel-3A's first Earth color data, the public now have access to data from the satellite's radiometer, which measures energy radiating from Earth's surface in nine spectral bands. Arguably the most comprehensive of all the Copernicus Sentinel missions, Sentinel-3A carries a suite of state-of-the-art instruments to systematically measure Earth's oceans, land, ice and atmosphere. 44)
- Since it was launched in February 2016, the satellite has been thoroughly tested and fine-tuned. This led to the release of first-level data from its OLCI (Ocean and Land Color Instrument) in October and now data from the SLSTR (Sea and Land Surface Temperature Radiometer) are also available.
- Information from the radiometer will be used to create global maps of SST (Sea Surface Temperature) for ocean and weather forecasting. Over land, the instrument will be used, for example, to detect heat stress, which is useful for improving agricultural practices and monitoring urban heat islands. As cities continue to expand, understanding how heat islands develop is important for planners and developers.
- Importantly, the radiometer has dedicated channels for measuring fires. This will help to assess damage and estimate recovery of burned areas.
- Further processing is needed to turn this kind of data (Figure 45) into actual ocean- and land-surface temperature maps. These next-stage data will start to be released in early 2017. Nevertheless, differences between the land, coasts and sea can be seen clearly in this brightness temperature image. — Data from the satellite's radar altimeter will be made available in December.
- While the day-to-day operations of the Sentinel-3A satellite are carried out by EUMETSAT, the mission is managed jointly by ESA and EUMETSAT. ESA is responsible for the land data products and EUMETSAT for the marine products – all of which are made available for application through Copernicus services.
• October 20, 2016: Today, the Copernicus Sentinel-3A satellite has taken another step towards being fully ‘operational' as the first data from its OLCI (Ocean and Land Color Instrument) are made available to monitor the health of our planet. Following its launch in February, the satellite and instruments have been thoroughly tested and fine-tuned – leading to this important milestone. - Carrying a suite of instruments, Sentinel-3A is arguably the most complex of all the Copernicus Sentinels. 45) 46)
- It has been designed to measure Earth's oceans, land, ice and atmosphere to monitor large-scale global dynamics and to provide critical near-realtime information for numerous ocean, land and weather applications.
- The Sentinel-3 validation team, a group of expert users, has been receiving sample products since May. Their feedback is essential to both ESA and EUMETSAT to ensure the data are of the highest quality, as is needed for the myriad of operational applications that the mission will serve.
- At the ‘end of commissioning' review in July, it was noted that a couple of points had to be addressed before the first data were officially released to the public.
- Susanne Mecklenburg, ESA's Sentinel-3 mission manager, said, "It is imperative that these first-level data are the best quality possible so we are being extremely careful. It is now very gratifying to see data from the satellite's Ocean and Land Color Instrument being released to users worldwide. "Data from the other two instruments – the SLSTR (Sea and Land Surface Temperature Radiometer) and SRAL (SAR Radar Altimeter) – will be made available in November and December, respectively."
- Offering new eyes on Earth, the OLCI (Ocean and Land Color Instrument) will monitor the global oceans, and inland waters, including phytoplankton, water quality, harmful algal blooms, sediment transport in coastal areas, El Niño and La Niña events, and climate change. It will also support observations of vegetation and crop conditions, as well as provide estimates of atmospheric aerosol and clouds – all of which bring significant benefits to society through more informed decision-making.
- While the operations of the Sentinel-3A satellite are carried out by EUMETSAT, the mission is managed jointly by ESA and EUMETSAT. ESA is responsible for the land data products and EUMETSAT for the marine products – all of which are made available for application through Copernicus services.
- Hilary Wilson, EUMETSAT's Sentinel-3 project manager, said, "The release of Sentinel-3A's first operational data is the culmination of a lot of hard work by ESA, EUMETSAT and the expert user teams. It represents an important milestone for the Copernicus Marine Environment Monitoring Service and also for the wider marine monitoring community. Routine operations of the satellite have been proceeding smoothly since EUMETSAT took over this responsibility in July and we are now focusing on bringing the remaining marine products to this community."
• October 2016: Commissioning phase results of the Sentinel-2A Optical Payloads. 48)
16 February 2016 | Successful launch |
18 February | LEOP completed |
26 February | Platform In-Orbit Verification completed |
04 March | Payload In-Orbit Verification completed |
07 March | CalVal Phase of Sentinel-3 commences |
April-May | Mid-Term Reviews for OLCI, SLSTR, SRAL |
End of May | Sample products to all users for familiarization |
28-30 June | Expert users meeting–first feedback from Sentinel-3 validation teams |
Mid-July | IOCR (In-Orbit Commissioning Review) successful completion of commissioning phase, start of ramp-up phase(initial operations) |
With the successful launch of Sentinel-3A, a new era for the Copernicus Services has started offering data over oceans and lands with unprecedented coverage. Together with Sentinel-3B, its twin satellite scheduled for launch in 2017, and later on with the launch/replacement of the Sentinel-3C and D units, a 20-year period of continuous observations is guaranteed. Among the five instruments embarked, the OLCI and SLSTR optical payload ensure the continuity of the ENVISAT mission with very much improved performance. During the calibration validation (CalVal) phase functional, performance, product verification and validation were performed confirming the overall excellent performance of the optical payload.
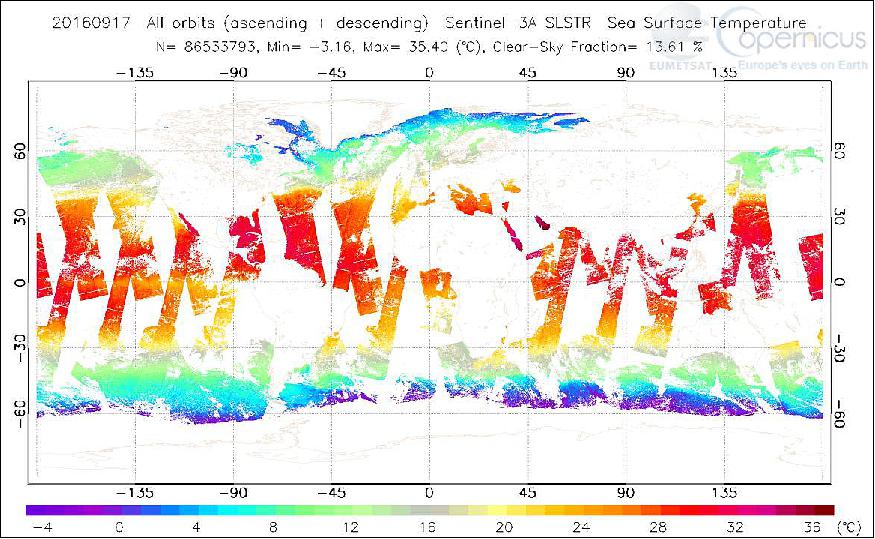
• September 30, 2016: The SLSTR (Sea and Land Surface Temperature Radiometer) visible channels onboard Sentinel-3A were turned on from 2nd March 2016 and the infrared channels on the 23rd March 2016. The first level 1 (L1b) data was released to expert and validation users on the 14th June 2016, with the level 2 (L2) data similarly released on the 21st June 2016. A successful commissioning review was held on the 12th July 2016, following this EUMETSAT resumed operations of the Sentinel-3A satellite. EUMETSAT processes Sentinel-3 marine data and products at its Sentinel-3 Marine Center, for real time delivery to end-users. 50)
- SST (Sea Surface Temperature) from SLSTR provides increased global coverage than AATSR due to an increased swath width (up to 1400 km) for both nadir only and dual (740 km) view scans. An example of the daily SST global coverage from Sentinel-3A for one day is shown in Figure 49.
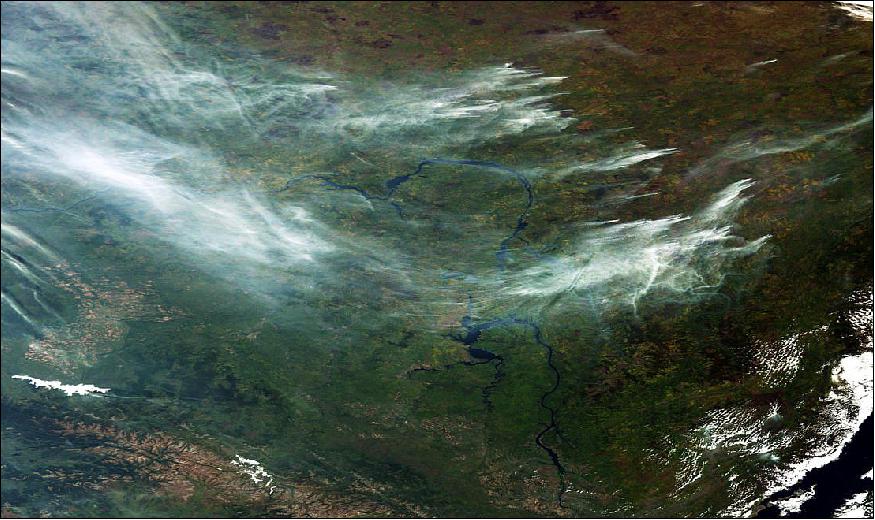
• Sept. 20, 2016: Wildfires break out in the boreal forests of eastern Russia most summers, but 2016 has been particularly bad, with numerous blazes since July. The image of Figure 50, which was taken by the Copernicus Sentinel-3A satellite on 14 September, shows smoke billowing from a string of fires northwest of Lake Baikal in Siberia. These huge smoke plumes stretch over 2000 km. It is thought that drier conditions associated with warmer weather – this June being the hottest on record – have contributed to the unusually large number of fires. 51)
• July 13, 2016: Getting the bigger picture on the health of our planet drew another step closer today as Europe's Sentinel-3A satellite was handed over to EUMETSAT for operations. -Since it was launched in February, the satellite and its instruments have been meticulously fine-tuned to make sure that everything is fit and ready for the task in hand: to systematically map Earth's surface for a myriad of services related to both the oceans and land. 52) 53)
- ESA's Bruno Berruti has been responsible for taking Sentinel-3A from the drawing board and into orbit ready for service. He said, "As the last phase of the ‘project', the handover signals the end to an intense five months during which we ensured the satellite and instruments are all working well so that they can start delivering routine data."
- "After only five months of commissioning, we have already released samples for most types of data products. The coming months will see a gradual ramp-up of our processing and data dissemination activities to make sure that the user community is served in the best possible way. The intention is to release first operationally qualified data products to all users in September."
- So while Sentinel-3A is well on the road to start delivering data that is expected to make unique contribution to the paradigm shift in monitoring our planet, ESA remains busy preparing its identical twin for launch in 2017.
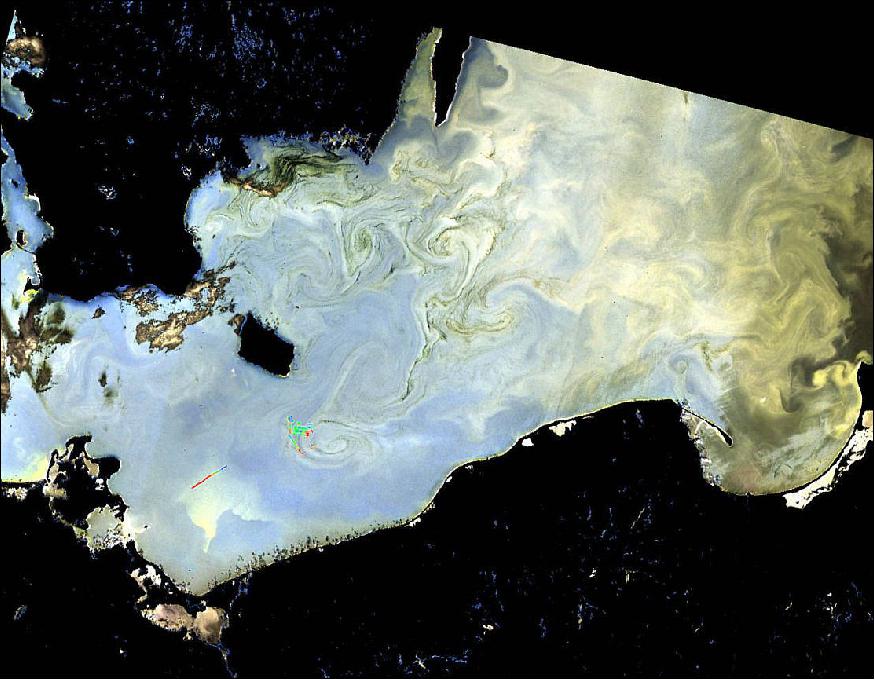
• April 6, 2016: Despite only being in orbit a matter of weeks, Sentinel-3A has already delivered some impressive first images. With the thermal-infrared channels now turned on, the satellite completes its set of firsts with a view of ocean features off the coast of Namibia. 54)
- The first image from the Sentinel-3A SLSTR (Sea and Land Surface Temperature Radiometer) thermal-infrared channels depicts thermal signatures over a part of western Namibia and the South Atlantic Ocean. This image shows the ‘brightness temperature', which corresponds to radiation emitted from the surface. Further processing is needed to turn this into an actual temperature map. The Namibian land surface is shown in red–orange colors, corresponding to a temperature range 301–319 K. The blue colors over the ocean correspond to a temperature range of 285–295 K. The black areas correspond to clouds, which are opaque to thermal-infrared radiation and so prevent a view of the ocean or land surface.
- Cold water is seen along the Namibian coast upwelling from deeper waters. The Benguela current flows north along the west coast of South Africa driven by southeasterly winds creating coastal upwelling. Many eddies and meanders are generated in this complex system and these small-scale features are captured beautifully by SLSTR. Understanding changes in the pattern of these waters is important for fisheries, for example.
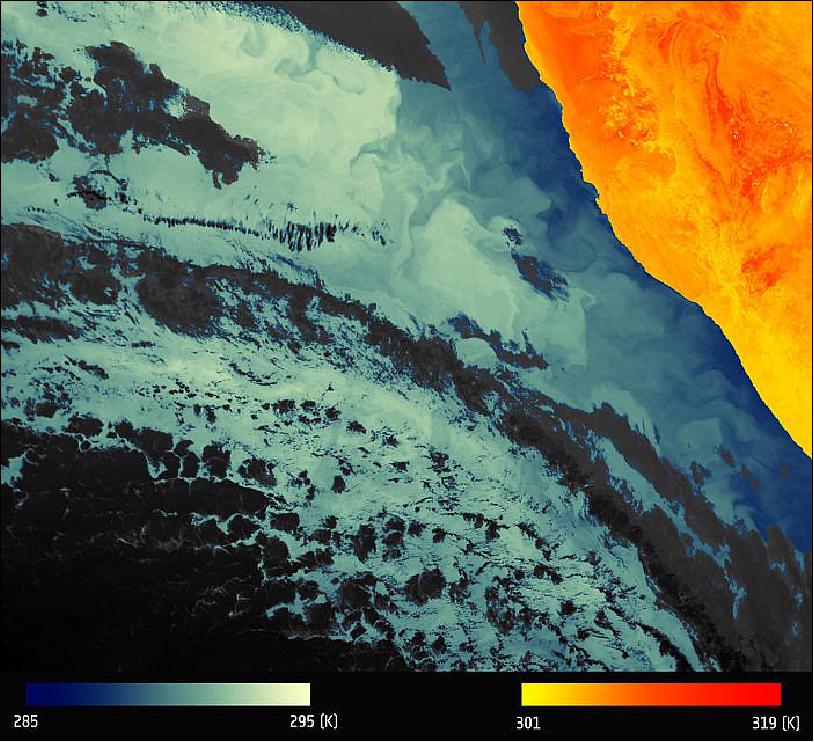
• April 1, 2016: The new Sentinel-3A satellite recently began providing data from orbit. This very early image recorded on 3 March 2016, takes us over the River Nile and Delta and the surrounding desert areas of northeast Africa and parts of the Middle East. Very distinct is Egypt, a country connecting northeast Africa with the Middle East, home to millennia-old monuments still sitting along the lush Nile valley. 55)
- In the center of the image, the capital city Cairo with the Nile snaking northwards is clearly visible, along with the Red Sea just further east. Also evident are the islands of Cyprus further north in the Mediterranean Sea and parts of Crete on the very left. Portions of southern Turkey are also visible including some islands of the Aegean Sea.
![Figure 54: This SLSTR (Sea and Land Surface Temperature Radiometer) image of Sentinel-3A was acquired on March 3, 2016 showing the River Nile and the extensive Nile Delta (image credit: ESA, the image contains modified Copernicus Sentinel data [2016], processed by ESA)](/api/cms/documents/163813/5215227/S3-2018-16_Auto6.jpeg)
Legend to Figure 54: The false color image of SLSTR measures the energy radiating from Earth's surface in nine spectral bands, including visible and infrared bands.
• March 8, 2016: The three instruments on the Sentinel-3A satellite are now offering a tantalizing glimpse of what's in store for Europe's Copernicus environmental monitoring effort. The latest images, which feature Europe and Antarctica, come from the sensor that records Earth's radiant energy. Launched just three weeks ago, Sentinel-3A carries a suite of cutting-edge instruments to provide systematic measurements of Earth's oceans, land, ice and atmosphere. This information will feed into numerous Copernicus services to monitor and manage our environment. 56)
- The SLSTR (Sea and Land Surface Temperature Radiometer) measures the energy radiating from Earth's surface in nine spectral bands, including visible and infrared. In addition to providing the temperature of the land and sea surface, dedicated channels will search for fires. This will help to map carbon emissions from burnt biomass and to assess damage and estimate recovery of burned areas. The first images come from the visible channels because the thermal-infrared channels have yet to be activated (Figure 55).
- Another of the images from its visible channels of SLSTR shows a long crack running through the ice shelf to the east of the Antarctic Peninsula (Figure 56).
- An additional false-color image, captured on 2 March, features a large part of Europe, demonstrating the instrument's 1400 km-wide swath. It also shows vegetated areas in red as well as storm Jake over the UK (Figure 57).
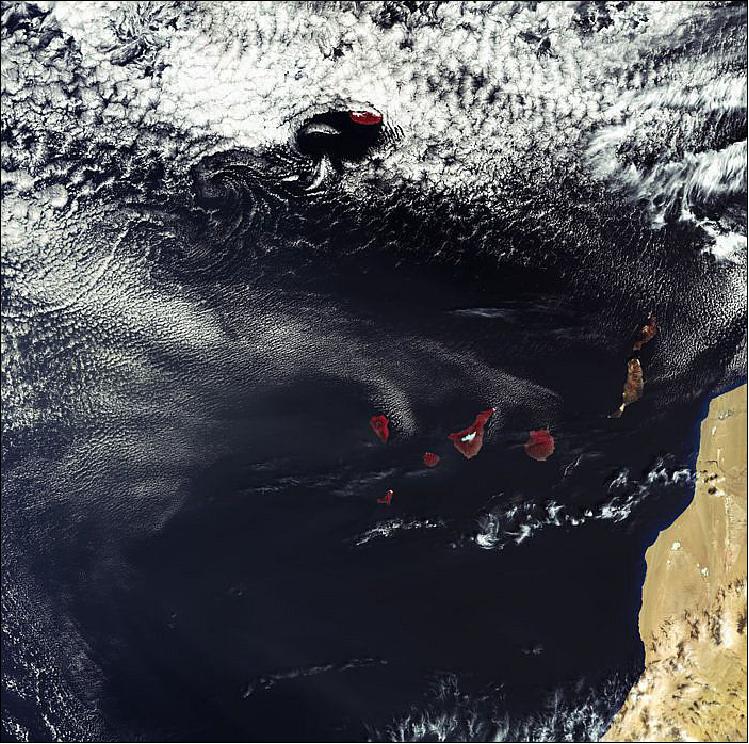
Legend to Figure 55: This false-color image features the Spanish Canary Islands, the Portuguese island of Madeira and the northwest coast of Africa. The vegetated islands appear red in contrast to the Western Sahara, which has little vegetation. The snow-capped peak of Mount Teide on the island of Tenerife is clearly visible. Both SLSTR and Sentinel-3's OLCI (Ocean and Land Color Instrument) will be used to monitor plant health. As the SLSTR scans Earth's surface, it senses visible light and infrared light (heat) in a number of different spectral channels. The thermal infrared channels will soon be working when the instrument has finished outgassing the water vapor. This is necessary because the infrared channels must be cooled to operate properly. The SLSTR will measure global sea- and land-surface temperatures every day to an accuracy of better than 0.3ºC.
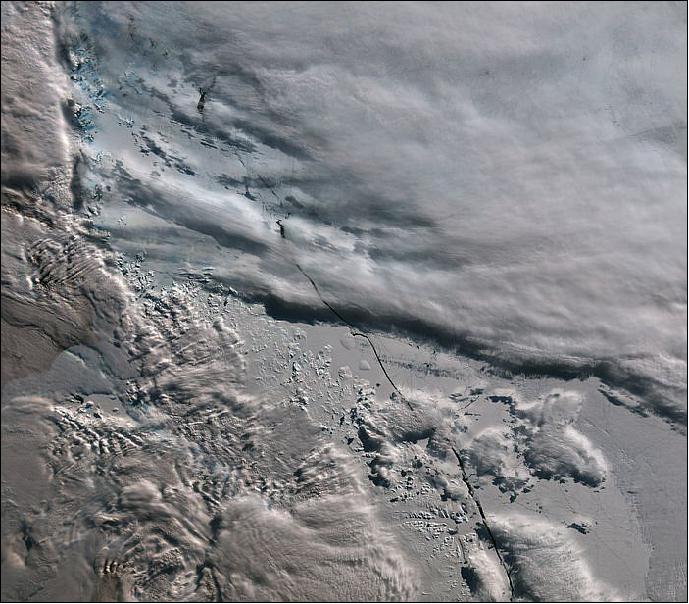
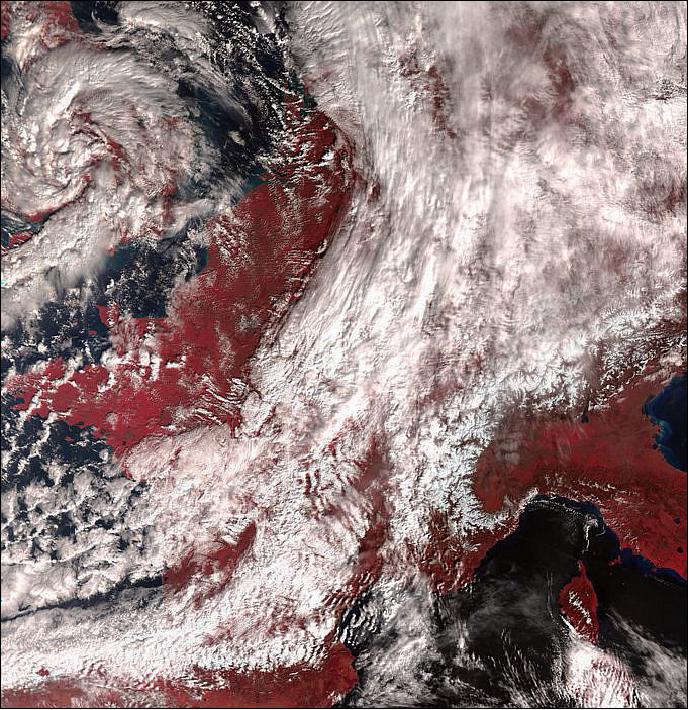
• March 4, 2016: Just after the SRAL (SAR Radar Altimeter) instrument on Sentinel-3A, it traced the height of the sea surface over a stretch of the North Atlantic, some of the most dynamic ocean waters in the world. Showing features relating to the Gulf Stream, the track compares very well with the background map of sea-surface height. The map (Figure 58), produced by the CMEMS (Copernicus Marine Environment Monitoring Service), comprises near-realtime data for one day from the CryoSat-2, Jason-2 and SARAL/AltiKa satellites. 57)
- The altimeter is designed to deliver accurate measurements of sea-surface height, significant wave height and surface-wind speeds over the world's oceans for Copernicus ocean forecasting systems and for monitoring sea-level change.
- Pierre-Yves Le Traon from Mercator Ocean said, "These first results are very promising and illustrate the great potential Sentinel-3 has for the CMEMS. Sea-surface height data from the satellite's altimeter will, for example, significantly improve our capability to analyze and forecast ocean currents. This is essential for the applications we serve such as marine safety, ship routing and predicting the fate of marine pollution events."
- The altimeter has heritage from the CryoSat-2 and Jason-2 missions. This first image is in low-resolution mode but it will provide measurements at a resolution of approximately 300 m in the along-track direction after processing. SRAL will be the first satellite altimeter to provide 100% coverage over all of Earth's surfaces in ‘synthetic aperture radar mode', directly resulting from experience with CryoSat-2.
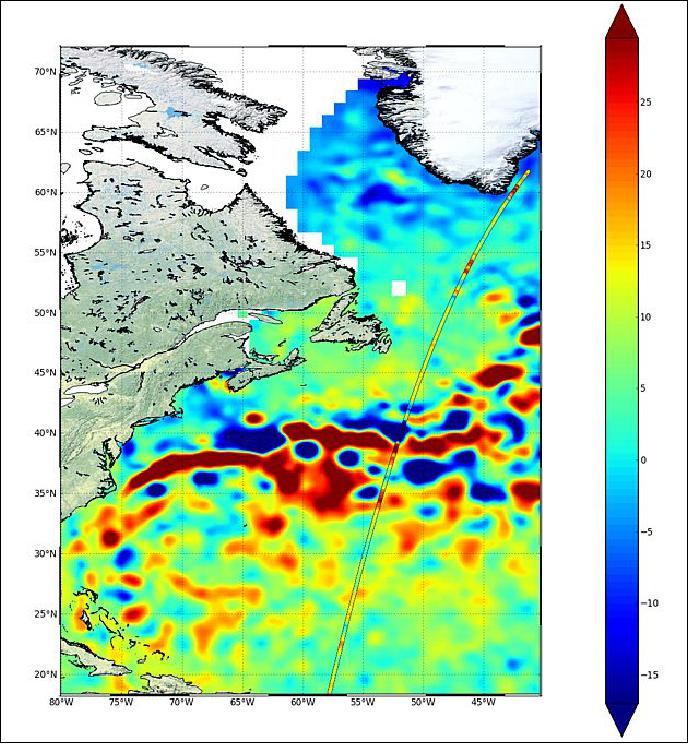
• March 2, 2016: Featuring Spain, Portugal and North Africa, this is one of the first images from the Sentinel-3A satellite. The image was taken by the satellite's OLCI (Ocean and Land Color Instrument) on 1 March 2016 and clearly shows the Strait of Gibraltar between the Atlantic and Mediterranean. Swirls of sediment and algae in the seawater can be seen along the southwest coast of Spain and along the coast of Morocco. The instrument picks out Morocco's dry desert and snow-covered peaks of the Atlas Mountains and greener vegetated northern areas of Spain. 58)
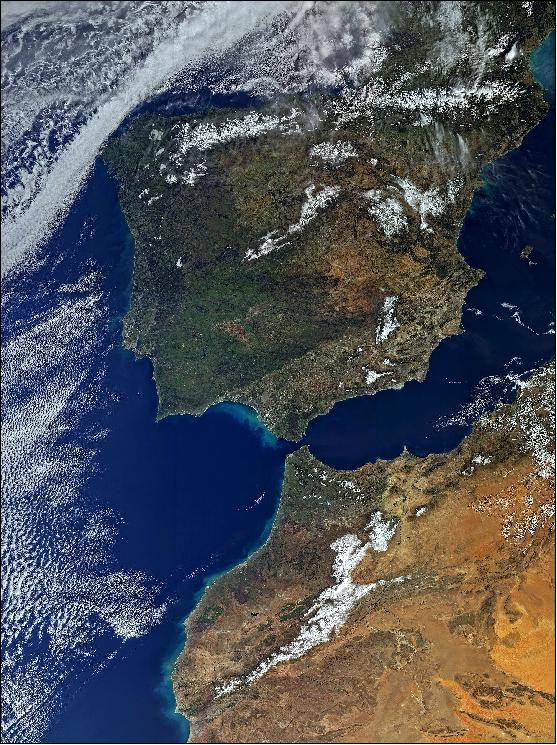
• Feb. 25, 2016: Each year, about a quarter of the carbon dioxide we release into the atmosphere ends up in the ocean, but how it happens is still not fully understood. The Sentinel-3A satellite is poised to play an important role in shedding new light on this exchange. 59)
- Initially, the fact that the oceans are absorbing a significant amount of the carbon dioxide we pump into the atmosphere by burning biomass and fossil fuels would appear to be a good thing. However, as more carbon dioxide dissolves into the oceans, it leads to ocean acidification, making it difficult for some marine life to survive.
- Monitoring and understanding the carbon cycle is important because carbon is the fundamental building block of all living organisms. Also, the process of carbon moving between the oceans, atmosphere, land and ecosystems helps to control our climate.
- Over the last four years an international team of scientists and engineers have been using satellites along with measurements from ships and pioneering cloud computing techniques to study how carbon dioxide is transferred from the atmosphere into the oceans. Their work reveals that the seas around Europe absorb an astonishing 24 million tonnes of carbon each year. This is equivalent in weight to two million double decker buses or 72 000 Boeing 747s. 60)
- The team are making their data and cloud computing tools, the ‘FluxEngine', available to the international scientific community so that other groups can analyse the data for themselves.
• Feb. 25, 2016: Working around the clock, mission teams have brought Sentinel-3A through the critical LEOP (Launch and Early Orbit Phase) in just 49 hours, much earlier than planned and a record for such a complex satellite. LEOP was completed on Feb. 18. All operations were executed on time, and the satellite and ground systems performed perfectly during the whole period. 61)
- The speedy completion of LEOP means that the five-month commissioning phase has already started, and Sentinel-3 project and operations teams will start validating the correct functioning of spacecraft and its payload. -In parallel, teams at ESA/ ESRIN in Frascati are working on configuring and validating the complex data delivery channels and bringing these into full service.
- In the afternoon of 23 February, Sentinel-3A tested its first delivery of science data, downlinking test data from the few instruments already switched on, including the SLSTR (Sea and Land Surface Temperature Radiometer). The 10-minute downlink was conducted using the satellite's X-band radio transmitter, confirming its ability to deliver high-rate data via the mission's designated ground station, at Svalbard on the Norwegian archipelago of Spitsbergen.
• After a first burn starting about five minutes after liftoff and a second about 70 minutes later, Rockot's upper stage delivered Sentinel-3A into its planned orbit, 815 km above Earth. The satellite separated 79 minutes into the flight (Ref. NO TAG#.
- The first signal from Sentinel-3A was received after 92 minutes by the Kiruna station in Sweden. The telemetry links and attitude control were then established by controllers at ESA/ESOC in Darmstadt, Germany, allowing them to monitor the health of the satellite.
- The mission is the third of six families of dedicated missions that make up the core of Europe's Copernicus environmental monitoring network. Copernicus relies on the Sentinels and contributing missions to provide data for monitoring the environment and supporting civil security activities. Sentinel-3 carries a series of cutting-edge sensors to do just that.
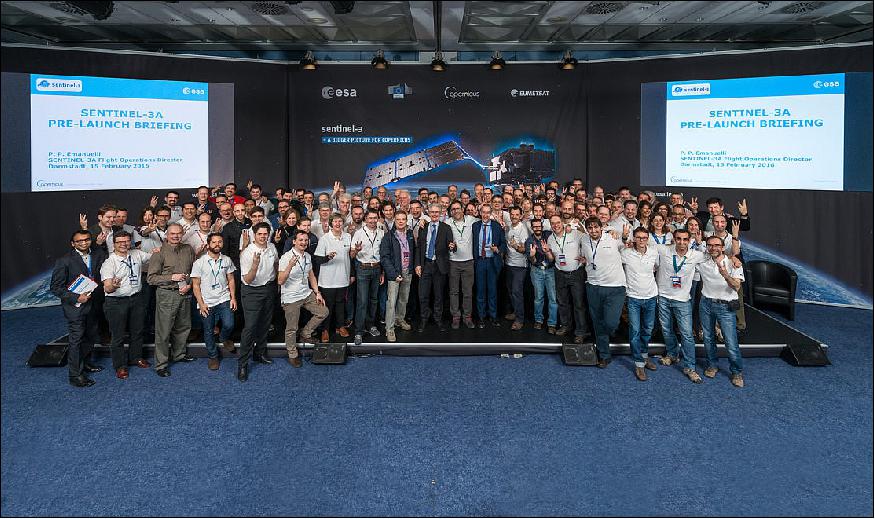
Legend to Figure 60: This ‘team of teams' involves some 50 engineers and scientists at ESOC, including spacecraft engineers, specialists working on tracking stations and the sophisticated ‘ground segment' – the hardware and software used to control the satellite and distribute its data – and experts working in flight dynamics, software and networks, as well as simulation and training teams.
Representatives from ESA's Sentinel project team, as well as several operations engineers integrated within the Flight Control Team and shared with EUMETSAT, are also working to ensure the success of this crucial mission.
1) "Release of Sentinel-3B Ocean and Land Color Instrument (OLCI) Level-1 products," EUMETSAT, 6 December 2018, URL: https://web.archive.org/web/20181102054853/https://www.eumetsat.int/website/home/News/DAT_3913829.html
2) "Release of Sentinel-3B STM Level-1 and Marine Level 2 Products," EUMETSAT, 3 December 2018, URL: [web source no longer available]
3) "The Gulf," ESA Earth observation image of the week, 23 November 2018, URL: http://m.esa.int/spaceinimages/Images/2018/11/The_Gulf
4) "Madagascar," ESA, Earth observation image of the week, 9 November 2018, URL: http://m.esa.int/spaceinimages/Images/2018/11/Madagascar
5) Eastern US," ESA, 5 October 2018, URL: http://m.esa.int/spaceinimages/Images/2018/10/Eastern_US
6) "North Sea bloom," ESA, Earth observation image of the week, 7 September 2018, URL: http://m.esa.int/spaceinimages/Images/2018/09/North_Sea_bloom
7) "Earth from Space: North Sea bloom," ESA, 7 September 2018, URL: http://m.esa.int/spaceinvideos/Videos/2018/09/Earth_from_Space_North_Sea_bloom
8) "Hurricane Lane," ESA, 24 August 2018, URL: http://m.esa.int/spaceinimages/Images/2018/08/Hurricane_Lane
9) J. Nieke, S. Dransfeld, C. Donlon, B. Berruti, S. Mecklenburg, and the ESA and EUMETSAT Sentinel-3 team, "SENTINEL-3 A and -B optical payload: Early Results From Commissioning and Tandem Flight Activities," Proceedings of IGARSS (International Geoscience and Remote Sensing Symposium), Valencia, Spain, July 23-27, 2018
10) "Sweden in flames," ESA, 20 July 2018, URL: http://m.esa.int/spaceinimages/Images/2018/07/Sweden_in_flames
11) "Shanghai, China," ESA Earth observation image of the week, 13 July 2018, URL: http://m.esa.int/spaceinimages/Images/2018/07/Shanghai_China
12) "Sentinel-3 flies tandem," ESA, 19 June 2018, URL: http://www.esa.int/Our_Activities/Observing_the_Earth/Copernicus/Sentinel-3/Sentinel-3_flies_tandem
13) "Cabo Verde," ESA Earth observation image of the week, 8 June 2018, URL: http://m.esa.int/spaceinimages/Images/2018/06/Cabo_Verde
14) Kelsea Brennan-Wessels, "Earth from Space: Cabo Verde," 8 June 2018, URL: http://m.esa.int/spaceinvideos/Videos/2018/06/Earth_from_Space_Cabo_Verde
15) "Sicily hotspot;" ESA, 05 June 2018, URL: http://m.esa.int/spaceinimages/Images/2018/06/Sicily_hotspot
16) "Lake Van water height from Sentinel-3B," ESA, 11 May 2018, URL: http://m.esa.int/spaceinimages/Images/2018/05/Lake_Van_water_height_from_Sentinel-3B
17) "Just two weeks after the launch of the environment-monitoring satellite Sentinel-3B, the third of its payload of instruments – its radar altimeter - has begun sending high-precision measurements back to Earth," EUMETSAT, 11 May 2018, URL: https://www.eumetsat.int/website/home/News/DAT_3913829.html
18) "Western Europe from Sentinel-3B," ESA, 10 May 2018, URL: http://m.esa.int/spaceinimages/Images/2018/05/Western_Europe_from_Sentinel-3B
19) "The most recent addition to Europe's fleet of Copernicus ocean-monitoring satellites has begun sending images back to Earth and the results have experts excited," EUMETSAT, 10 May 2018, URL: https://web.archive.org/web/20181102150528/https://www.eumetsat.int/website/home/News/DAT_3917323.html
20) "Copernicus Sentinel-3B delivers first images," ESA, 09 May 2018, URL: http://m.esa.int/Our_Activities/Observing_the_Earth/
Copernicus/Sentinel-3/Copernicus_Sentinel-3B_delivers_first_images
21) "Cloud-free Europe," ESA Earth observation image of the week, 27 April 2018, URL: http://m.esa.int/spaceinimages/Images/2018/04/Cloud-free_Europe
22) "ESA and SAP look to World Space Alliance," ESA, 26 April 2018, URL: http://m.esa.int/Our_Activities/Observing_the_Earth/ESA_and_SAP_look_to_World_Space_Alliance
23) "Constellation complete," ESA, 26 April 2018, URL: http://m.esa.int/spaceinimages/Images/2018/04/Constellation_complete
24) "The Copernicus Sentinel-3 mission: Sentinel-3B is in-orbit!," Copernicus Observer, 26 April 2018, URL: http://copernicus.eu/news/copernicus-sentinel-3-in-orbit
25) "EUMETSAT collects and disseminates data from three instruments carried by the Sentinel-3 satellites," EUMETSAT, 13 April 2018, URL: [web source no longer available]
26) "The Ocean and Land Color Instrument (OLCI) on board the Sentinel-3A satellite (launched in February 2016) delivers vital information about the biological and biogeochemical activity of aquatic ecosystems," 9 April 2016, URL: [web source no longer available]
27) "Lake Baikal, Siberia," ESA, Earth observation image of the week, 6 April 2018, URL: http://m.esa.int/spaceinimages/Images/2018/04/Lake_Baikal_Siberia
28) "Earth from Space: Lake Baikal," ESA, 6 April 2018, URL: http://m.esa.int/spaceinvideos/Videos/2018/04/Earth_from_Space_Lake_Baikal
29) "Italy and Mediterranean," ESA Earth observation image of the week, 9 March 2018, URL: http://m.esa.int/spaceinimages/Images/2018/03/Italy_and_Mediterranean
30) "Snowbound Italy," ESA, 28 Feb. 2018, URL: http://m.esa.int/spaceinimages/Images/2018/02/Snowbound_Italy
31) "Atlantic ship tracks," ESA, 9 Feb. 2018, URL: http://m.esa.int/spaceinimages/Images/2018/02/Atlantic_ship_tracks
32) "Copernicus Sentinel-3 offers safer navigation at sea," ESA, 11 Jan. 2018, URL: https://sentinels.copernicus.eu/web/sentinel/news/-/article/sentinel
-3-helps-provide-new-wave-product-for-safer-navigation
33) "Discover how to download, visualise and manipulate Sentinel-3 marine data!," Copernicus Observer, 22 Dec. 2017, URL: http://copernicus.eu/news/download-visualise-manipulate-sentinel-3-marine-data
34) "Sentinel-3 helps water-quality monitoring," ESA, EU, 21 Dec. 2017, URL: https://sentinels.copernicus.eu/web/sentinel/news/-/article/sentinel-3-helps-water-quality-monitoring
35) "Hurricane Ophelia," ESA, 12 Oct. 2017, URL: http://m.esa.int/spaceinimages/Images/2017/10/Hurricane_Ophelia
36) "Accessing Copernicus data in near real time via CODA and EUMETCast," EUMETSAT, 30 August, 2017, URL: [web source no longer available]
37) "Hurricane Harvey," ESA, 25 August 2017, URL: http://m.esa.int/spaceinimages/Images/2017/08/Hurricane_Harvey
38) "Sweltering southern Europe," ESA, Aug. 11, 2017, URL: http://www.esa.int/spaceinimages/Images/2017/08/Sweltering_southern_Europe
39) "See our seasons change from space," ESA, 6 July 2017, URL: http://m.esa.int/Our_Activities/Observing_the_Earth/Copernicus/Sentinel-3/See_our_seasons_change_from_space
40) "France," ESA, 23 June 2017, URL: http://www.esa.int/spaceinimages/Images/2017/06/France
41) "Bering Sea," ESA, Earth observation image of the week, 28 April 28, URL: http://m.esa.int/spaceinimages/Images/2017/04/Bering_Sea
42) "Kamchatka, Russia," ESA Earth observation image of the week, 10 March 2017, URL: http://m.esa.int/spaceinimages/Images/2017/03/Kamchatka_Russia
43) "Sentinel-3A measures height of Antarctic ice sheet," ESA, Dec. 13, 2016, URL: http://www.esa.int/spaceinimages/Images/2016/12/Sentinel-3A_measures_height_of_Antarctic_ice_sheet
44) "Sentinel-3A takes Earth's temperature," ESA, Nov. 17, 2016, URL: http://m.esa.int/spaceinimages/Images/2016/11/Sentinel-3A_takes_Earth_s_temperature
45) "Sentinel-3A Earth color data released," ESA, Oct. 20, 2016, URL: http://m.esa.int/Our_Activities/Observing_the_Earth/Copernicus/
Sentinel-3/Sentinel-3A_Earth_colour_data_released
46) Craig Donlon, Bruno Berruti, Constantin Mavrocordatos, Honora Rider, "A Bigger Picture for Copernicus - The Sentinel-3 mission," ESA Bulletin No 165-168, Oct. 2016, published January 2017, pp: 2-11, URL: http://esamultimedia.esa.int/multimedia/publications/ESA-Bulletin-165-168/offline/download.pdf
47) "Greenland changing ice," ESA, Oct. 20, 2016, URL: http://m.esa.int/spaceinimages/Images/2016/10/Greenland_changing_ice
48) J. Nieke, C. Mavrocordatos, and the Sentinel-3 team, "Sentinel-3A: Commissioning phase results of its optical payload," Proceedings of the ICSO 2016 (International Conference on Space Optics), Biarritz, France, 18-21 October, 2016, URL: http://esaconferencebureau.com/custom/icso/2016/index.htm
49) "Mediterranean view," ESA, Oct. 20, 2016, URL: http://m.esa.int/spaceinimages/Images/2016/10/Mediterranean_view
50) Anne G. O'Carroll, Prasanjit Dash, Igor Tomazic, Francois Montagner, Hans Bonekamp, Eva Coto Cabaleiro, Vincenzo Santacesaria, Hilary Wilson, Craig Donlon, Philippe Goryl, "Sea Surface Temperature from Sentinel-3 SLSTR," Proceedings of the EUMETSAT 2016 Meteorological Satellite Conference, Darmstadt, Germany, Sept. 26-30, 2016, availability of the proceedings at the end of December 2016, URL: http://www.eumetsat.int/website/home/News/ConferencesandEvents/DAT_2833302.html
51) "Siberia blanketed in smoke," ESA, Sept. 20, 2016, URL: http://m.esa.int/spaceinimages/Images/2016/09/Siberia_blanketed_in_smoke
52) "Europe's workhorse Sentinel ready for action," ESA, July 13, 2016, URL: http://m.esa.int/Our_Activities/Observing_the_Earth/Copernicus/
Sentinel-3/Europe_s_workhorse_Sentinel_ready_for_action
53) "After successful completion of in-orbit commissioning, ESA has handed over operations of the Copernicus Sentinel-3A satellite to EUMETSAT," EUMETSAT, July 13, 2016, URL: http://www.eumetsat.int/website/home/News/DAT_3127863.html?lang=EN&pState=1
54) "Thermal signature of Namibian coastline," ESA, April 6, 2016, URL: http://www.esa.int/spaceinimages/Images/2016/04/Thermal_signature_of_Namibian_coastline
55) "Sentinel-3: better than good," ESA, Earth observation image of the week, April 1, 2016, URL: http://www.esa.int/spaceinimages/Images/2016/03/Sentinel-3_better_than_good
56) "Sentinel-3A continues to impress," ESA, March 8, 2016, URL: http://www.esa.int/Our_Activities/Observing_the_Earth/
Copernicus/Sentinel-3/Sentinel-3A_continues_to_impress
57) "Sentinel-3A rides the waves," ESA, March 4, 2016, URL: http://www.esa.int/Our_Activities/Observing_the_Earth/
Copernicus/Sentinel-3/Sentinel-3A_rides_the_waves
58) "Spain, Portugal and North Africa," ESA Copernicus data (2016), March 2, 2016, URL: http://www.esa.int/spaceinimages/Images/2016/03/Spain_Portugal_and_North_Africa
59) "Sentinel-3 and the ocean carbon conundrum," ESA, Feb. 25, 2016: URL: http://www.esa.int/Our_Activities/Observing_the_Earth/Copernicus/
Sentinel-3/Sentinel-3_and_the_ocean_carbon_conundrum
60) Jamie D. Shutler, Peter E. Land, Jean-Francois Piolle, David K. Woolf, Lonneke Goddijn-Murphy, Frederic Paul, Fanny Girard-Ardhuin, Bertrand Chapron, Craig J. Donlon, "FluxEngine: A flexible processing system for calculating atmosphere-ocean carbon dioxide gas fluxes and climatologies," Journal of Atmospheric and Oceanic Technology 2015, doi: 10.1175/JTECH-D-14-00204.1, URL: http://journals.ametsoc.org/doi/abs/10.1175/JTECH-D-14-00204.1
61) "Nonstop LEOP full stop," ESA, Feb. 25, 2016, URL: http://www.esa.int/Our_Activities/Operations/Nonstop_LEOP_full_stop
62) "Sentinel-3A launch team at ESOC," ESA, Feb. 18, 2016, URL: http://m.esa.int/spaceinimages/Images/2016/02/Sentinel-3A_launch_team_at_ESOC
The information compiled and edited in this article was provided by Herbert J. Kramer from his documentation of: "Observation of the Earth and Its Environment: Survey of Missions and Sensors" (Springer Verlag) as well as many other sources after the publication of the 4th edition in 2002. - Comments and corrections to this article are always welcome for further updates (eoportal@symbios.space).