Sentinel-3 mission and its imagery in the period 2019
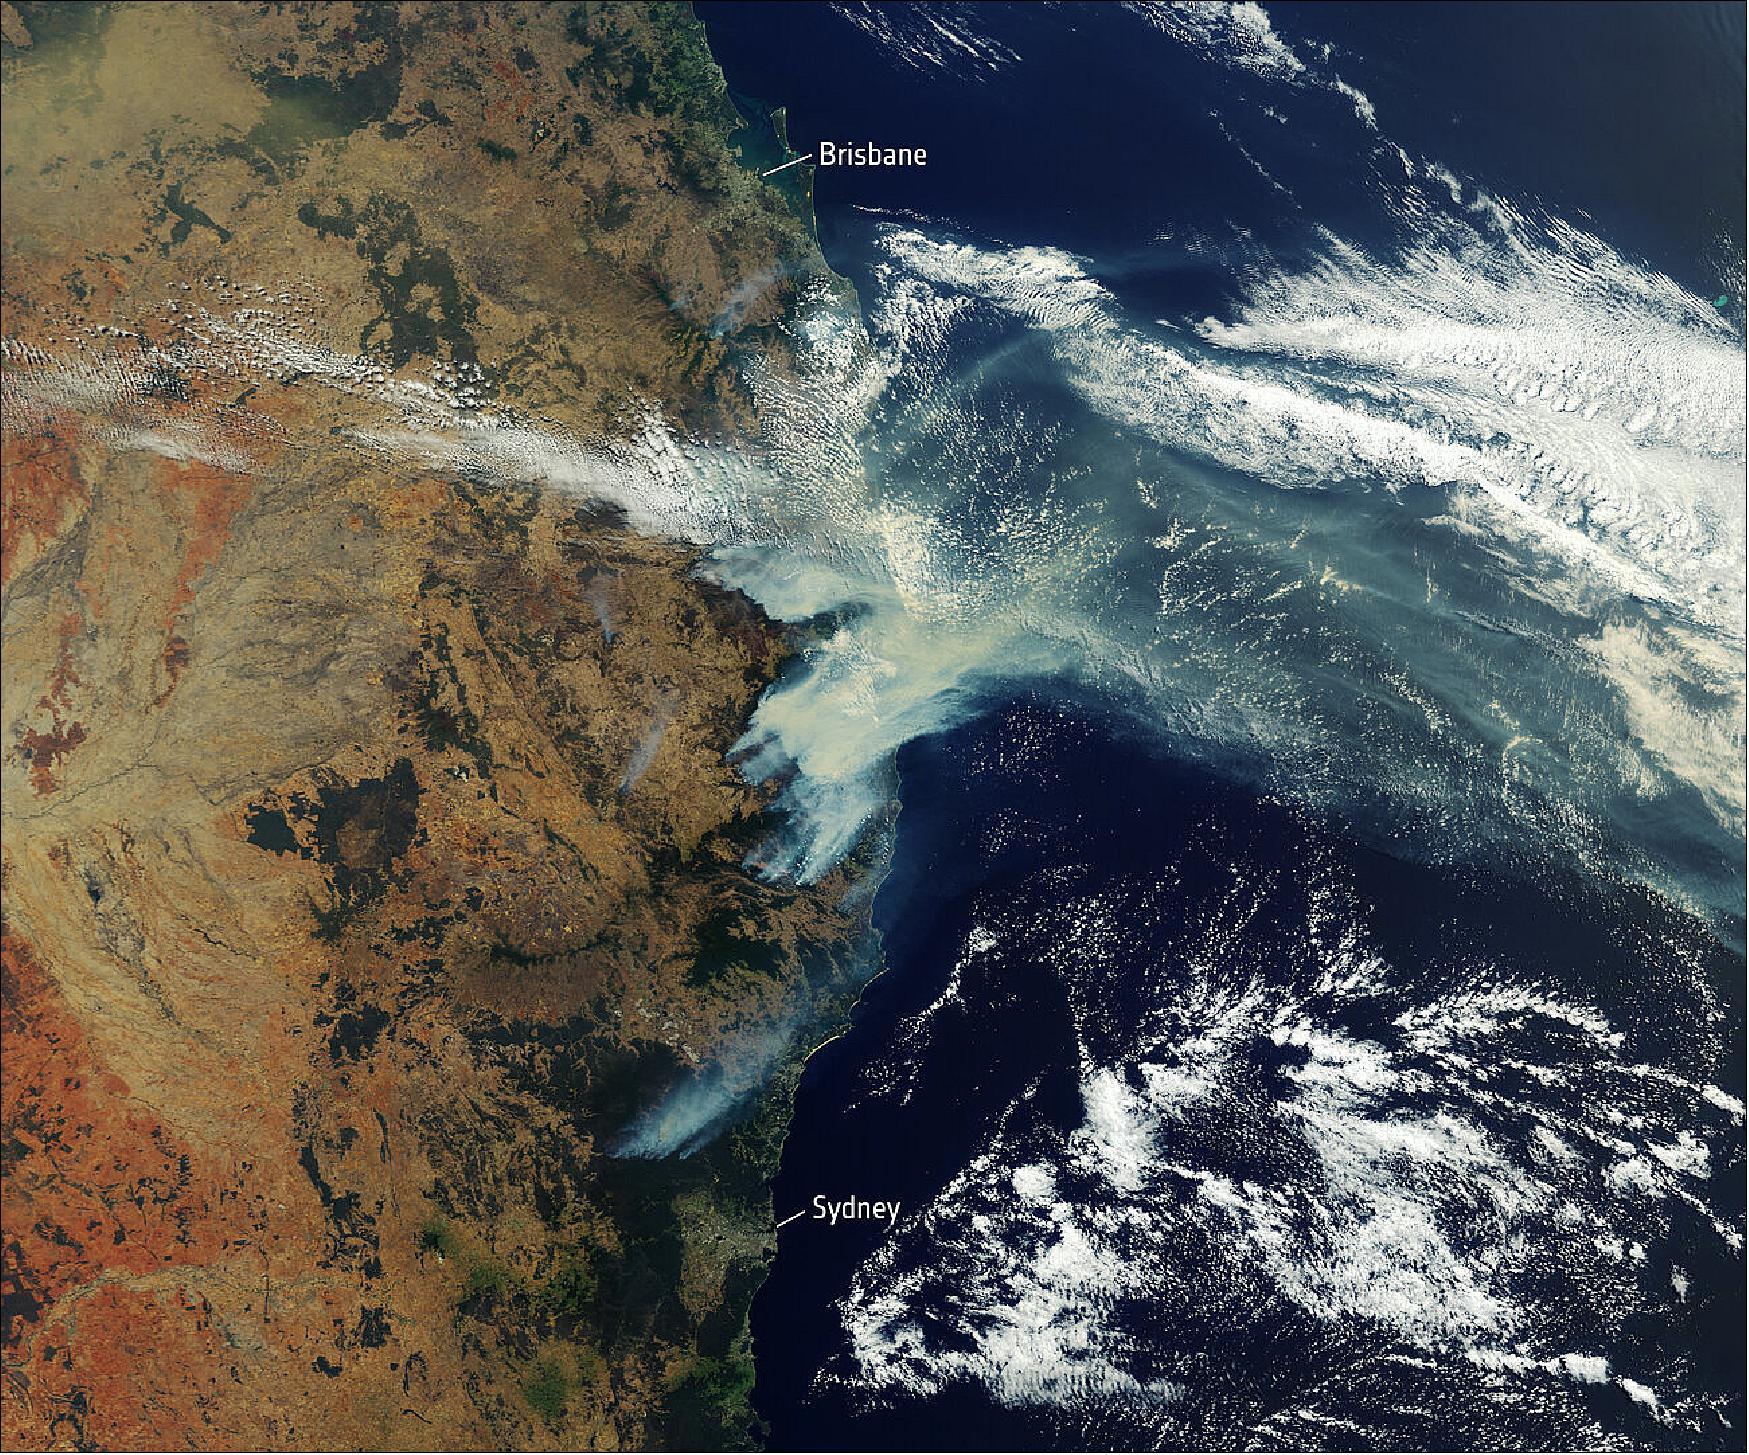
• November 13, 2019: The Copernicus Sentinel-3 mission captured the multiple bushfires burning across Australia’s east coast. Around 150 fires are still burning in New South Wales and Queensland, with hot and dry conditions accompanied with strong winds, said to be spreading the fires. 1)
- Hundreds of homes have been damaged or destroyed, and many residents evacuated. Flame retardant was dropped in some of Sydney’s suburbs as bushfires approached the city center. Firefighters continue to keep the blazes under control.
- The Copernicus Emergency Mapping Service was activated to help respond to the fires. The service uses satellite observations to help civil protection authorities and, in cases of disaster, the international humanitarian community, respond to emergencies.
- Quantifying and monitoring fires is fundamental for the ongoing study of climate, as they have a significant impact on global atmospheric emissions. Data from the Copernicus Sentinel-3 World Fire Atlas shows that there were almost five times as many wildfires in August 2019 compared to August 2018.
• October 25, 2019: Wildfires have been making headlines again this month, with multiple fires burning in Lebanon and California, but these are just some of the many fires 2019 has seen. Fires in the Amazon sparked a global outcry this summer, but fires have also been blazing in the Arctic, France, Greece, Indonesia as well as many other areas in the world. 2)
- Data from the Sentinel-3 World Fire Atlas shows that there were almost five times as many wildfires in August 2019 compared to August 2018, but a detailed analysis reveals precisely where these fires have been occurring – most of which were in Asia.
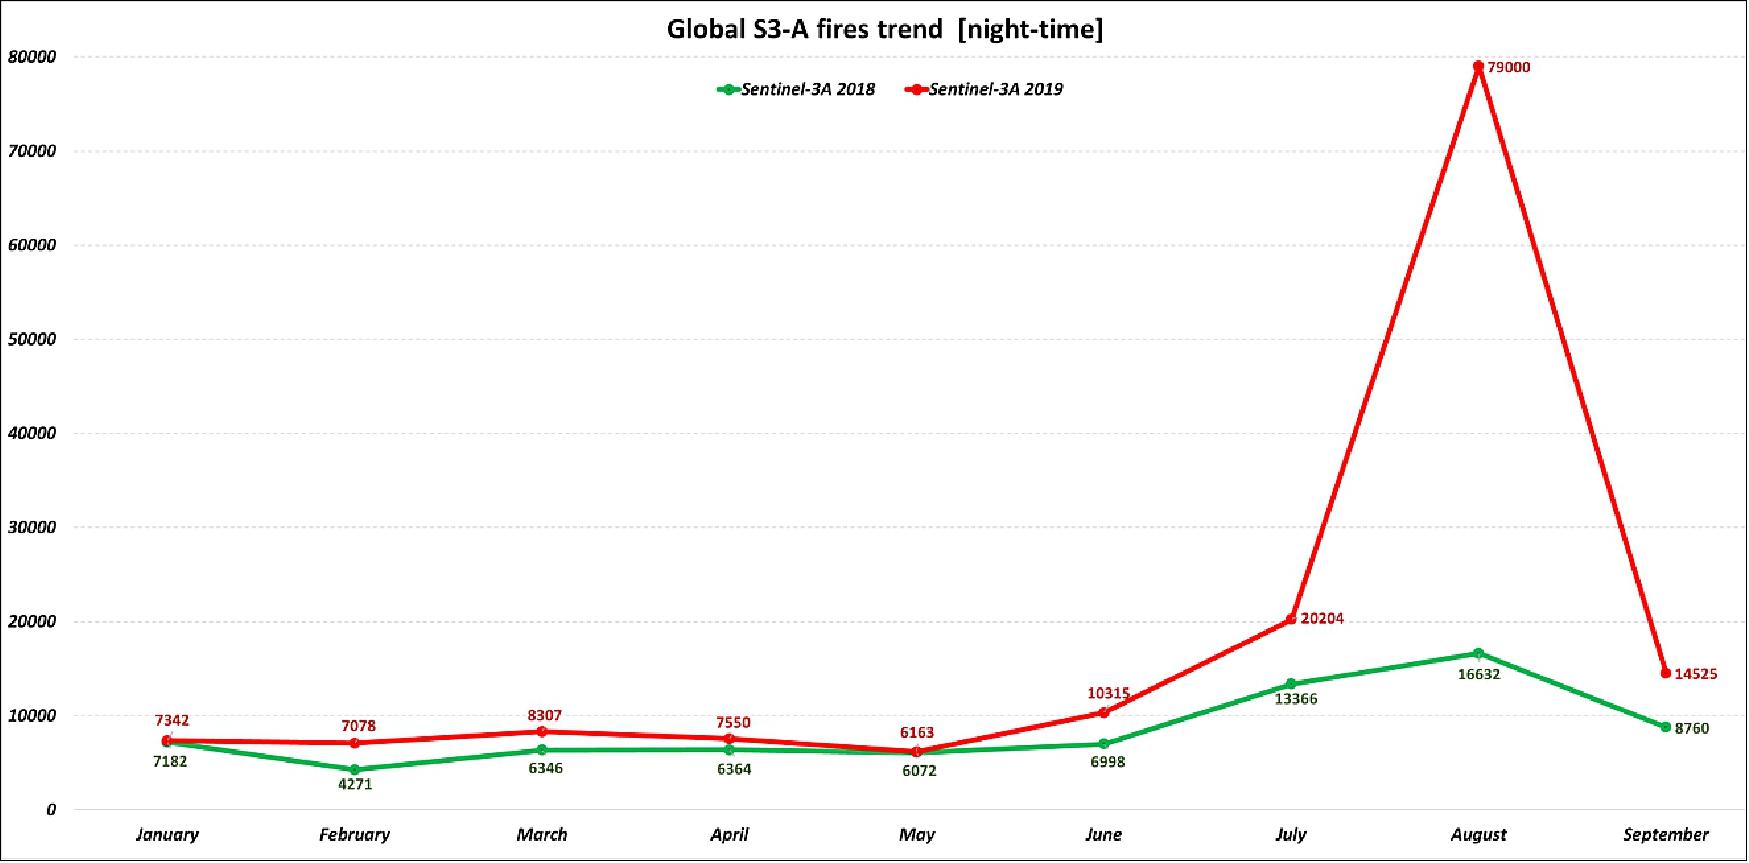
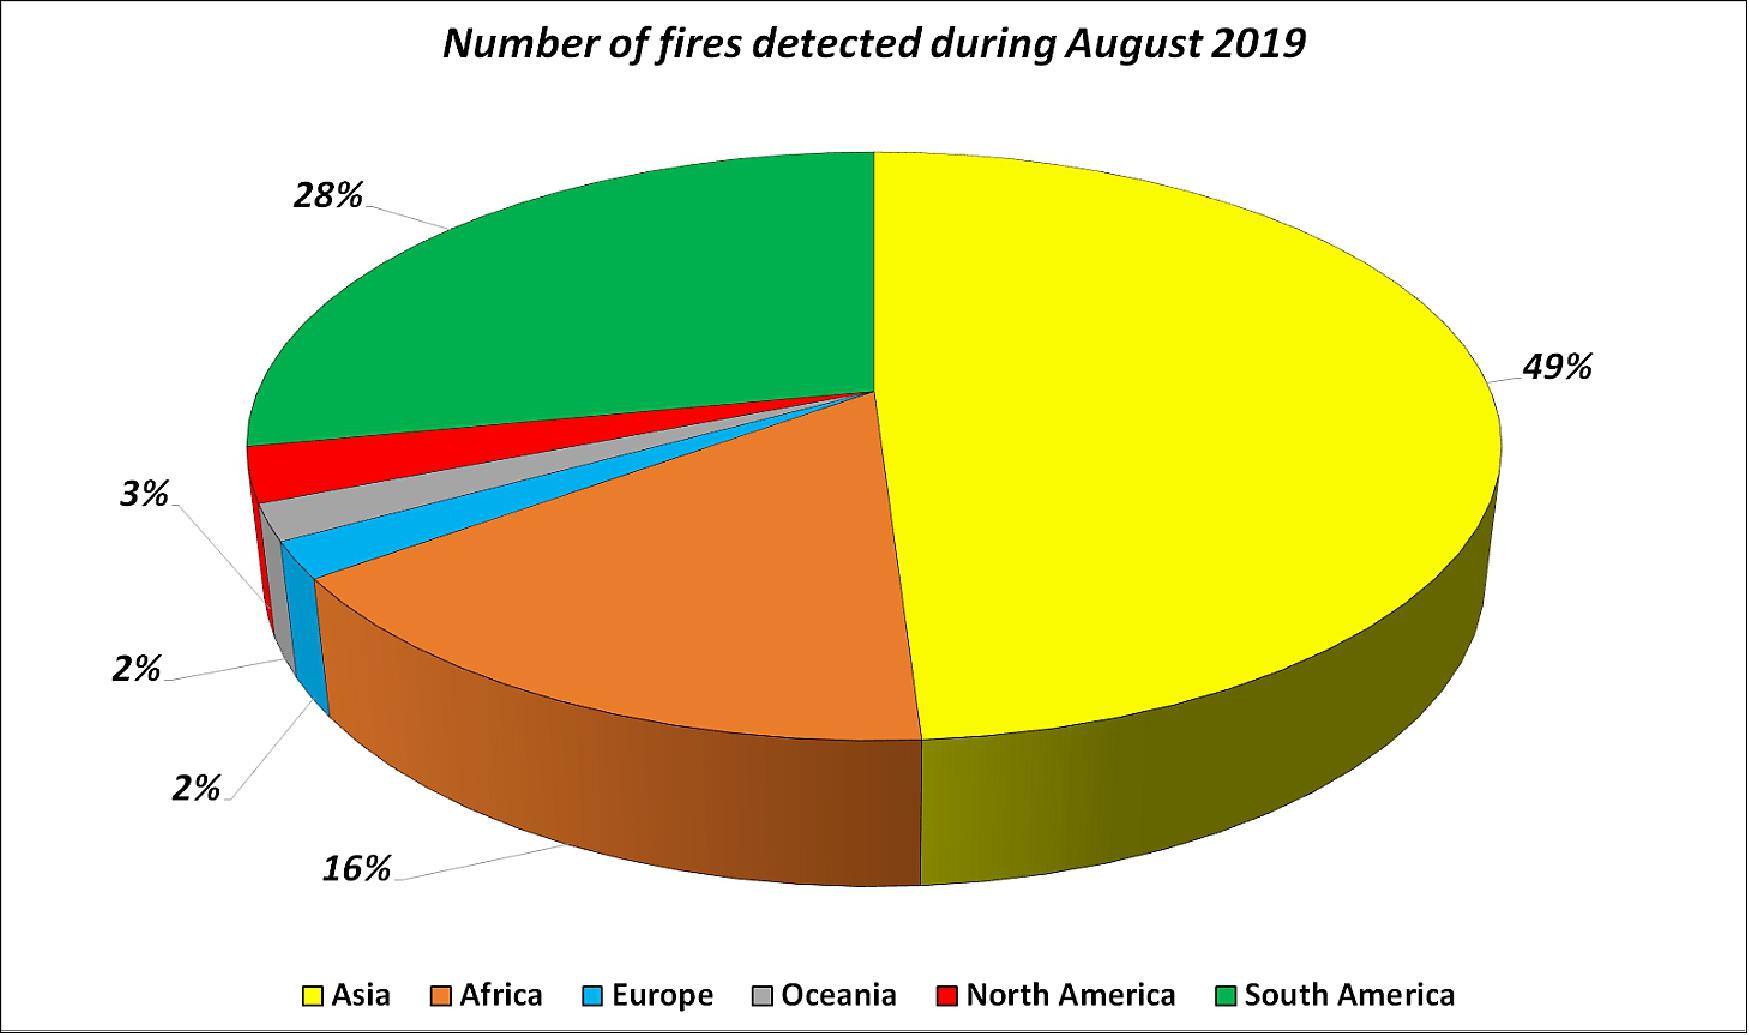
- The Copernicus Sentinel-3 mission recorded 79,000 fires in August this year, compared to just over 16,000 fires detected during the same period last year. These figures were achieved by using data from the Sentinel-3 World Fire Atlas Prototype, which is also able to provide a breakdown of these fires per continent.
- The data reveals 49% of fires were detected in Asia, around 28% were detected in South America, 16% in Africa, and the remaining were recorded in North America, Europe and Oceania.
- Working like thermometers in the sky, the sensors on satellites measure thermal infrared radiation to take the temperature of Earth's land surfaces. This information is used to detect and monitor the heat emitted by the fires.
- Using its two dedicated fire channels, the Sentinel-3 World Fire Atlas uses a simplified operational version derived from Wooster et al. 2012 in order to identify all active fires at night.
- Data gathered are used to plot the number of fires occurring monthly. The number of input images from Copernicus Sentinel-3A satellite were around the same from one year to the other.
- Even if the atlas cannot pick up all fires due to satellite overpass constraints and cloud coverage, it is statistically representative from one month to the other and from one year to the other.
- ESA’s Olivier Arino comments, “We have never seen an increase of wildfires of this kind since the ATSR World Fire Atlas was created in 1995.”
- Quantifying and monitoring fires is important for the ongoing study of climate because they have a significant impact on global atmospheric emissions, with biomass burning contributing to the global budgets of greenhouse gases, like carbon dioxide.
- One of the biggest problems during and after fires is obtaining an overall view of the fires evolution and potential damage. With fires seen from space, Earth observation is also being used to detect and monitor the active spots over affected areas.
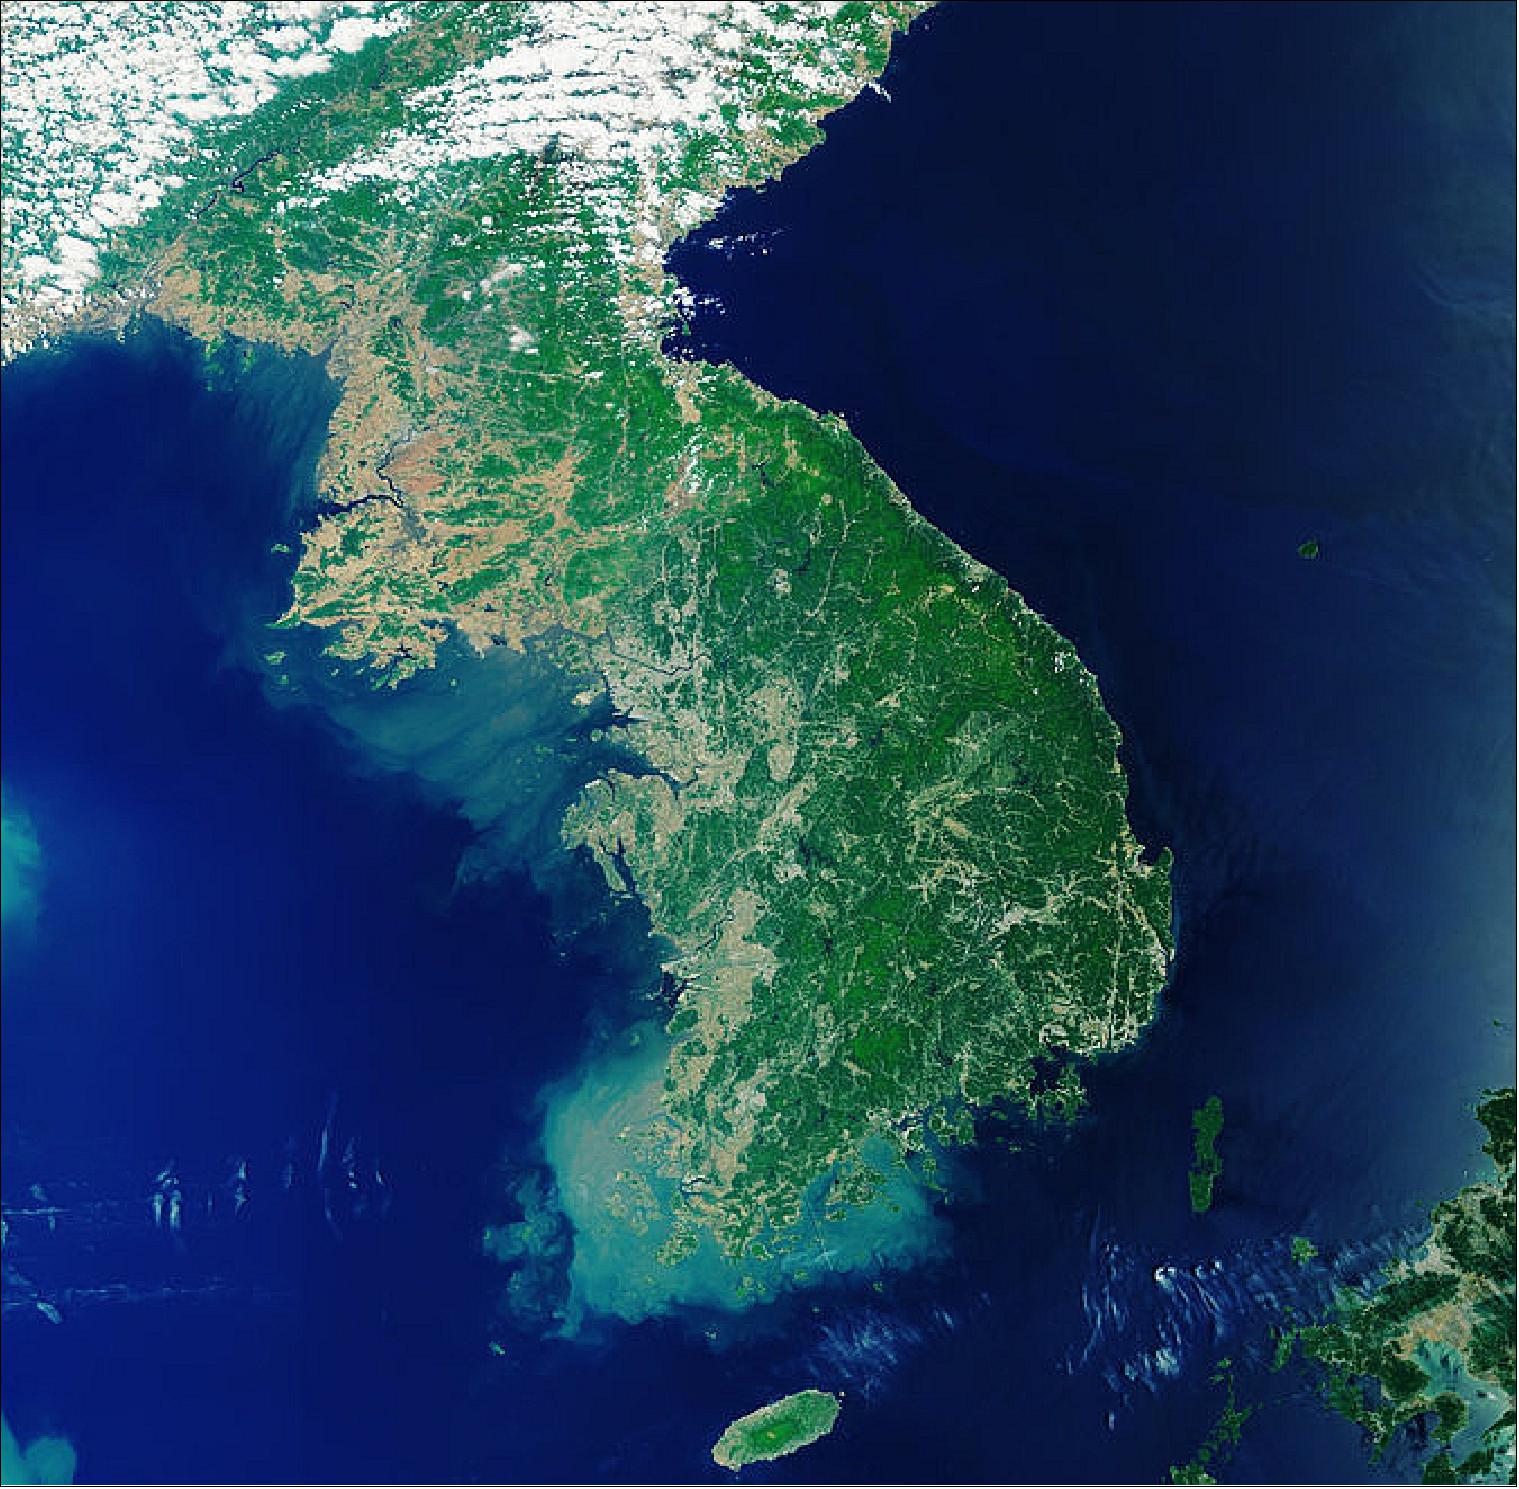
• October 18, 2019: The Korean Peninsula in East Asia can be seen in this image captured by the Copernicus Sentinel-3 mission. The peninsula is over 900 km long and is located between the Sea of Japan, also known as the East Sea, to the east and the Yellow Sea to the west. 3)
- The peninsula is divided into two countries – the Democratic People's Republic of Korea (North Korea) and the Republic of Korea (South Korea).
- North Korea is divided into nine provinces, with Pyongyang as the capital. Pyongyang, which can be seen in light grey in the upper left of the image, lies on the banks of the Taedong River and on a flat plain about 50 km inland from the Korea Bay.
- The capital of South Korea is Seoul, which is in the northwest of the country, slightly inland and around 50 km south of the North Korean border.
- As the image shows, the Korean peninsula is mostly mountainous and rocky, making less than 20% of the land suitable for farming.
- The Yellow Sea owes its name to the silt-laden waters from the Chinese rivers that empty into it. It is also one of the largest shallow areas of continental shelf in the world with an average depth of around 50 m.
- The waters off the coast of Korea are considered among the best in the world for fishing. The warm and cold currents attract a wide variety of species and the numerous islands, inlets and reefs provide excellent fishing grounds.
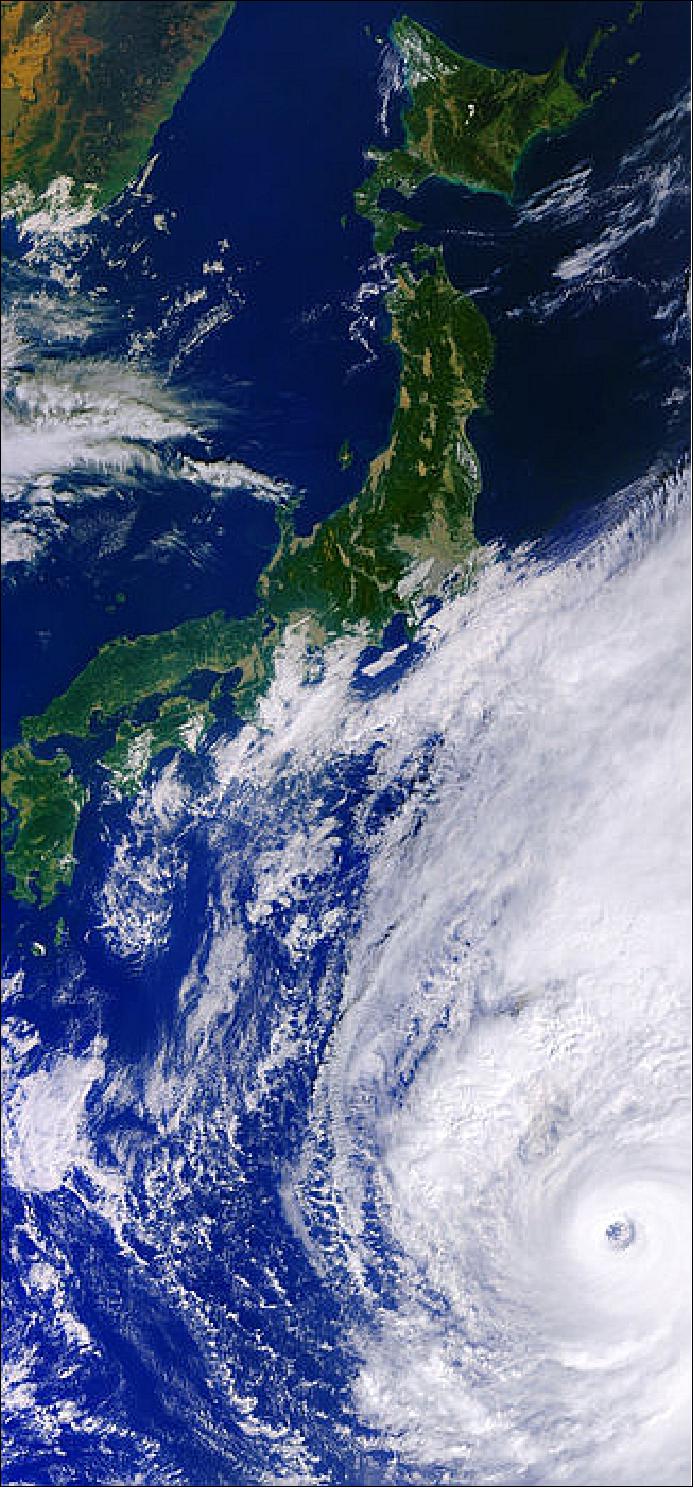
• October 10, 2019: This enormous typhoon Hagibis, which is being compared to a Category 5 hurricane, can be seen in this image captured by the Copernicus Sentinel-3 mission on 10 October at 01:00 GMT (10:00 Japan Standard Time). The eye of the storm has a diameter of approximately 60 km. 4)
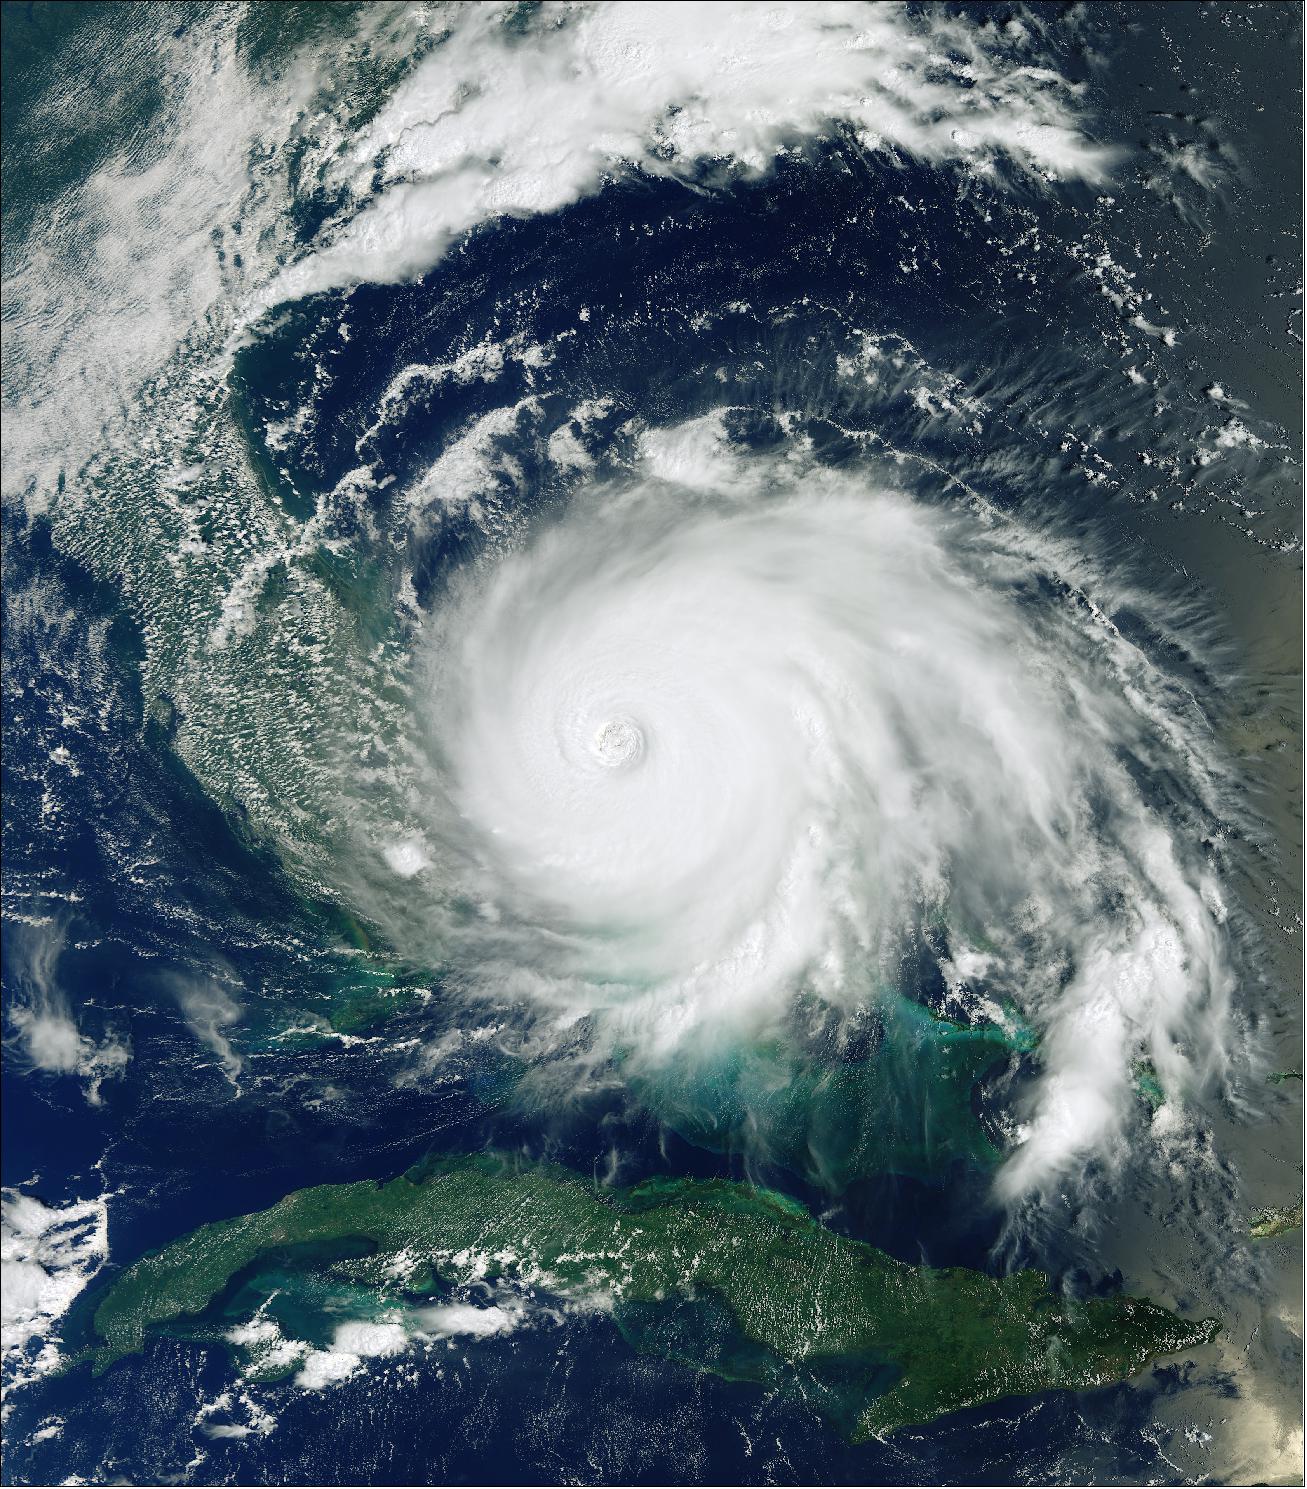
• September 3, 2019: This Copernicus Sentinel-3 image features Hurricane Dorian as it pummels the Bahamas on 2 September 2019 at 15:16 GMT (11:16 EDT). This mighty storm has been parked over the northwest Bahamas for more than 24 hours unleashing a siege of devastation. Storm surges, wind and rain have claimed at least five lives and destroyed homes and infrastructure. 5)
- Dorian is reported to be one of the most powerful Atlantic hurricanes on record. Residents in Florida, US, are also starting to feel the effects of Dorian, though its path is difficult to predict as it creeps slowly over the Bahamas. However, the US National Hurricane Center expect life-threatening storm surges along Florida’s east coast and along the coasts of Georgia and South Carolina. As the US authorities respond to the devastation, Europe’s Copernicus Emergency Mapping Service has been activated to provide flood maps based on satellite data.
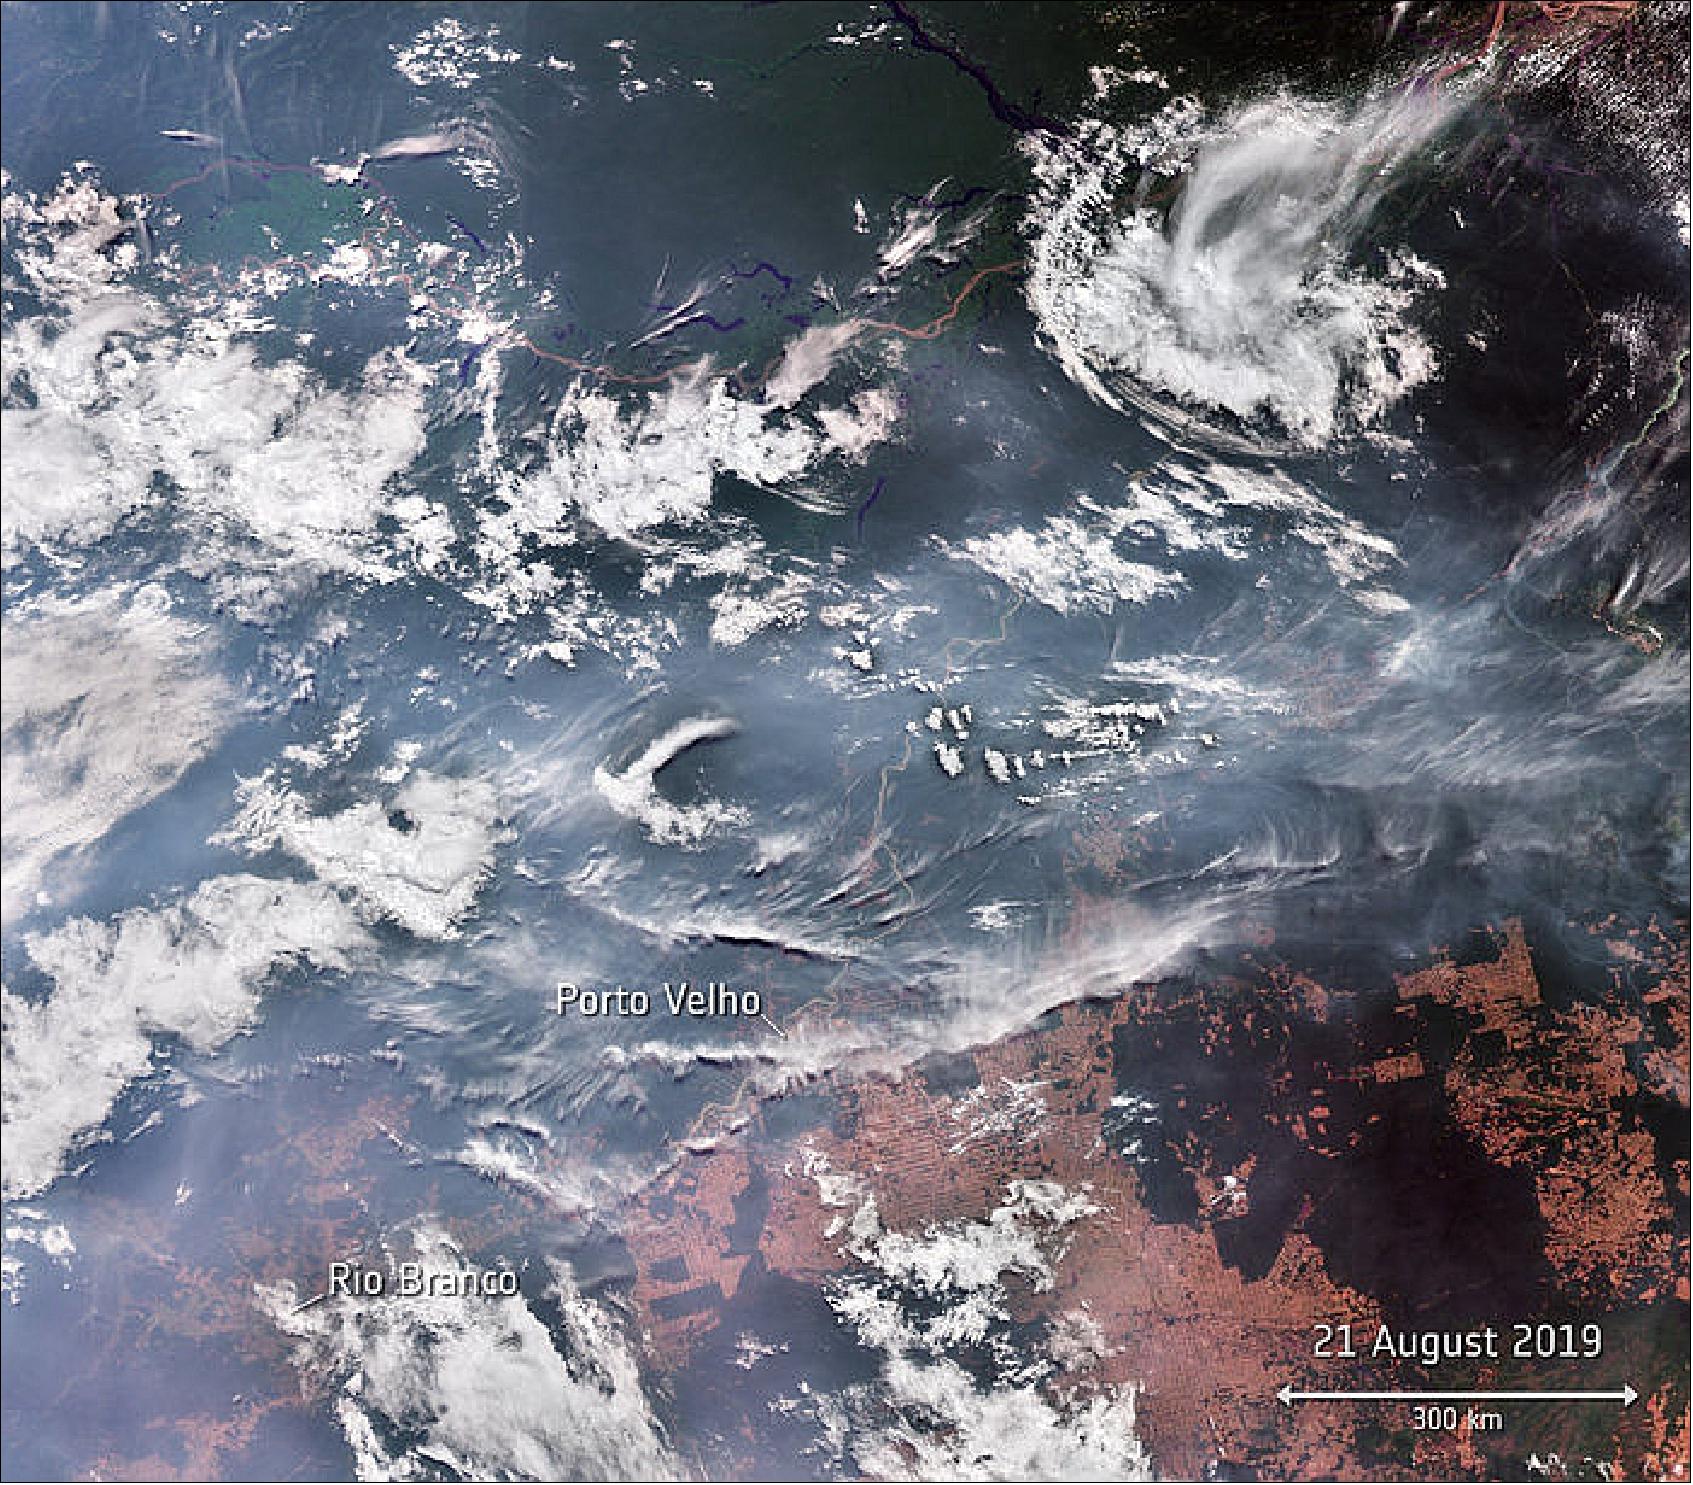
• August 27, 2019: Thousands of fires have broken out in the Amazon rainforest. Satellite data show that there are almost four times as many fires this year compared to the same period last year. Apart from Brazil, parts of Peru, Bolivia, Paraguay and Argentina have also been affected. 6)
- While forest fires normally occur in Brazil’s dry season, which runs from July to October, the unprecedented increase is reported to come from both legal and illegal deforestation which allows land to be used for agricultural purposes, rising global temperatures are also thought to be making the region more susceptible to fire.
- The Amazon basin is the world’s largest tropical rainforest, spanning four countries and is home to millions of plants and animals. It produces around 20% of the world’s oxygen – hence the region being called ‘the lungs of the world’ – and is crucial for helping to regulate global warming as the forests absorb millions of tonnes of carbon emissions every year.
- Using Copernicus Sentinel-3 data, as part of the Sentinel-3 World Fires Atlas, almost 4000 fires were detected from 1 August to 24 August 2019, while last year there were far fewer during the same period, just 1110 fires.
- “By processing 249 images for August 2018 and 275 images for August 2019, we are able to see the incredible number of fires burning in the Amazon. This was achieved by the World Fire Atlas night time algorithm, in order to avoid any possible false alarms with the daytime algorithm,” says ESA’s Olivier Arino.
- Plumes of smoke have spread across the Amazon region. Strong winds have blown smoke to São Paulo – more than 2500 km away— causing a black out in the city. According to the Copernicus Atmosphere Monitoring System (CAMS), smoke has travelled as far as the Atlantic coast.
- CAMS also reports that the fires have released 228 megatons of carbon dioxide into the atmosphere, as well as copious amounts of carbon monoxide. The fires also threaten the lives of many indigenous people.
- The Copernicus Emergency Mapping Service was activated to help respond to the fire. The service uses satellite observations to help civil protection authorities and, in cases of disaster, the international humanitarian community to help to respond to emergencies.
- The severity of the fires has reached the highest political levels. Deemed an international crisis, the G7 nations who met in France yesterday, have offered a 20 million euro emergency funding to assist Brazil and its neighboring countries to put out the fires, according to French President Emmanuel Macron.
- Josef Aschbacher, ESA’s Director of Earth Observation Programs, said, “As we continue to face the ongoing climate crisis, satellites are essential in monitoring wildfires in remote areas, especially for a key component of the Earth system such as the Amazon.”

• July 30, 2019: Hundreds of wildfires have broken out in Siberia, some of which can be seen in this image captured from space on 28 July 2019. Almost three million hectares of land are estimated to have been affected, according to Russia’s Federal Forestry Agency. 7)
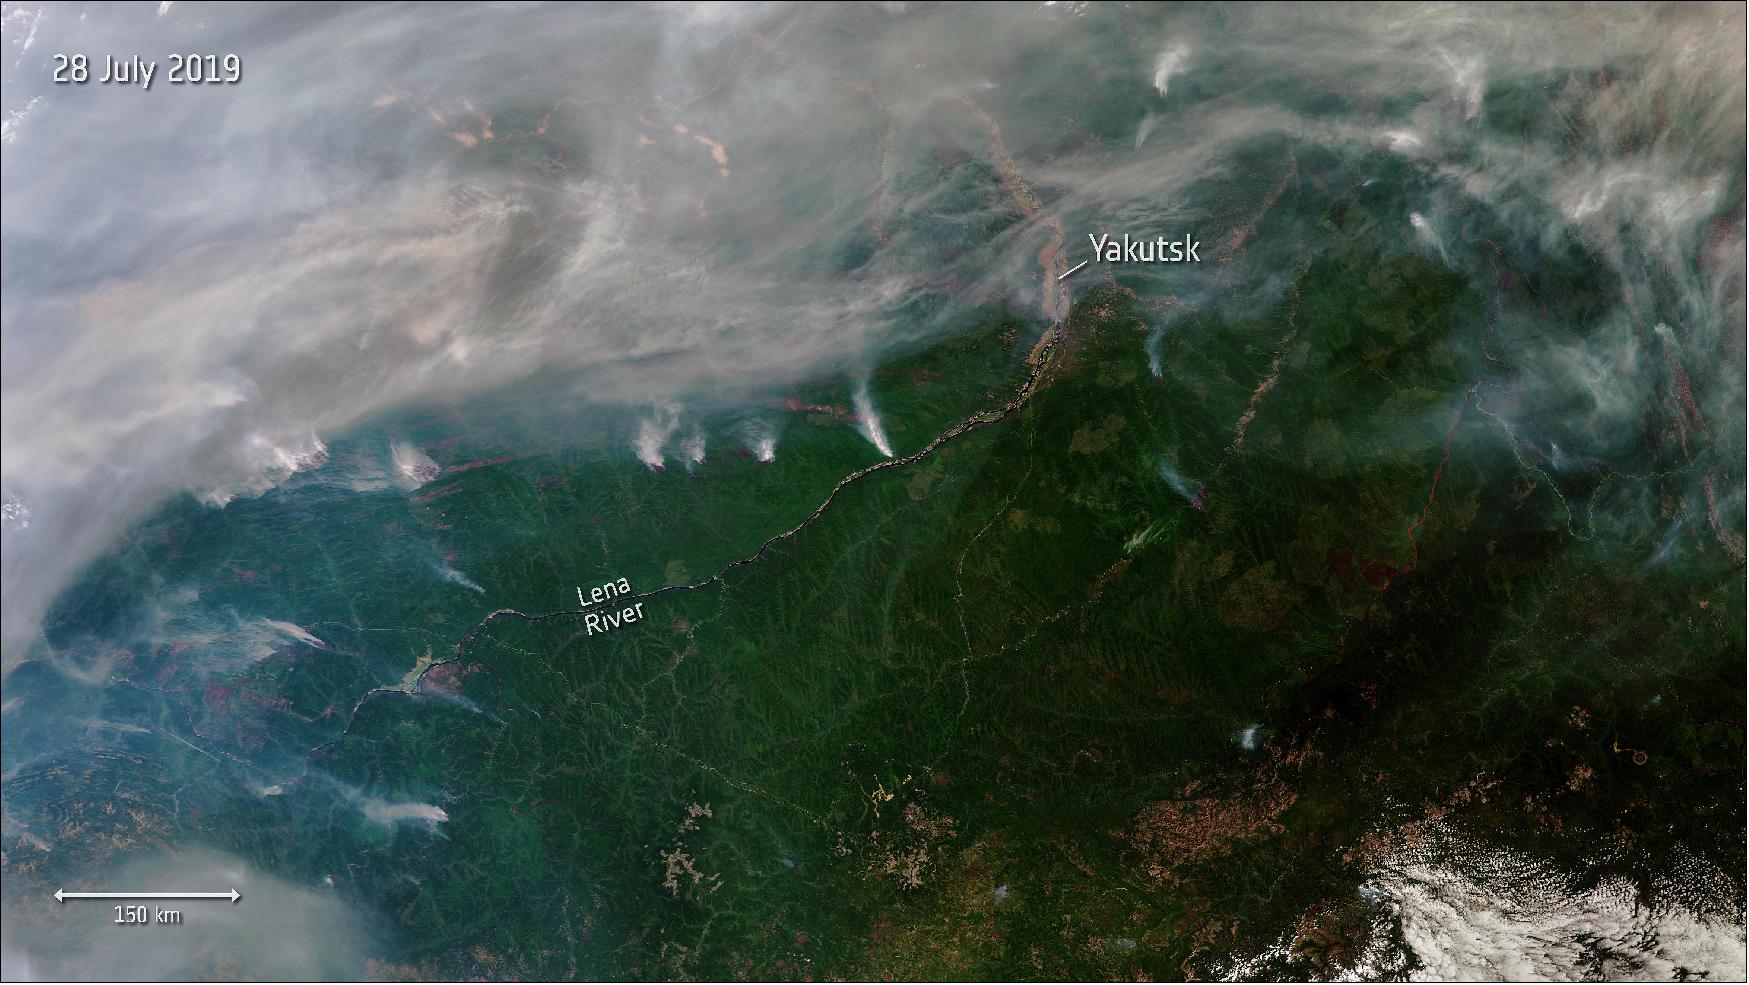
- An unprecedented amount of wildfires have been raging in various regions of the Arctic, including Greenland and Alaska in the US. They have been caused by record-breaking temperatures and lightning, fuelled by strong winds.
- Wildfires release harmful pollutants and toxic gases into the atmosphere. According to the WMO (World Meteorological Organization), fires in the Arctic released around 50 megatons of carbon dioxide in June alone – equivalent to Sweden’s total annual emissions.
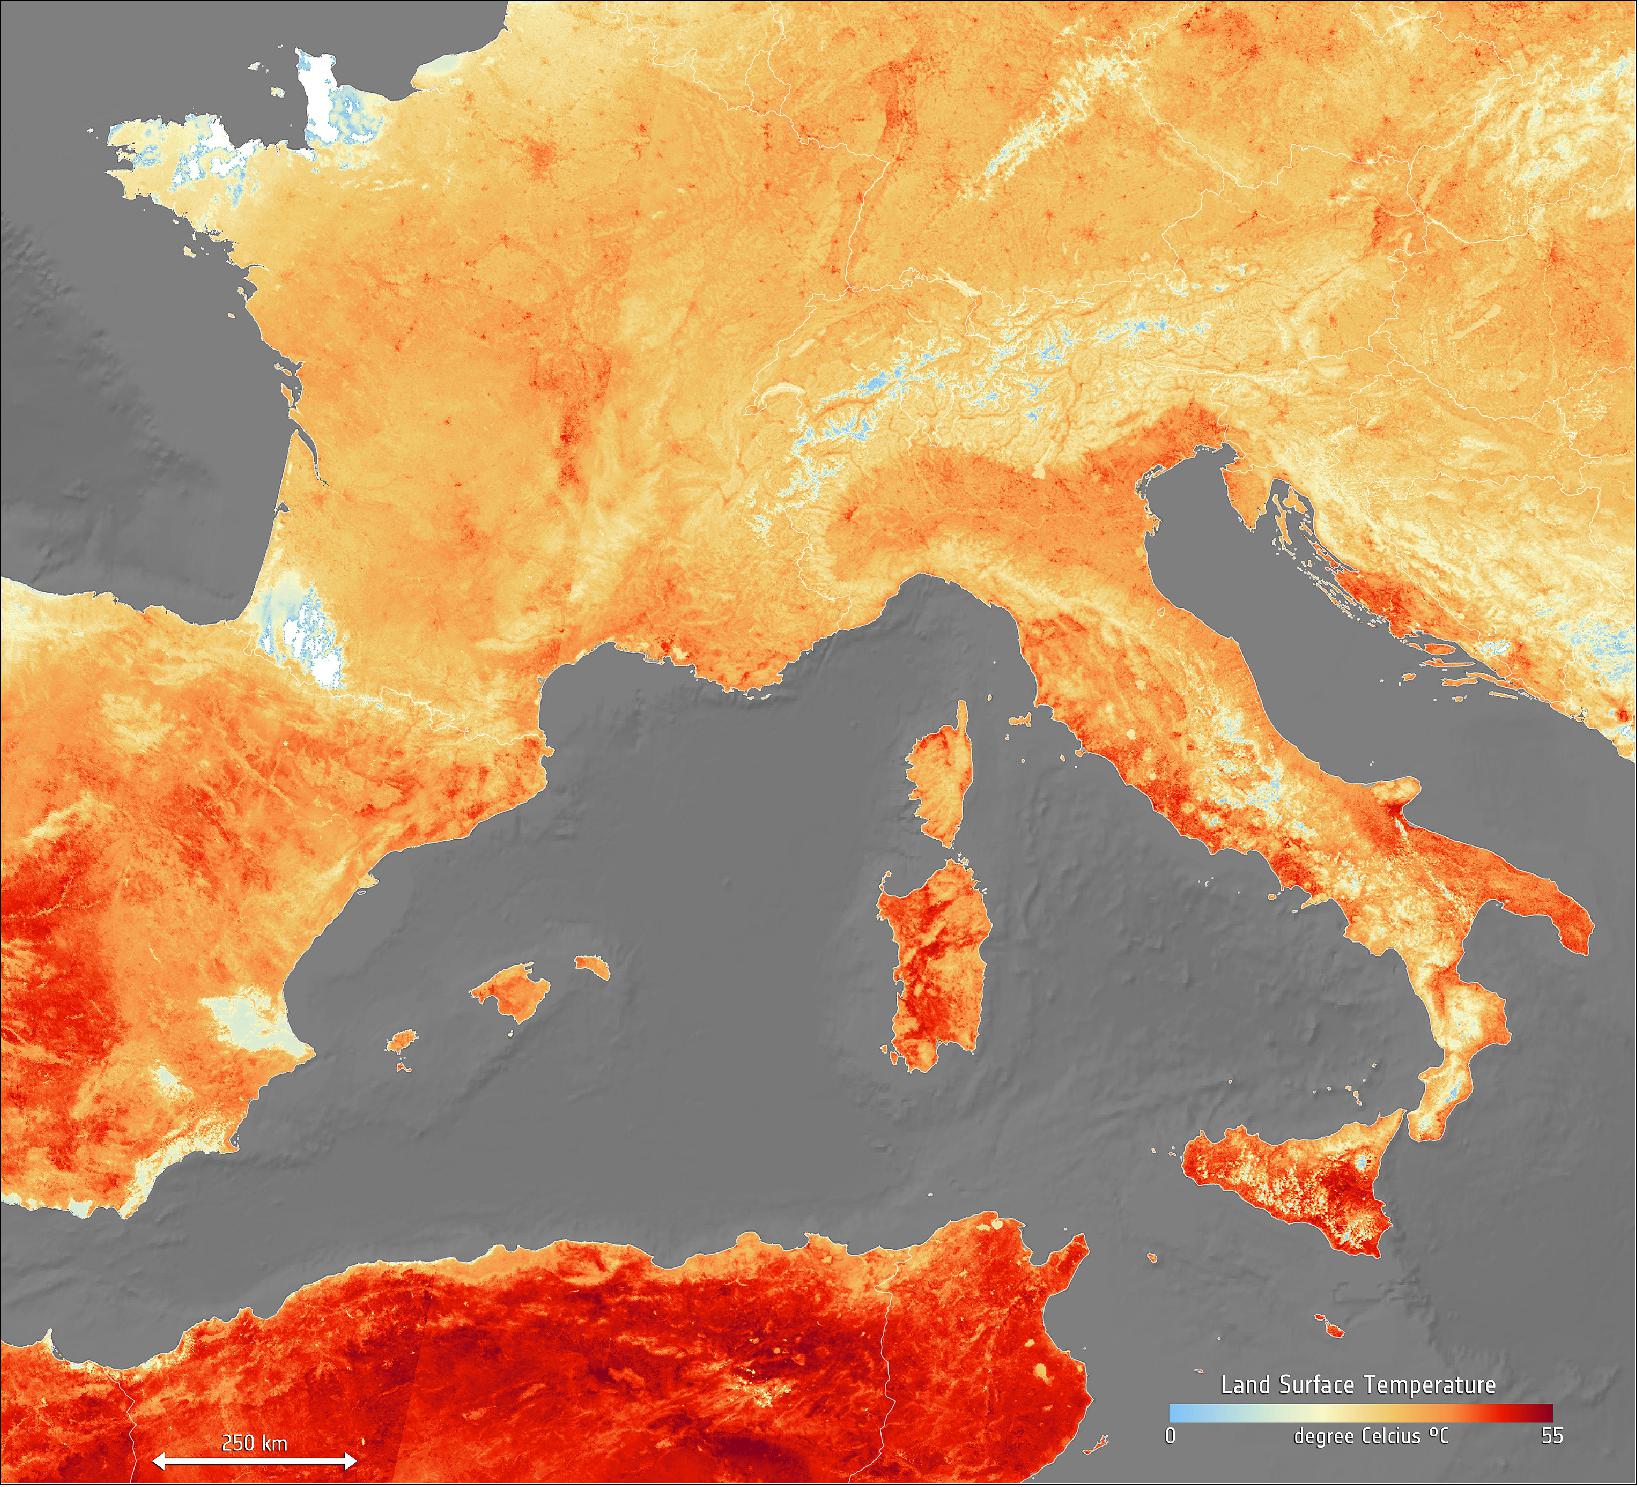
• July 25, 2019: An extreme heatwave has hit Europe once again this week, following extreme weather in June. High temperatures are expected to peak today, reaching as high as 39—40°C, with Netherlands, Belgium and Germany recording their highest ever temperatures. Paris reached a sweltering 41°C, breaking its previous record in 1947. 8)
- The map has been generated using the Copernicus Sentinel-3’s SLSTR (Sea and Land Surface Temperature Radiometer). Whereas weather forecasts use predicted air temperatures, the satellite measures the real amount of energy radiating from Earth – therefore this map better represents the real temperature of the land surface. Clouds are visible in white in the image, while the light blue represent snow-covered areas.
- The heatwave in June broke several records for many countries, with France reaching over 45°C for the first time. Germany, Hungary, Poland, Austria, Czech Republic, Slovakia also reached peak temperatures.
- In many countries, red heat warnings have been issued, including Italy, Spain and France and civilians are advised to avoid travelling and stay hydrated.
• June 27, 2019: With some places expecting to be hit with air temperatures of over 40°C in the next days, much of Europe is in the grip of a heatwave – and one that is setting record highs for June. According to meteorologists this current bout of sweltering weather is down to hot air being drawn from north Africa. 9)
- Countries worst hit by this unusual June weather include Spain, France, Germany, Italy and Poland. In many places heat warnings have been issued and cities such as Paris have connected fountains and sprinklers to hydrants to help give people some relief. Wildfires in Catalonia, said to be the worst in two decades, have already ripped across 5000 hectares of land and are being blamed on the heat and strong winds.
• June 24, 2019: An unexpected and powerful eruption started at Raikoke volcano in the Kuril Islands on 21 June 2019. 10)
- The Kuril Islands are an island chain, located in the Pacific Ocean between northern Japan (i.e. Hokkaido) and the Kamchatka Peninsula. The Kuril Islands are claimed by Russia.
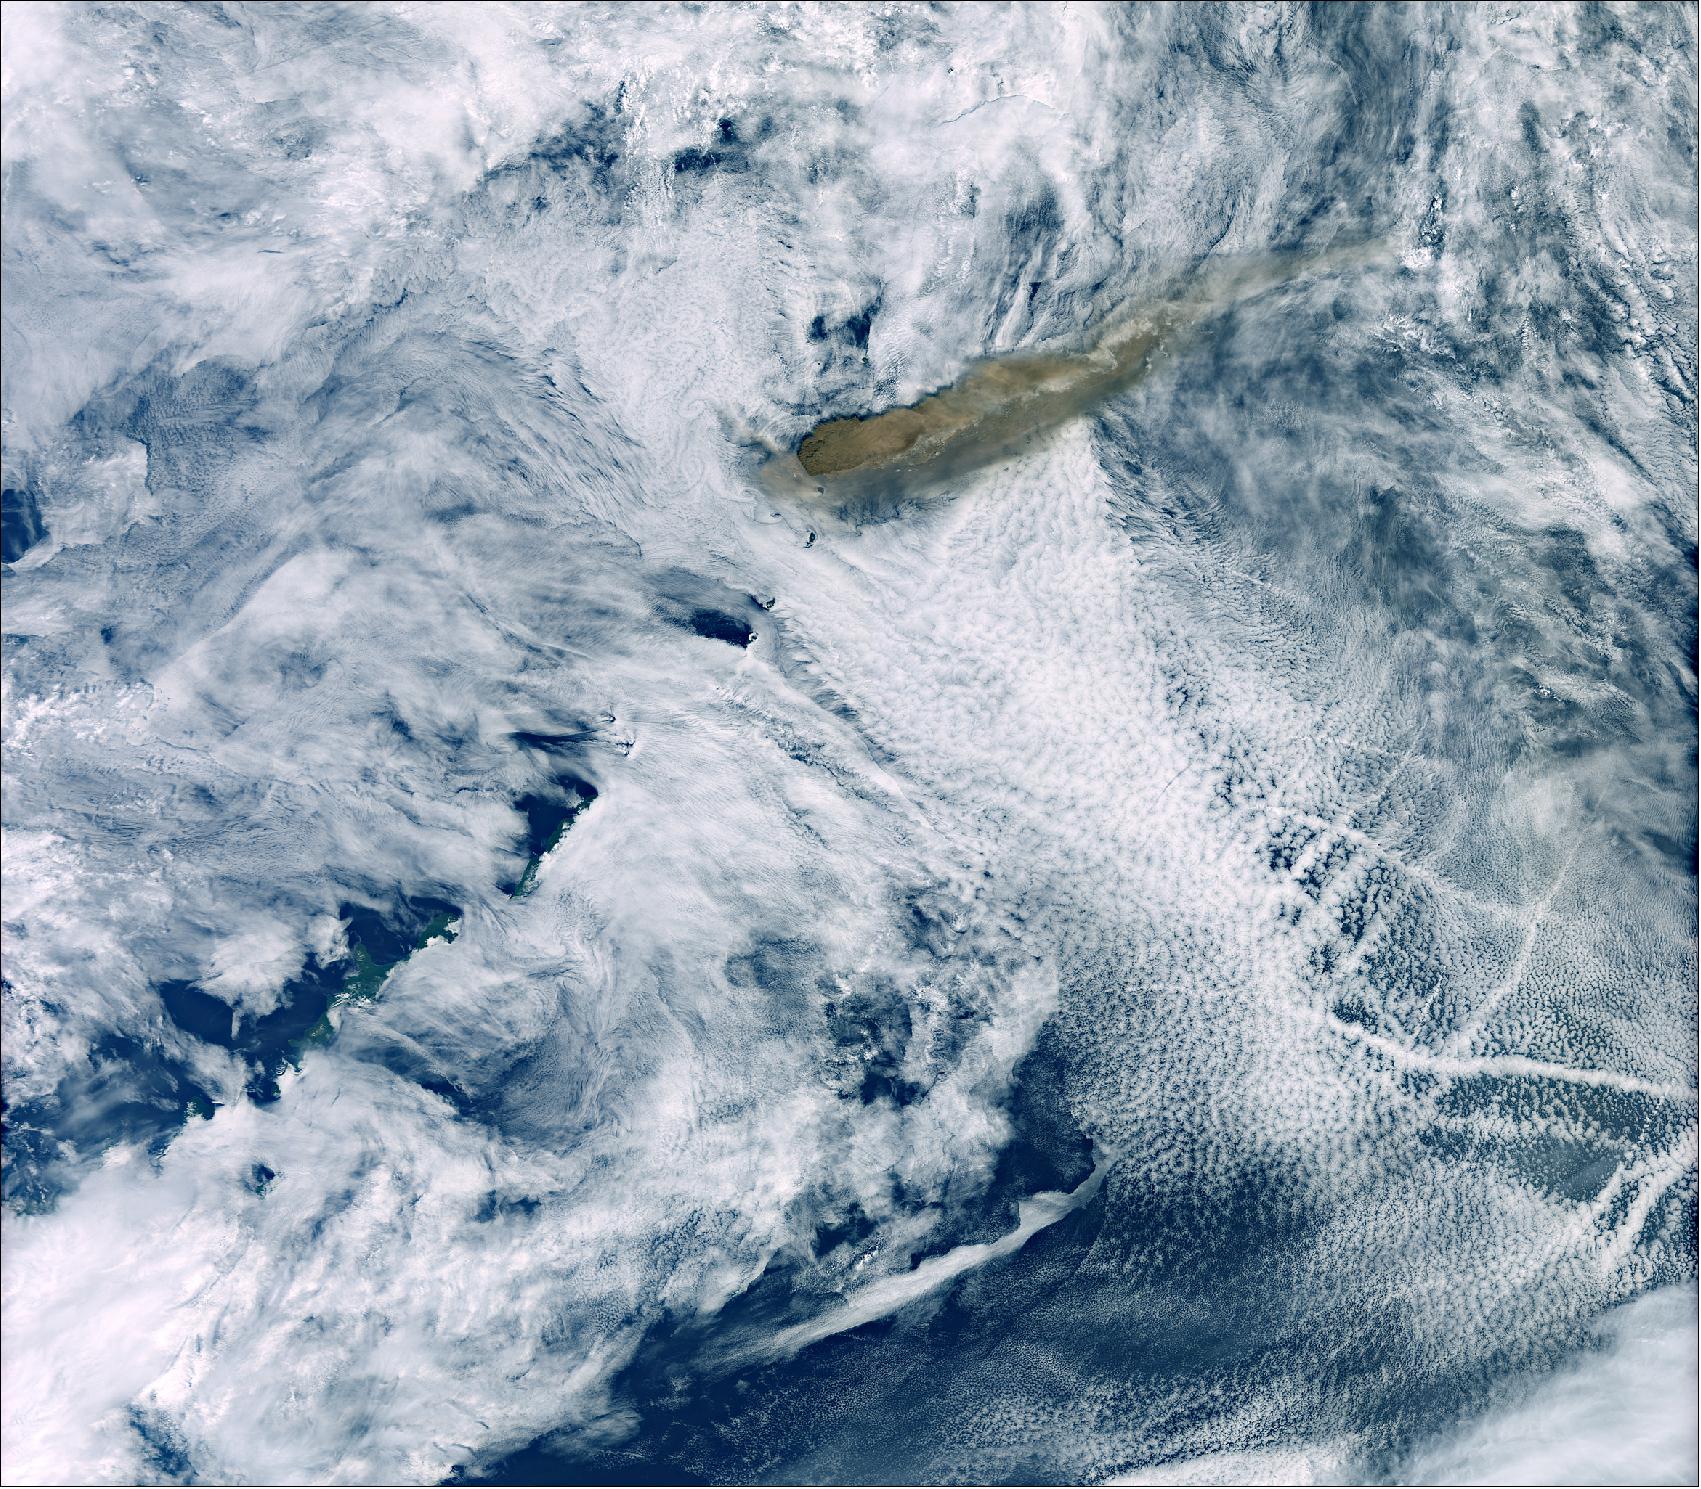
- According to the Volcanic Ash Advisories Center (VAAC) Tokyo, the thick ash plumes rose to approximately 13 km above sea level. Weather officials warned aircraft flying over the area to be careful of any volcanic ash following the eruption.
- The majority of the plume is now drifting over the Bering Sea. Raikoke is a circular stratovolcano located on an inhabited island. Its last eruption was in 1924.
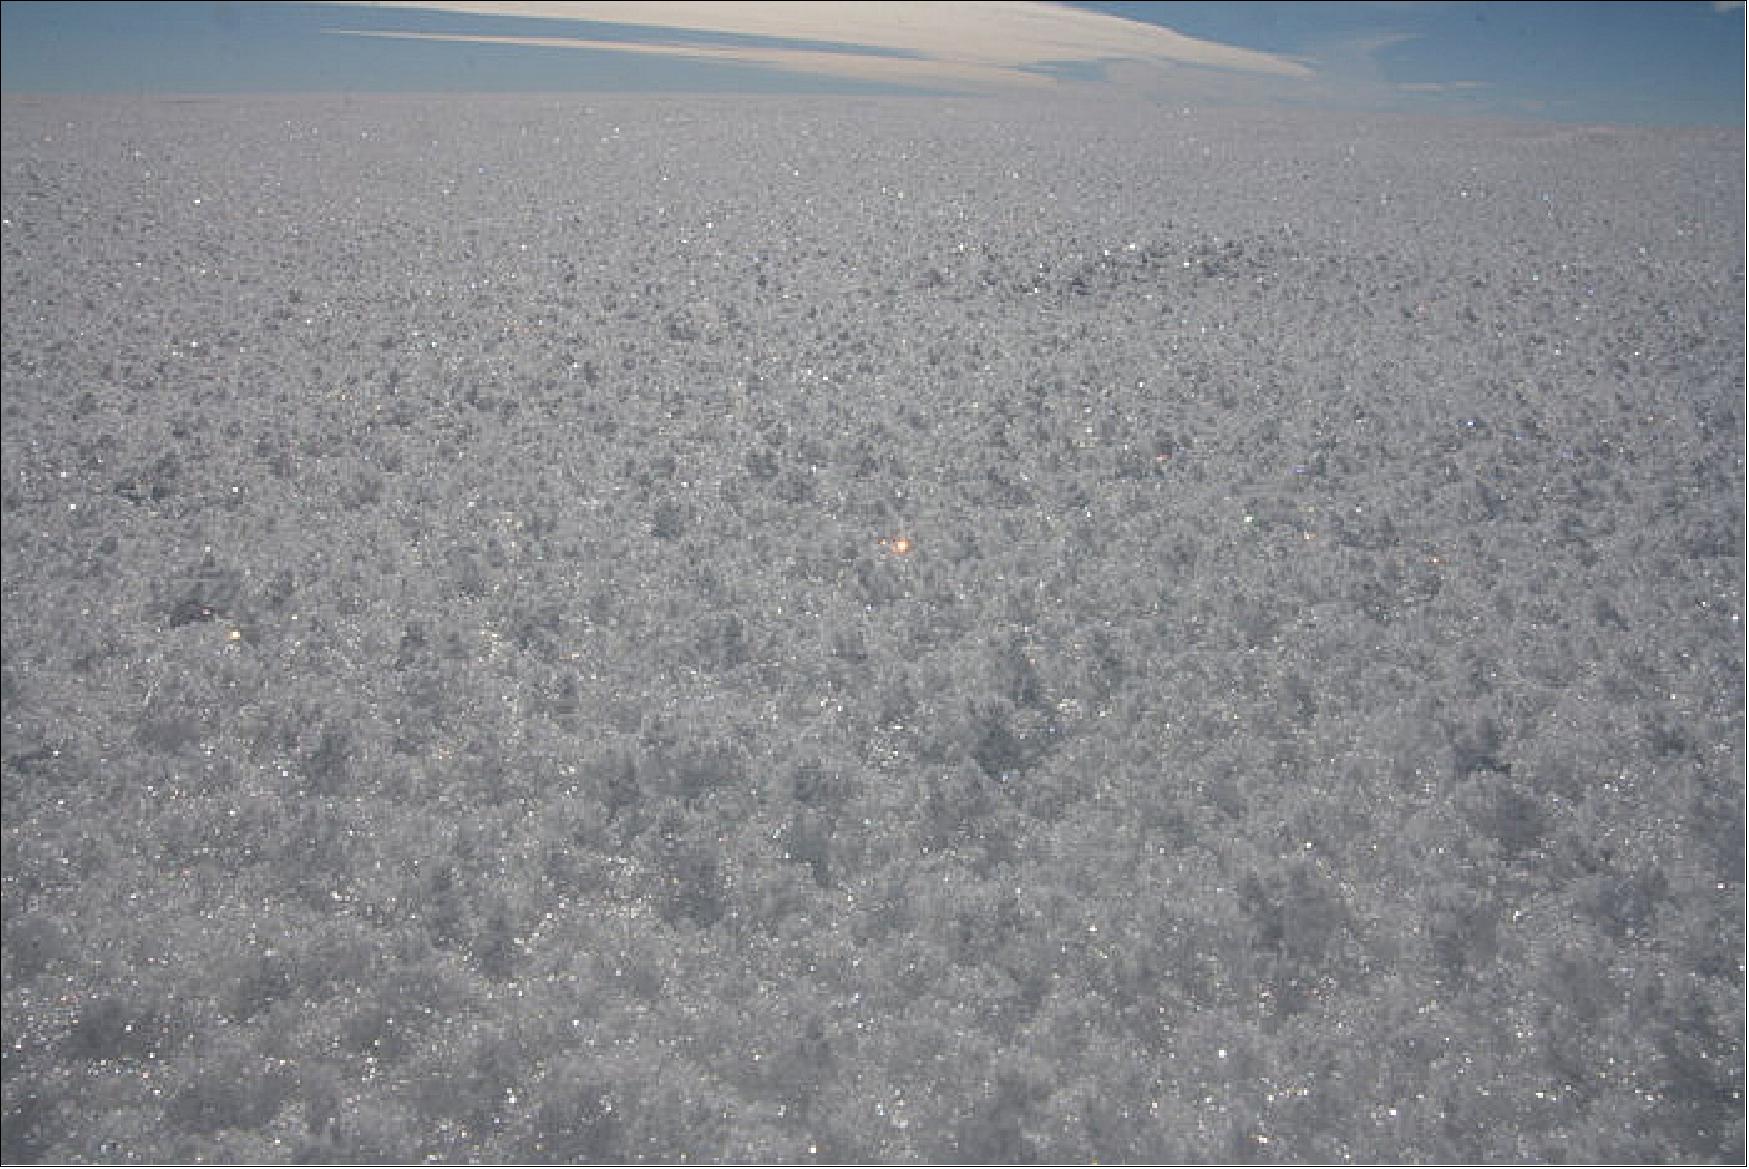
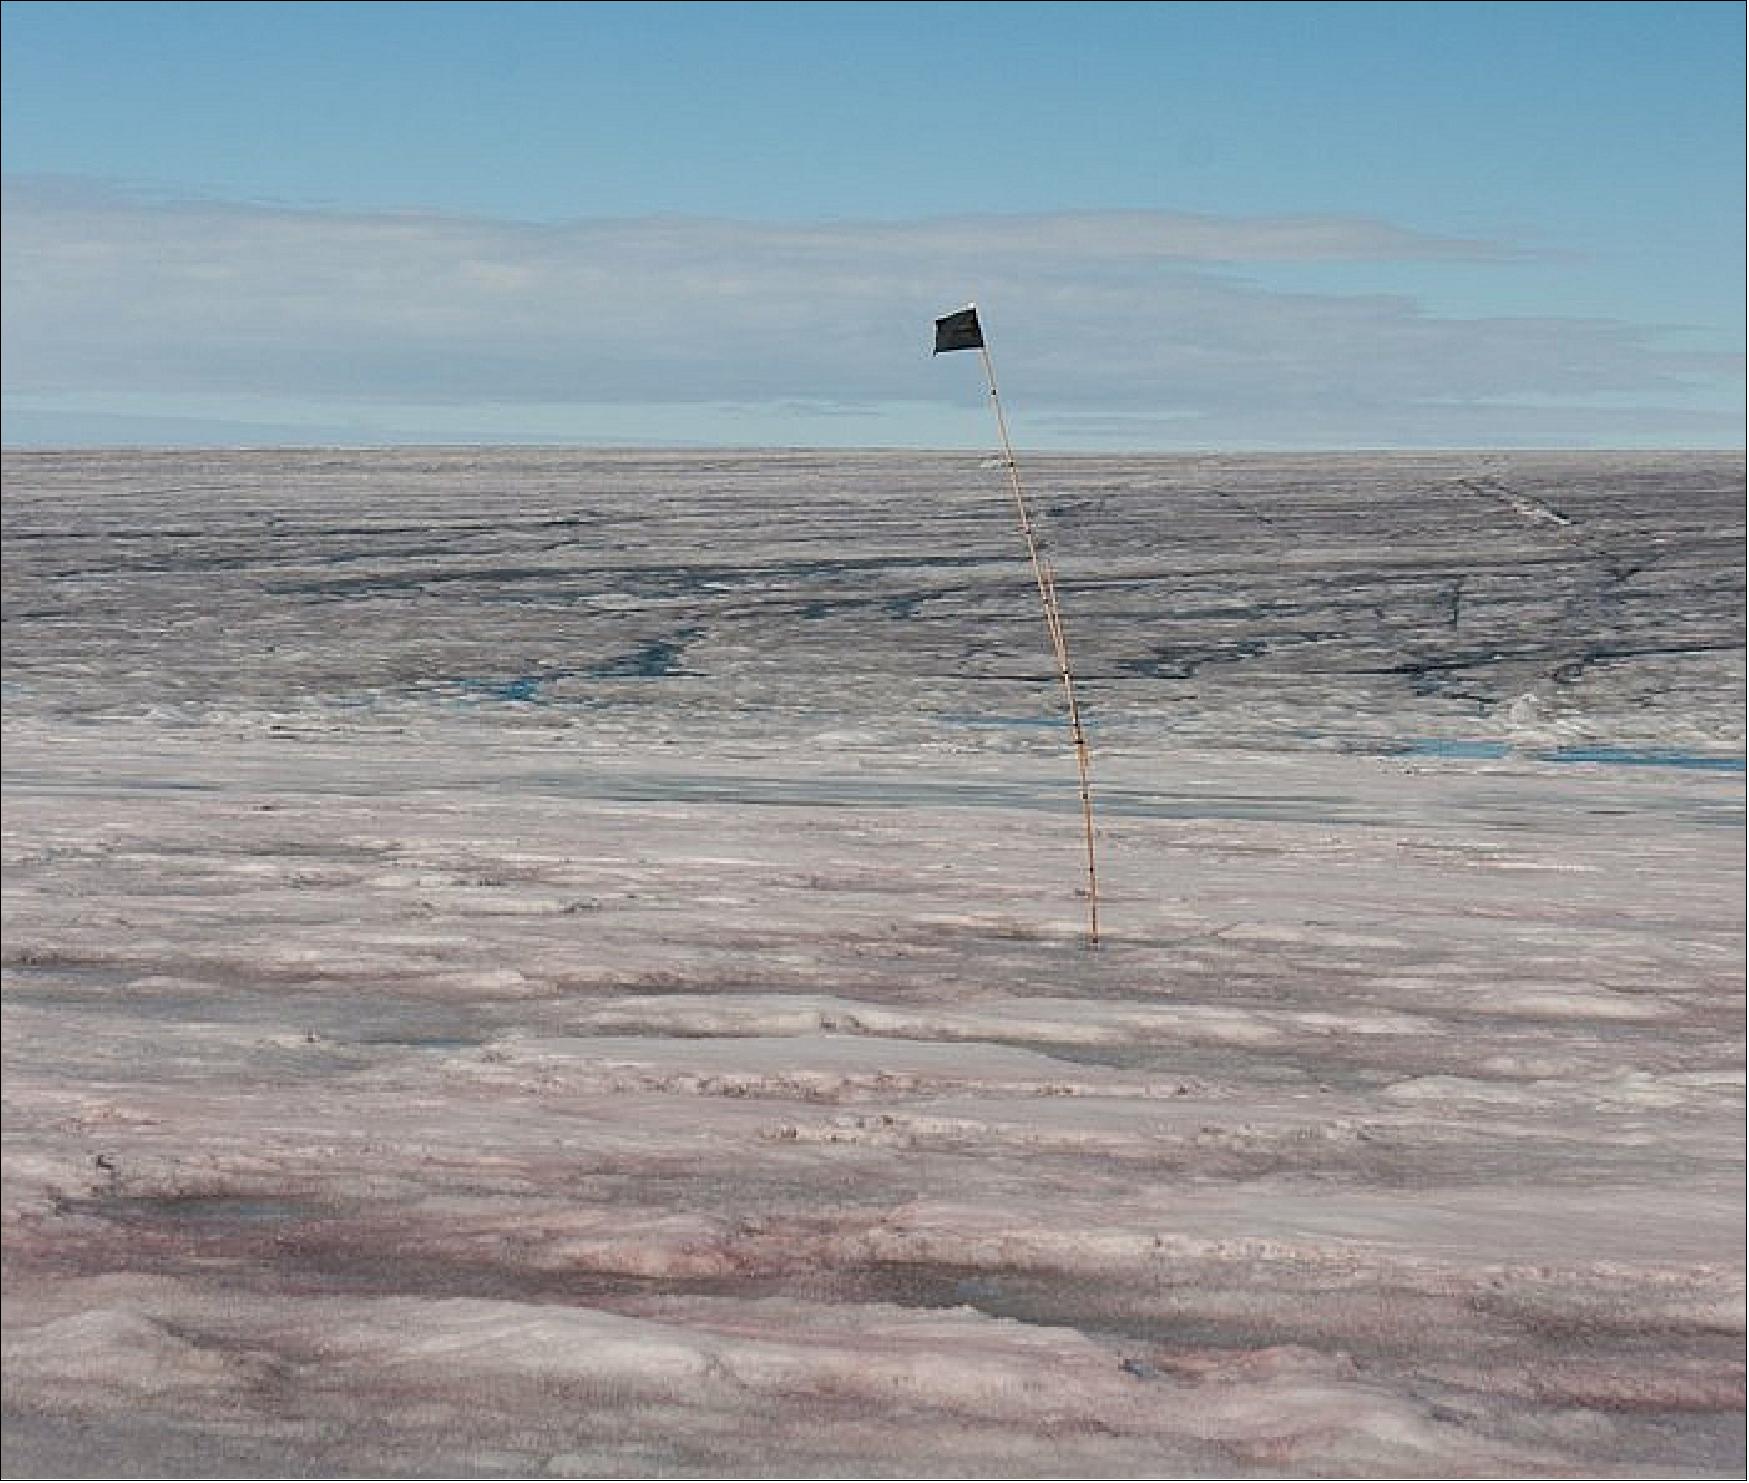
• May 29, 2019: Most of us probably wouldn’t think of describing snow in terms of its grain size. However, grain size is fundamental to the amount of sunlight that snow reflects back into space – its albedo. With both snow and albedo part of the climate system, scientists are applying a novel analytical theory to Copernicus Sentinel-3 data and shedding new light on Greenland’s changing albedo. 11)
- The amount of sunlight absorbed or reflected by Earth’s surface drives our climate and weather. About one-third of the sunlight that hits Earth is reflected back into space and the other two-thirds is absorbed by the land, oceans and atmosphere. This ratio is governed by the reflectivity, or albedo, of the surface that the sunlight hits.
- Surfaces with lighter colors reflect more sunlight than darker surfaces. An everyday example of this is the difference we feel on a hot sunny day when wearing black clothes compared to wearing white. Earth is affected in the same way.
- So hypothetically, if the planet were completely covered in ice, it would reflect over 80% of incident sunlight back into space. On the other hand, if it were covered by dark green forest, it would only reflect about 10%.
- The albedo of Earth’s surface varies naturally according to the changing colors of the season, but long-term trends in changing snow and ice cover, as well as changing vegetation cover and air pollution, are having an impact on the overall balance of Earth’s albedo – and, hence, on how much heat it absorbs.
- The Global Climate Observing System lists both albedo and snow as essential climate variables, which when measured and studied over time are used to understand, monitor and predict climate change.
- Ice and snow are often cited as the first causalities of climate change, and are measured and monitored from space in a variety of ways. However, while ice and snow may be present, the melting process affects its albedo.
- Snow grain size is a fundamental property of snow and is directly proportional to its surface area. Fresh dry snow tends to have a small grain size (under 0.5 mm in diameter), but as it melts the grain size grows and the larger grains reflect less sunlight.
- Thanks to Alex Kokhanovsky from Vitrociset who, along with several authors, published an elegant analytical theory, scientists have a fast new way of retrieving snow grain size from satellite images.
- Scientists from the Geological Survey of Denmark and Greenland (GEUS) in Copenhagen are coupling this theory with data from the Copernicus Sentinel-3 satellites’ Ocean Land and Color Instruments – as the animation above shows.
- Jason Box, from GEUS, explains, “One way of measuring the albedo of snow is to monitor how the surface color changes because of pollution such as from wildfire soot. But this doesn’t give us the whole story. Remarkably, this exciting new theory allows us to retrieve snow grain size from satellite optical images.
- “Through ESA’s Earth Observation Science for Society program, we have been able to demonstrate this over Greenland. We have found that pulses of warm air cause dark blemishes far inland on the ice sheet, contributing to increased climate sensitivity.”
- In fact, the Copernicus Sentinel-3 satellite constellation can now take the relay in maintaining the climate record on snow albedo, which was first provided by the AVHRR (Advanced Very High Resolution Radiometer) instruments on the US NOAA and Europe’s MetOp satellites, and then the MODIS (Moderate Resolution Imaging Spectroradiometer) on the US Terra and Aqua satellites.
- In the future, the method will be extended and applied to areas with more complex terrain than Greenland. Furthermore, grain size data is now on the horizon for being used operationally to improve weather, hydrological and hazards forecasts, in service to society.
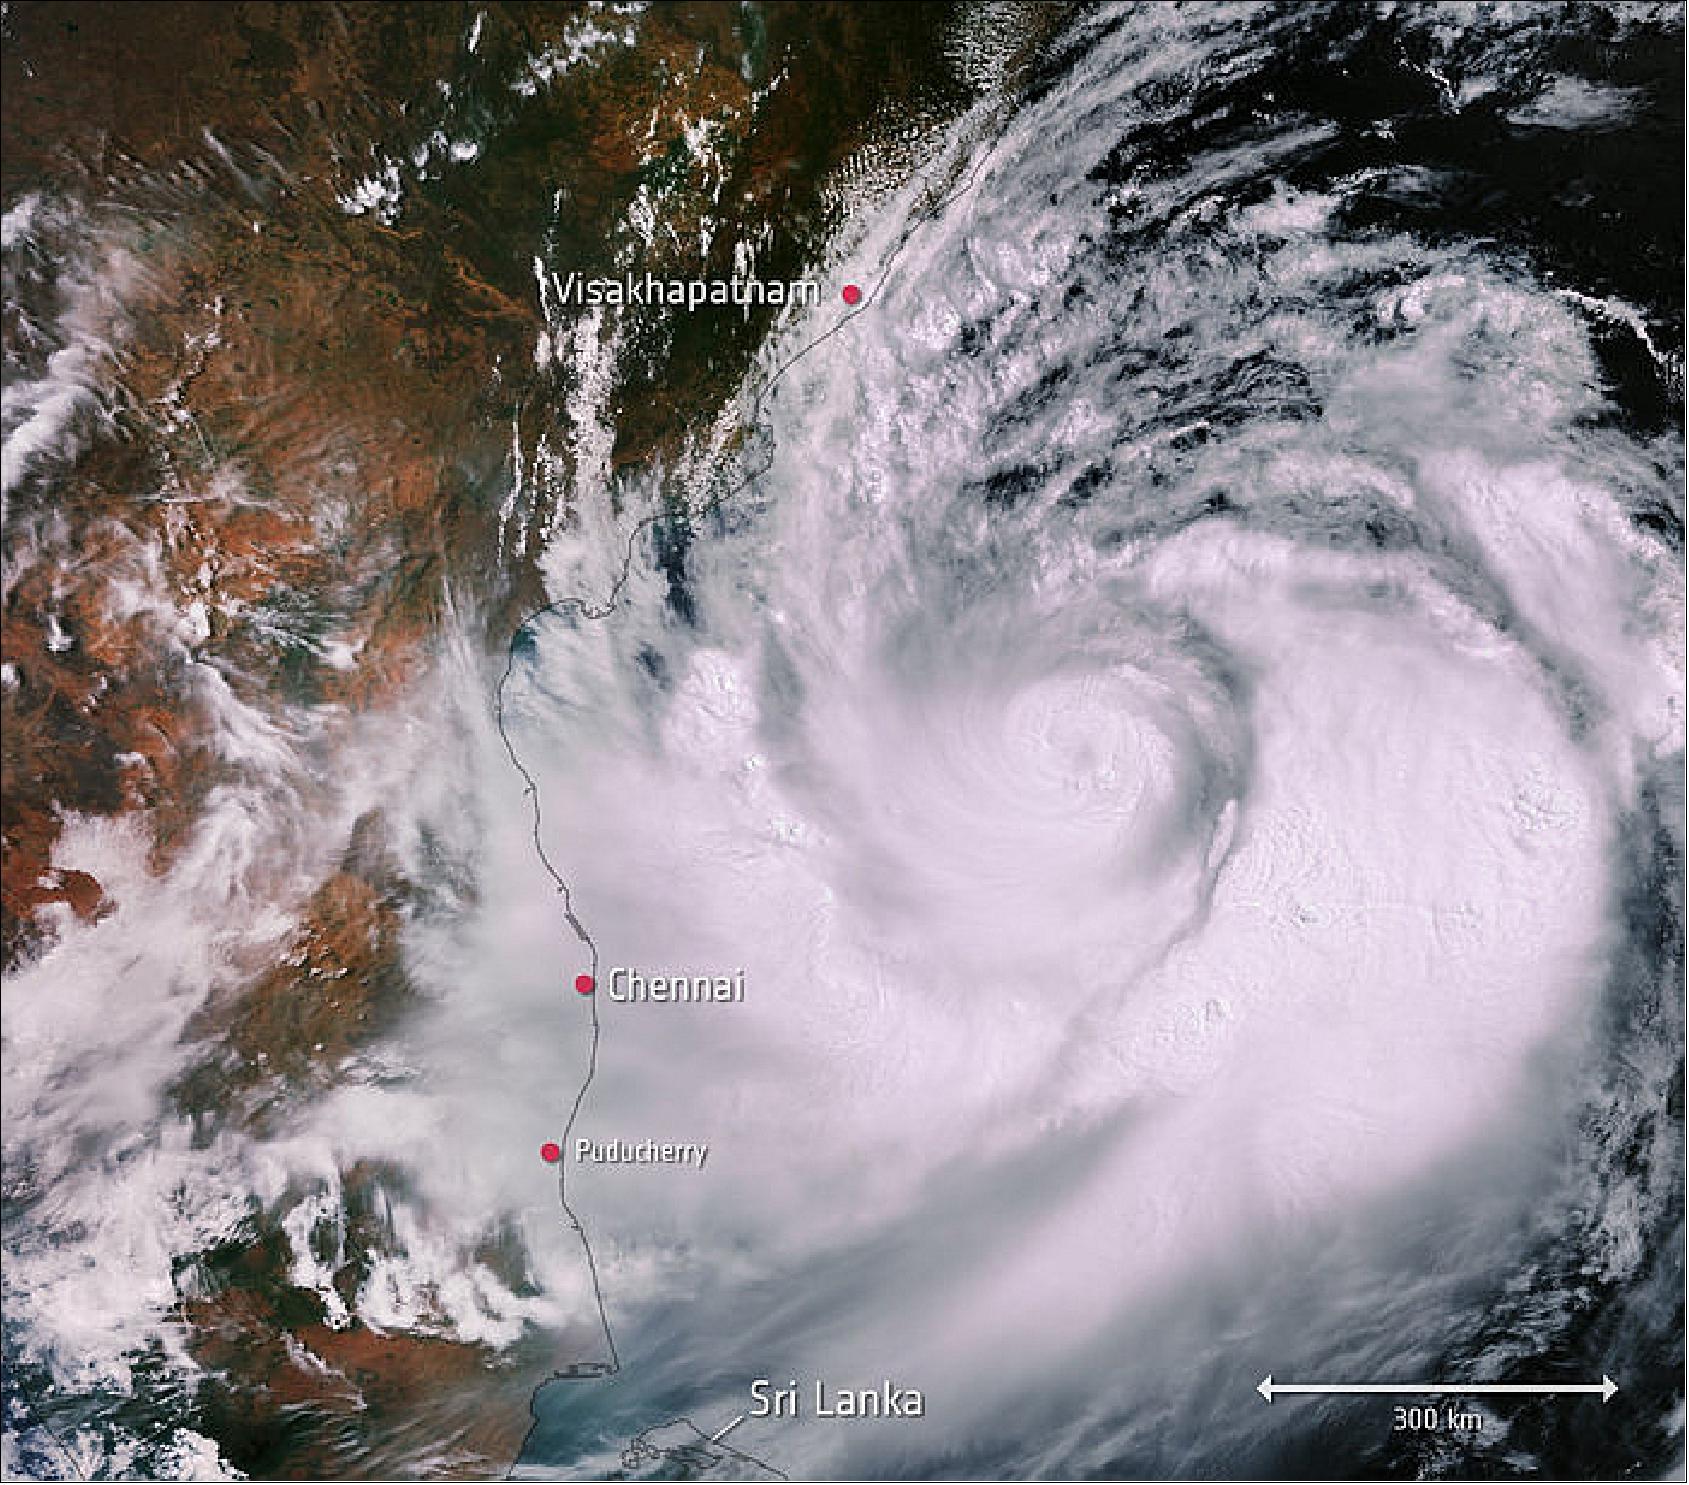
• May 02, 2019: This Copernicus Sentinel-3 image, captured just yesterday on 1 May 2019, shows Cyclone Fani. Brewed in the Bay of Bengal and heading westwards, the cyclone is expected to make landfall on India’s east coast on Friday 3 May. 12)
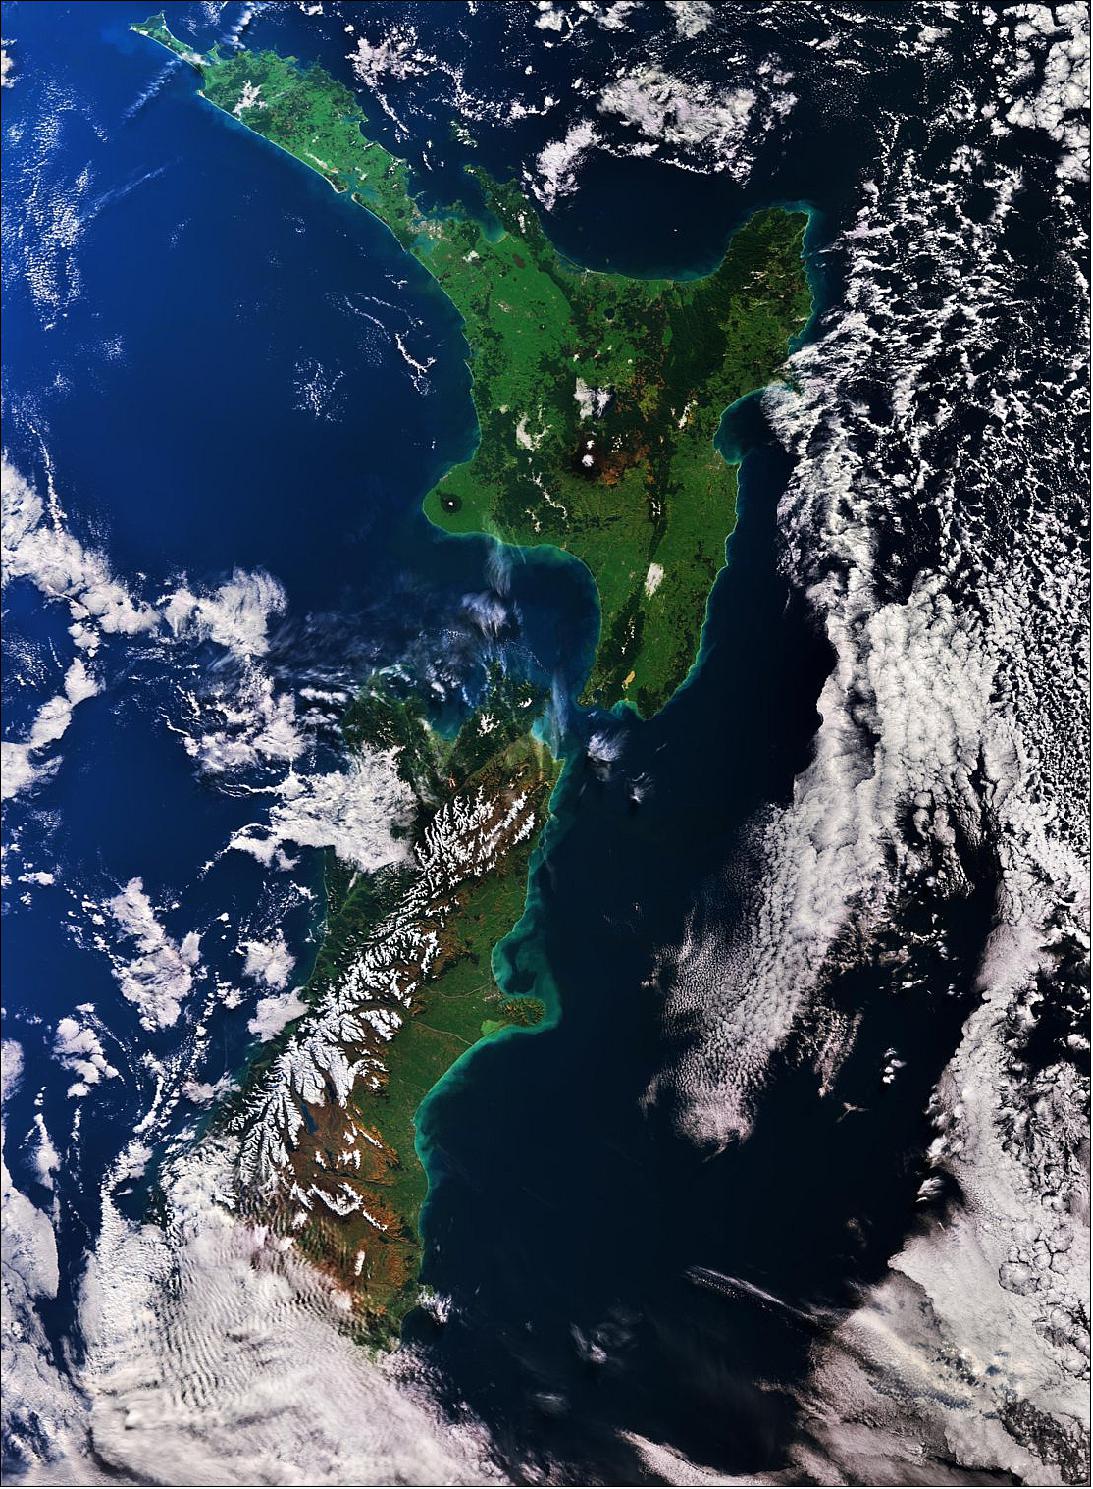
• March 8, 2019: The Copernicus Sentinel-3A satellite takes us over New Zealand, with the image centered over Cook Strait between the North and South Islands (Figure 19). 13)
- On the island’s east coast, bright turquoise colors in the Pacific Ocean suggest the presence of sediment being carried into the ocean by river discharge as well as algal blooms.
- Algal blooms occur when there is a rapid increase in the number of algae in water, and are usually a result of slow water circulation and high water temperatures, they can be toxic and potentially dangerous to both fish and humans.
- The emerald green color of the coastal Lake Ellesmere (Te Waihora), below the circular peninsula jutting out, is most likely because of a high concentration of chlorophyll. This brackish lake is home to over 150 species of birds and more than 40 species of fish thanks to the influx of both freshwater and marine species migrating in and out of the lake.
- Across the Cook Strait, nestling on the southern tip of the North Island, the image shows a body of water called Lake Wairarapa. It is yellow-ochre in color owing to high concentrations of sediment. This shallow lake, which is surrounded by wetlands and farms, drains into the smaller Lake Onoke, further south.
- Tongariro National Park, in the center of the North Island, is a UNESCO World Heritage Site owing to its natural and cultural significance. The park has three active volcanoes. At 2797 m high, the snow-covered Ruapehu – a majestic stratovolcano – is the most visible in the image. The area’s rugged terrain and jagged rocks made it the ideal location for filming the Lord of the Rings trilogy.
- On the far west, the snow-capped cone of Mount Taranaki is in the middle of Egmont National Park. The mountain is surrounded by dark-colored dense forest that is in contrast to the unprotected pasture outside of the park’s circular boundary. It is considered one of the most symmetrical volcano cones in the world.
• March 06, 2019: A new study of the Sentinel-3 mission shows its great potential for precision elevation data observations of the Antarctic ice sheet proving a valuable addition to monitoring efforts in the region, according to work published this week in The Cryosphere. The study, led by researchers from the new joint Lancaster University (UK)-CEH Centre of Excellence in Environmental Data Science (CEEDS), alongside ESA (European Space Agency) and industry partners, shows the potential of Sentinel-3 — one of the EU Copernicus satellite missions — to contribute towards long-term ice sheet monitoring programs. 14) 15)
- The scientists also found that Sentinel-3 could detect areas where the ice surface was rapidly lowering, thereby establishing the satellite's credentials as a new platform which can help to monitor Antarctica's contribution to sea level rise.
- Determining how well Sentinel-3 functions over ice sheets is particularly important given that CryoSat-2, ESA's dedicated polar mission, is already operating well beyond its planned lifetime.
- CryoSat-2 was designed to fly in a unique orbit, to maximize coverage of coastal areas of the ice sheet, and to map the regions close to the North and South Poles that were beyond the reach of previous satellites.
- Although Sentinel-3 — which has to balance many applications — cannot match this coverage, it still holds potential as a valuable long-term monitoring platform for decades to come.
- Dr Mal McMillan, lead author and co-Director of CEEDS, said: "Although the Sentinel-3 altimeter was primarily designed to monitor the oceans, we wanted to test how well it works over ice, and to see whether it is able to detect signs of glaciological change. Through the support offered by ESA's Scientific Exploitation of Operational Missions element, we have been able to study the performance of the Sentinel-3 mission for several years now, and we are pleased to be able to publish these results."
- He added: "From what we can see here, with just two years' worth of data, Sentinel-3 is going to be a very useful tool for surveying the Antarctic ice sheet."
- Sentinel-3 uses a radar technique called Delay-Doppler altimetry [use of SRAL (SAR Radar Altimeter) instrument] to make high resolution measurements of the height of the ice sheet.
- Where the ice is relatively flat, Sentinel-3 could map its height to within 10 cm of measurements taken by aircraft, as part of NASA's Operation Icebridge campaign.
- Dr McMillan explained: "This level of accuracy means that we can also use Sentinel-3 to track important features on the ice surface, like the imprint of active subglacial lakes draining and refilling beneath several kilometers of ice."
- Using radar satellites like Sentinel-3 over ice nonetheless has its challenges. For example, measurements over Antarctica's steeper, craggy coastal areas were less accurate because of how the rough landscape affects the radar signal.
- Future research into Sentinel-3's performance, as well as further improvements to data processing, will help take these effects into account. In the meantime, Sentinel-3 has already shown its value as a new tool for detecting ice sheet change.
- Co-author Jérôme Benveniste of the European Space Agency summarized: "We are delighted with the early promise shown by Sentinel-3 for ice sheet monitoring, and are increasingly confident that it will be a long-term asset to climate science."
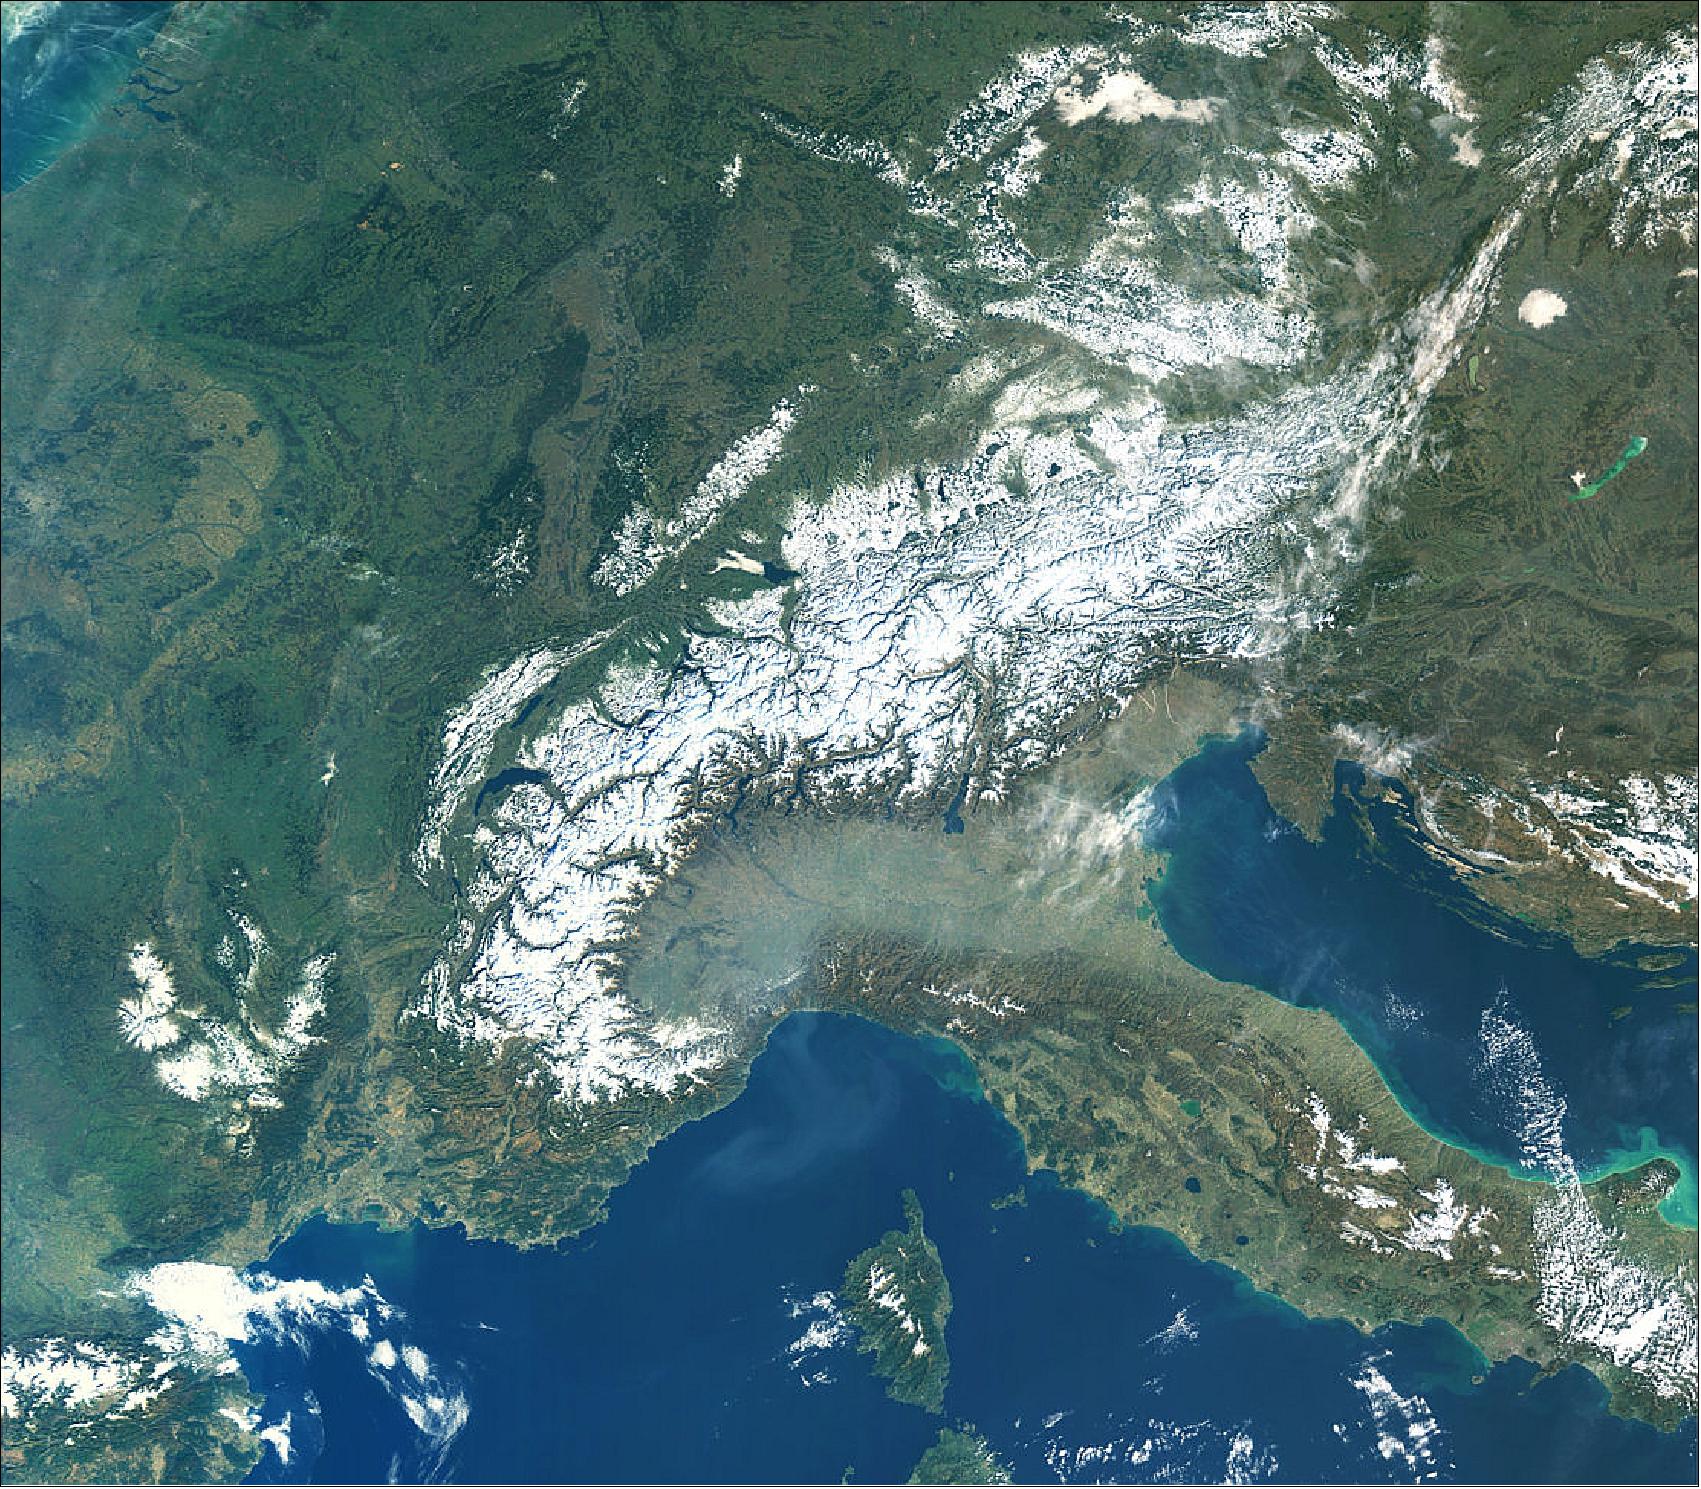
• March 01, 2019: The Alps extend 1200 km through eight different countries: France, Monaco, Italy, Switzerland, Liechtenstein, Germany, Austria and Slovenia. This mountain range, which is inhabited by some 20 million people, covers an area of approximately 200,000 km2. 16)
- The Copernicus Sentinel-3A satellite takes us over the high, snow-studded Alps under clear skies (Figure 21). Patches of snow are visible on the island of Corsica, to the left of mainland Italy, Croatia, to the right, and at the bottom of the Apennines in central Italy. Most of Italy’s rivers find their source in the Apennines, including the Tiber and the Arno.
- The Adriatic Sea to the east of Italy is visible in turquoise, particularly the coastal area surrounding the Gargano National Park, jutting out. This light-green color of the sea along the coast is likely to be caused by sediment carried into the sea by river discharge.
- Directly to the right of the Alps, the image shows a pale-green Lake Neusiedl straddling the Austrian-Hungarian border. Neusiedl, meaning ‘swamp’ in Hungarian, is the largest endorheic lake in central Europe, meaning water flows into but not out of the lake, hence its size and level frequently fluctuates. It is a popular area for windsurfing, sailing and spotting the woolly Mangalica pig.
- To the right, the freshwater Lake Balaton is visible, it is the largest lake in central Europe. It stretches for over 75 km in the southern foothills of Hungary. Its striking emerald-green color is probably due to the presence of algae that grow in the shallow waters.
1) ”Bushfires rage in Australia,” ESA Applications, 13 November 2019, URL: http://www.esa.int/ESA_Multimedia/Images/2019/11/Bushfires_rage_in_Australia
2) ”Is Earth on fire?,” ESA, 25 October 2019, URL: http://www.esa.int/Applications/Observing_the_Earth/Copernicus/Sentinel-3/Is_Earth_on_fire
3) ”Korean Peninsula,” ESA, 18 October 2019, URL: http://www.esa.int/spaceinimages/Images/2019/10/Korean_Peninsula
4) ”Typhoon Hagibis,” ESA, 10 October 2019, URL: http://www.esa.int/spaceinimages/Images/2019/10/Typhoon_Hagibis
5) ”Dorian brings destruction,” ESA 23 September 2019, URL: http://www.esa.int/spaceinimages/Images/2019/09/Dorian_brings_destruction
6) ”Fires ravage the Amazon,” ESA, 27 August 2019, URL: http://www.esa.int/Our_Activities
/Observing_the_Earth/Copernicus/Sentinel-3/Fires_ravage_the_Amazon
7) ”Siberian wildfires,” ESA, 30 July 2019, URL: http://www.esa.int/spaceinimages/Images/2019/07/Siberian_wildfires
8) ”Too hot to handle - Europe is facing another extreme heatwave, with many countries reaching record-breaking temperatures,” ESA, 25 July 2019, URL: http://www.esa.int/spaceinimages/Images/2019/07/Too_hot_to_handle
9) ”The heat is on,” ESA, 27June 2019, URL: http://www.esa.int/spaceinimages/Images/2019/06/The_heat_is_on
10) ”Raikoke spits ash,” ESA, 24 June 2019, URL: http://www.esa.int
/spaceinimages/Images/2019/06/Raikoke_spits_ash
11) ”Snow grain size – it matters,” ESA, 29 May 2019, URL: http://www.esa.int
/Our_Activities/Observing_the_Earth/Copernicus/Sentinel-3/Snow_grain_size_it_matters
12) ”Cyclone Fani,” ESA, 02 May 2019, URL: http://www.esa.int/spaceinimages/Images/2019/05/Cyclone_Fani
13) ”New Zealand,” ESA, Earth observation image of the week, 8 March 2019, URL: http://m.esa.int/spaceinimages/Images/2019/03/New_Zealand
14) ”New satellite keeps close watch on Antarctic ice loss,”Science Daily, 6 March 2019, source of Lancaster University, URL: https://www.sciencedaily.com/releases/2019/03/190306110639.htm
15) Abigail Smith, Alexandra Jahn, ”Definition differences and internal variability affect the simulated Arctic sea ice melt season,” The Cryosphere, 2019; published by EGU (European Geosciences Union), Volume 13, Issue1, 02 January 2019, https://doi.org/10.5194/tc-13-1-2019, URL: https://www.the-cryosphere.net
/13/1/2019/tc-13-1-2019.pdf
16) ”The Alps,” ESA, Earth observation image of the week, 01 March 2019, URL: http://m.esa.int/spaceinimages/Images/2019/03/The_Alps