Copernicus: Sentinel-5P - 2018 to 2017
Sentinel-5P Mission Status for the period 2018-2017
• December 5, 2018: Measurements of atmospheric ozone from the Copernicus Sentinel-5P satellite are now being used in daily forecasts of air quality. 1)
- Launched in October 2017, Copernicus Sentinel-5P (Sentinel-5 Precursor) is the first Copernicus satellite dedicated to monitoring Earth's atmosphere. It is part of the fleet of Copernicus Sentinel missions that ESA develops for the European Union's environmental monitoring program.
- The satellite carries an advanced multispectral imaging spectrometer called TROPOMI. It detects the unique fingerprints of atmospheric gases in different parts of the electromagnetic spectrum to image a wide range of pollutants more accurately and at a higher spatial resolution than ever before.
- And, sooner than expected, the CAMS (Copernicus Atmosphere Monitoring Service), which is implemented by the ECMWF (European Centre for Medium-Range Weather Forecasts) on behalf of the European Union, is now including near-realtime Sentinel-5P ozone data in their daily analysis and forecast system.
- High up in the stratosphere, ozone is important because it protects life on Earth from the Sun's harmful rays of ultraviolet radiation. But lower down in the atmosphere, ozone is an air pollutant – the main ingredient of urban smog. It can cause breathing difficulties and also damage vegetation.
- Before CAMS took the decision to start including the new Copernicus Sentinel-5P ozone data in their forecast system, the data had to be monitored and tested very carefully.
- Since the data first became available in July, CAMS has been using them in research experiments parallel to their operational system. This allowed any teething problems to be solved.
- Deemed good, the data were then included passively into the operational system so that differences between the forecast model and actual observations could be calculated.
- CAMS senior scientist, Antje Inness, explained, "First, a lot of technical work is needed to include new data in the processing chain at ECMWF. "Then the scientific work starts. We monitor the data passively and work with the team at the German Aerospace Center, DLR, to solve any problems. Finally, the assimilation of the data can begin, and the data now influence the CAMS forecasts."
- Head of the service, Vincent-Henri Peuch, added, "Soon after Copernicus Sentinel-5P was launched in late 2017 we started monitoring the total column near-realtime ozone data in research experiments, and since July in our operational system. This has shown that the data are good quality and we are now starting to use them actively in our system."
- ESA's mission manager for Copernicus Sentinel-5P, Claus Zehner, noted, "The uptake of these first data products into CAMS is a really important milestone – we couldn't be happier."
- CAMS is also routinely monitoring the mission's nitrogen dioxide and carbon monoxide data, which also look promising for uptake in the near future.
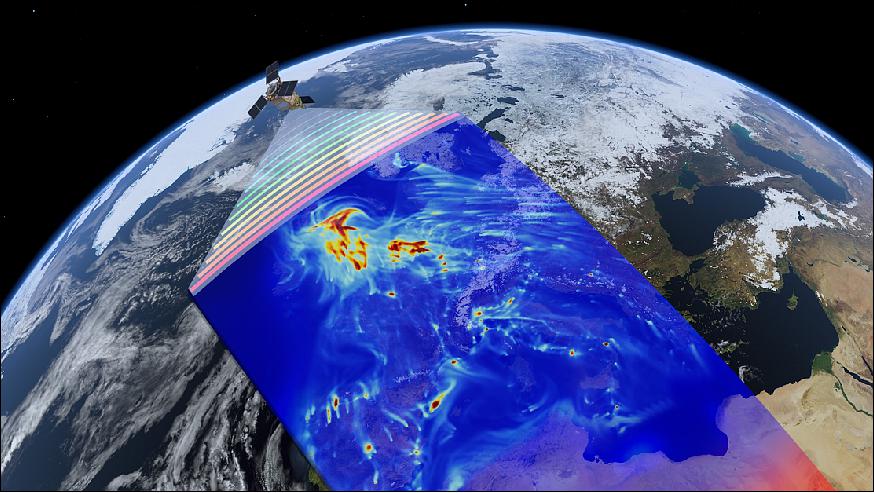
- The Copernicus Sentinel-5P mission not only offers unprecedented accuracy, but also its 2600 km-wide swath allows the entire planet to be mapped every 24 hours.
- All of the mission's measurements of atmospheric gases and aerosols are ‘column data', which means they cover the full depth of the atmosphere.
• November 21, 2018: Camp Fire in northern California, US, has, without doubt, been one of the state's most destructive. This animation uses data from different Copernicus Sentinels to show the spread of aerosols and smoke. 2)
- Over the last two weeks Camp Fire (shown here) and the Woolsey Fire in the south have burned thousands of hectares of land and reduced thousands of homes to ashes, and sadly claimed many lives. And with over 800 residents of Paradise and surroundings still missing, the death toll is likely to rise.

- This animation uses data acquired between 8 and 11 November 2018 by the Copernicus Sentinel-5P mission to show how aerosols from Camp Fire spread in the atmosphere. The mission is dedicated to mapping a multitude of trace gases and aerosols that affect air quality. The animation also includes measurements from 11 November made by two instruments carried on the Copernicus Sentinel-3 satellites. One is from the ocean land color instrument, which clearly shows smoke billowing from the fire, and the other is from the optical channels of its sea and land surface temperature radiometer, which shows the flames.
- Having information acquired at the same time from different satellites and instruments helps monitor devastating events such as this.
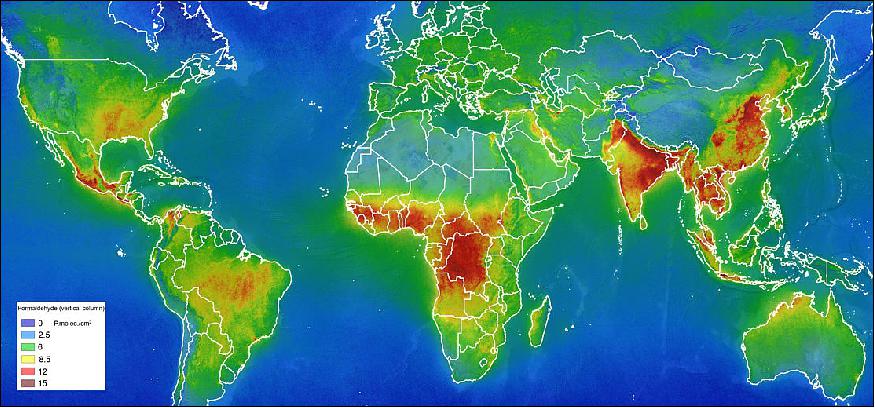
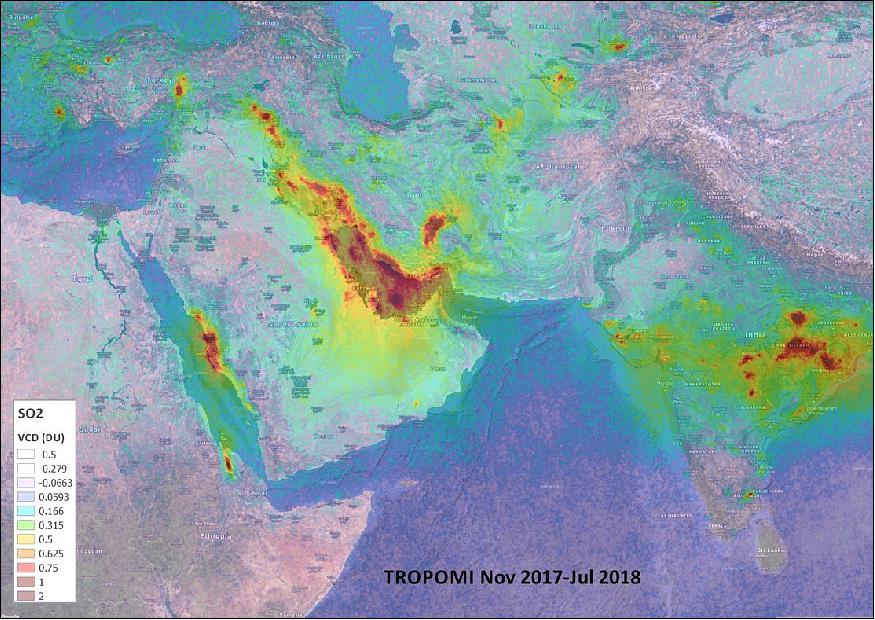
• October 24, 2018: With air quality a serious environmental health problem, the Copernicus Sentinel-5P satellite is tasked with mapping air pollutants around the entire globe every day. This new mission has been providing data on carbon monoxide, nitrogen dioxide and ozone since July and now other polluting nasties such as sulphur dioxide and formaldehyde have joined the list of data products available to monitor the air we breathe. 3)
- Air pollution affects people in developed and developing countries alike. In Europe alone, it is estimated that every year 400 000 people die prematurely because of poor air quality.
- Satellite data and computer models are the only real way of showing how pollution accumulates around the world as a whole. In the immediate term, these tools are essential for forecasts and warnings on air quality. In the longer term they are indispensable for providing accurate information for decision-makers developing strategies to tackle this major problem.
- Launched in October 2017, Copernicus Sentinel-5P – short for Sentinel-5 Precursor – is the first Copernicus satellite dedicated to monitoring our atmosphere. It is part of the fleet of Copernicus Sentinel missions that ESA develops for the European Union's environmental monitoring program.
- The satellite carries an advanced multispectral imaging spectrometer called TROPOMI. What sets TROPOMI apart is that it detects the unique fingerprints of atmospheric gases in different parts of the electromagnetic spectrum to image a wide range of pollutants more accurately and at a higher spatial resolution than ever before.
- Since this state-of-the art satellite mission was launched, scientists have been carefully evaluating its data and, in turn, releasing the data to users.
- Streams of data on carbon monoxide, nitrogen dioxide, ozone, along with information on aerosols and clouds have been available since July. On 17 October, sulphur dioxide and formaldehyde joined the list of air pollutants routinely available for services such as air-quality forecasting and volcanic ash monitoring. - The Copernicus Atmospheric Monitoring Service is a key user of these data products.
- Head of the service, Vincent-Henri Peuch, said, "Even looking at social media, we see that Copernicus Sentinel-5P is proving to be a great ambassador for environmental monitoring and for taking action on air pollution. But the mission does much more than give us images.
- "This is a sophisticated mission designed to measure the comprehensive set of atmospheric constituents for underpinning several of the CAMS information products. We are already using observations of ozone and nitrogen dioxide, which have been available routinely since July.
- "We are really excited about using these new sulphur dioxide and formaldehyde data in our operational services. Copernicus Sentinel-5P data is also about to make its way into everyone's pockets as our products are being taken up by leading smartphone applications to inform the public on current air quality."
- Sulphur dioxide affects air quality badly and can lead to breathing problems. While it is released into the atmosphere mainly through industrial processes, it is also present in volcanic plumes. — Monitoring the spread of volcanic plumes is critical for aircraft safety.
- Nicolas Theys from the Royal Belgian Institute for Space Aeronomy said, "Copernicus Sentinel-5P's near-realtime data on sulphur dioxide and aerosols are being used in the Support to Aviation Control Service and in the European Natural Disaster Coordination Information System for Aviation. -The unprecedented level of details offered by the mission allows Volcanic Ash Advisory Center users to better track and forecast the dispersion of volcanic plumes."
- The latest data release also includes formaldehyde, which tends to enter the atmosphere from forest fires and wood processing, for example. It is an important intermediate gas in the oxidation of methane and other hydrocarbons. While it is short-lived in the atmosphere, it reacts chemically to become a major source of carbon monoxide – another harmful pollutant.
- Improved total ozone columns are now also available to enable long-term ozone monitoring from space.
- Each of the Copernicus Sentinel missions carries state-of-the-art technology to deliver a stream of complementary imagery to help manage the environment effectively and respond to global change. The European Commission leads the Copernicus program. ESA is responsible for the space component, which includes the family of Copernicus Sentinel satellite missions. Data are used worldwide and are free of charge.
- Josef Aschbacher, Director of ESA's Earth Observation Programs, underlined, "The Copernicus Sentinel-5P mission is a prime example of how Europe works together for the benefit of its citizens. The European Commission as leader of the Copernicus program, ESA as the coordinator, developer and operator of the space component are, together with the respective Member States, the prime drivers of Copernicus. In the case of Sentinel-5P, the TROPOMI instrument provided by The Netherlands highlights the tight cooperation across Europe. Copernicus is indeed a success story for Europe in space."
• September 14, 2018: For more than 20 years, changes in ozone over Antarctica have been carefully monitored by a succession of European satellites. This important long-term record is now being added to by the Copernicus Sentinel-5P mission, which is dedicated to atmospheric monitoring. 4)
- Protecting life on Earth from the Sun's harmful rays of ultraviolet radiation, the ozone layer is a very important, yet fragile, part of Earth's atmosphere.
- Launched in October 2017, Sentinel-5P is the first Copernicus mission dedicated to monitoring our atmosphere. The satellite carries the state-of-the-art Tropomi instrument to map a multitude of trace gases that affect the air we breathe and our climate. As well as measuring ozone, this new mission also measures gases such as nitrogen dioxide, formaldehyde, sulphur dioxide, methane, carbon monoxide, and aerosols.
- The International Day for the Preservation of the Ozone Layer is marked every year on 16 September.
- While the ozone layer may be healthier than it was, it is critical that it continues to be carefully monitored – not just to look back at its history, but also to see how it changes in the future.
- ESA has been involved in monitoring ozone for many years. Satellites such as ERS-2 and Envisat carried instruments that measured ozone.
- These data, along with measurements from EUMETSAT's MetOp and NASA's EOS–AURA missions, span more than two decades and are used by ESA's Climate Change Initiative to create long-term records.
- Now, the Copernicus Sentinel-5P satellite is adding to this vital record. As well as measuring ozone, this new mission also measures gases such as nitrogen dioxide, formaldehyde, sulphur dioxide, methane, carbon monoxide, and aerosols.
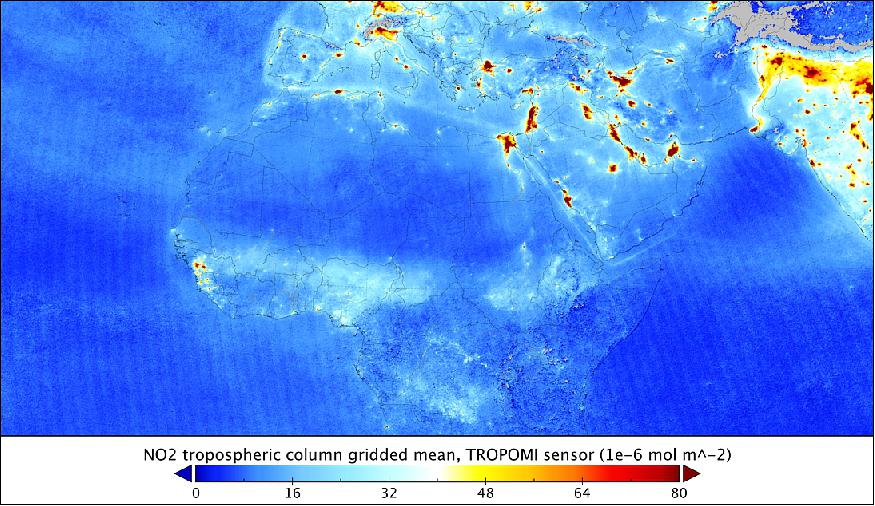
• July 11, 2018: Following months of tests and careful evaluation, the first data on air pollutants from the Copernicus Sentinel-5P satellite have been released. These first maps show a range of trace gases that affect air quality such as carbon monoxide, nitrogen dioxide and ozone. 5)

- Launched on 13 October 2017, Sentinel-5P is the first Copernicus satellite dedicated to monitoring our atmosphere. It is part of the fleet of Sentinel missions that ESA develops for the European Union's environmental monitoring Copernicus program managed by the European Commission.
- Philippe Brunet, Director of Space Policy, Copernicus and Defence at the European Commission, welcomed the release and accuracy of the new data, which has shone a light on air pollution on a global scale. "These first data are another milestone for our Copernicus program. They show how Sentinel-5P is set to make a real difference in monitoring air quality and highlight European Union's contribution to combatting the global issue of air pollution."
- As poor air quality continues to prematurely claim the lives of millions of people every year, it is more important than ever that we find better and more accurate ways of monitoring the air we breathe.
- Thanks to its Tropomi instrument – the most advanced multispectral imaging spectrometer to date – Sentinel-5P can zoom down to the surface of Earth and deliver highly detailed and accurate data about the atmosphere. - With a resolution of up to 7 x 3.5 km, it can even detect air pollution over individual cities.
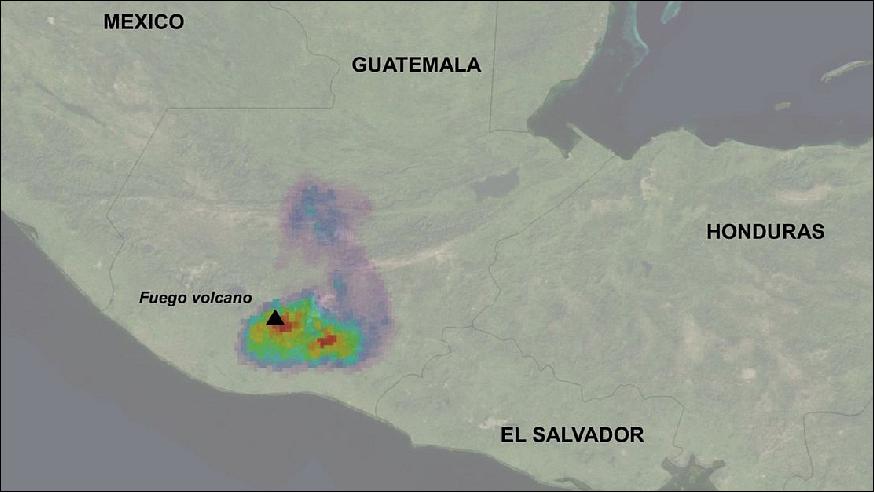
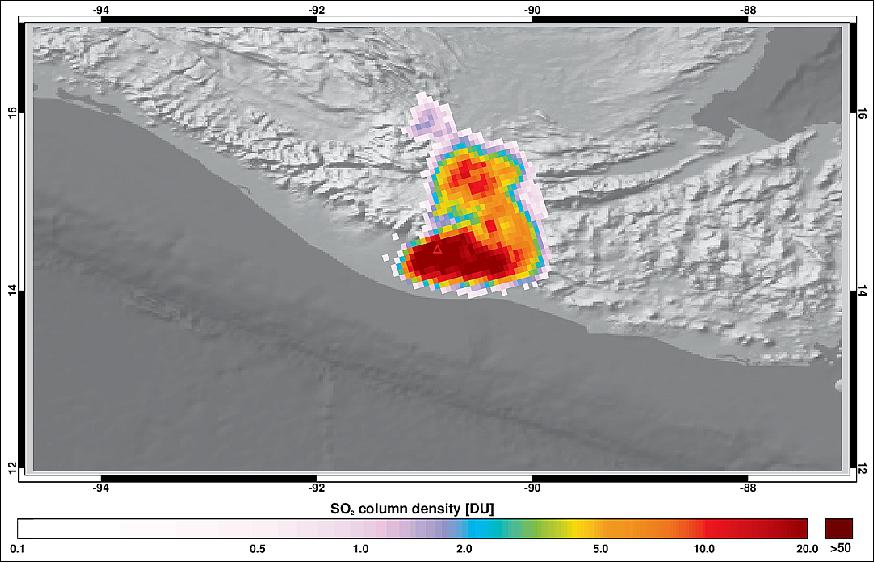
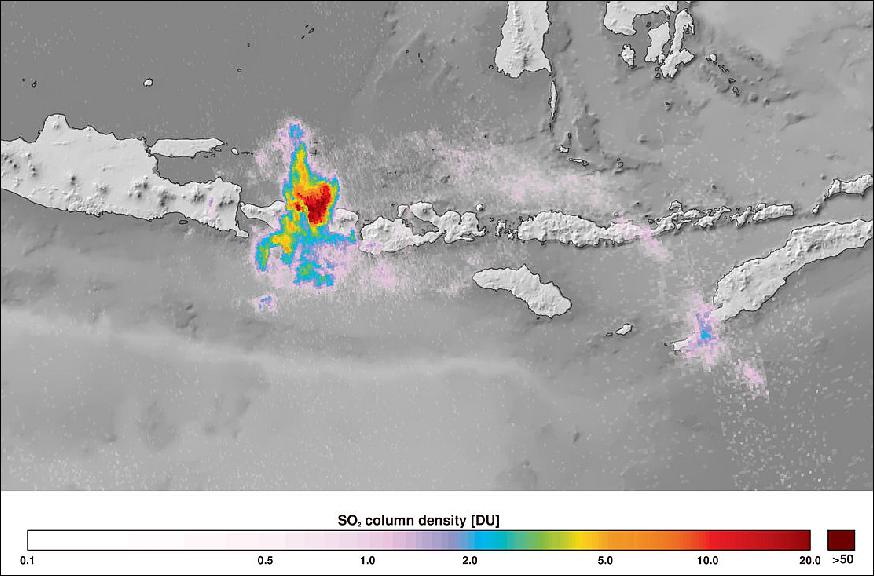
• On 3 June 2018, the Copernicus Sentinel-5P satellite measured sulphur dioxide in the plume spewing from the Fuego volcano in Guatemala. The eruption has already claimed 25 lives and injured several hundred. It is reported to be Guatemala's deadliest such event since 1902 when the Santa Maria volcano erupted and killed thousands of people. The Fuego volcano, which is less than 40 km southwest of the capital Guatemala City, also erupted in February this year and sent ash almost 2 km high. Yesterday's event was much bigger with ash reaching 6 km high and hot rock and gas engulfing nearby villages. 6)
- Launched in October 2017, the Copernicus Sentinel-5P data products are still being validated before their release to the public. However, this image (Figure 12) clearly shows high amount of sulphur dioxide being ejected into the atmosphere. The satellite carries the state-of-the-art Tropomi instrument to map a multitude of trace gases such as nitrogen dioxide, ozone, formaldehyde, sulphur dioxide, methane, carbon monoxide and aerosols – all of which affect the air we breathe and therefore our health, and our climate.
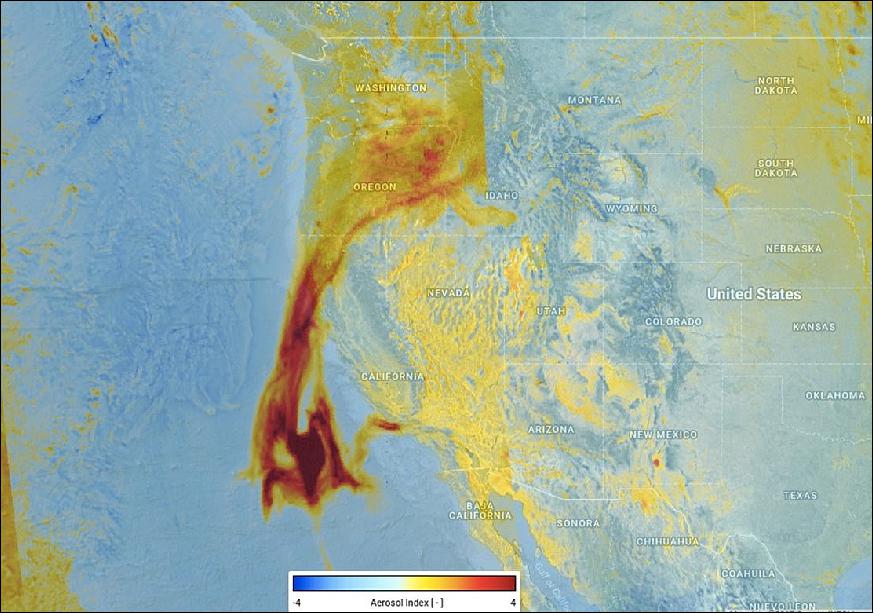
• December 15, 2017: The new Copernicus Sentinel-5P satellite captured the presence of elevated absorbing aerosols – caused by fires – in the atmosphere off the west coast of the US on 12 December 2017. 7)
- While hundreds of firefighters battle the fires, more than 200,000 people have been forced to flee their homes. According to the California Department of Forestry and Fire Protection, the 2017 California wildfire season is the worst on record.
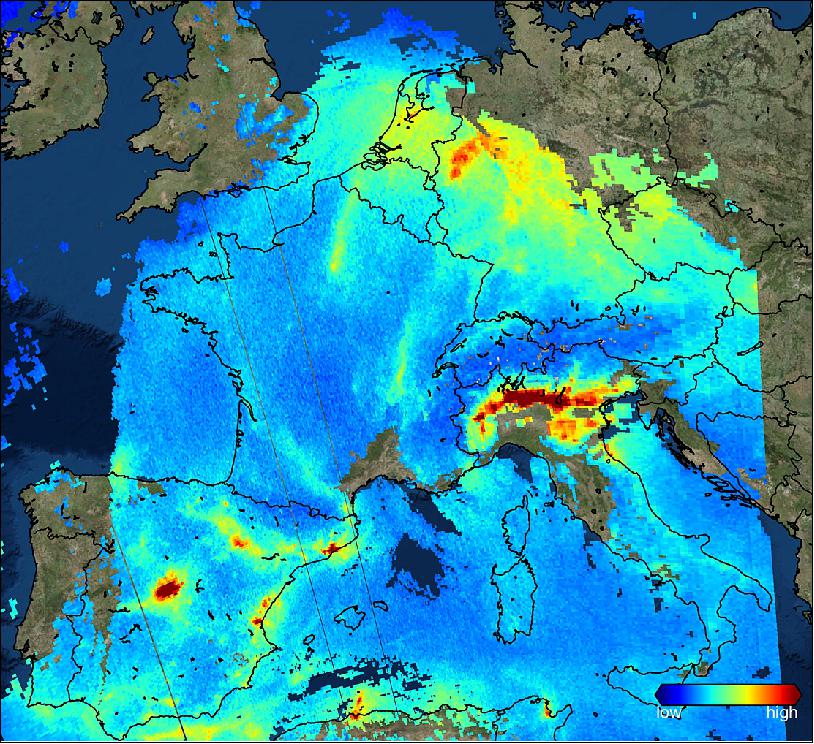
• December 1, 2017: Launched on 13 October, the Sentinel-5P satellite has delivered its first images of air pollution. Even though the satellite is still being prepared for service, these first results have been hailed as exceptional and show how this latest Copernicus satellite is set to take the task of monitoring air quality into a new era. 8) 9) 10)
- This new mission promises to image air pollutants in more detail than ever before. And, while these first results demonstrate the sophistication of the satellite's instrument, they certainly bring the issue of air pollution sharply into focus.
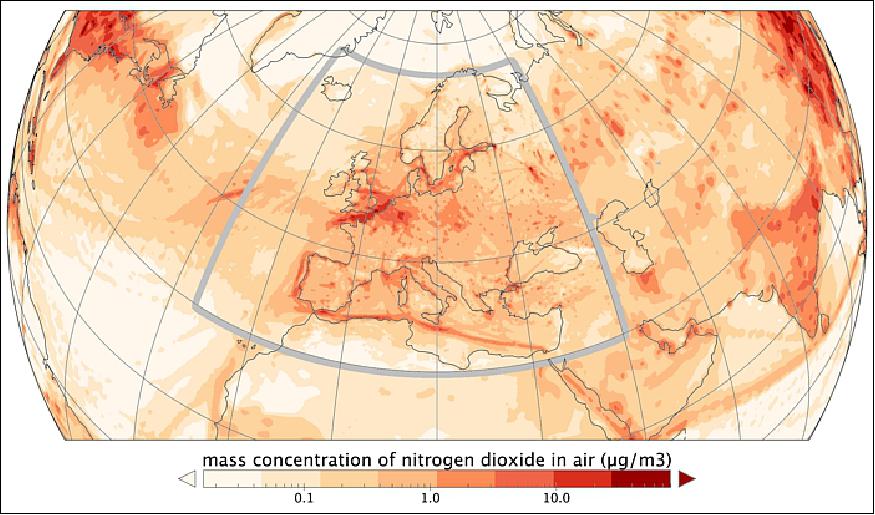
- One of these first images shows nitrogen dioxide over Europe. Caused largely by traffic and the combustion of fossil fuel in industrial processes, the high concentrations of this air pollutant can be seen over parts of the Netherlands, the Ruhr area in western Germany, the Po Valley in Italy and over parts of Spain (Figure 14).
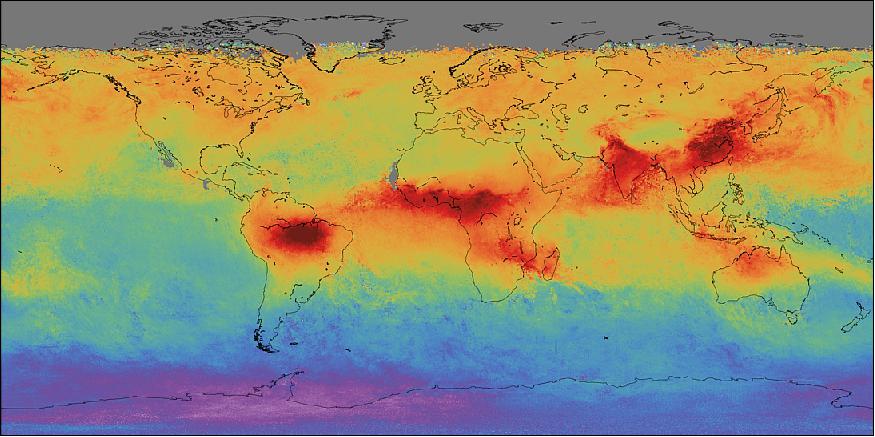
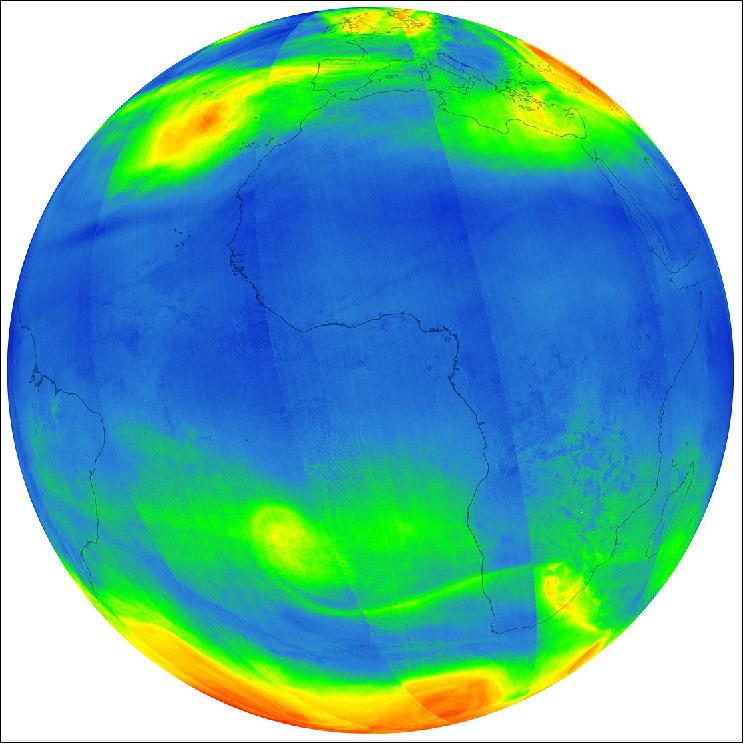
- Some of the first data have been used to create a global map of carbon monoxide. The animation shows high levels of this air pollutant over parts of Asia, Africa and South America. Sentinel-5P also reveals high levels of pollution from power plants in India.
- Josef Aschbacher, ESA's Director of Earth Observation Programs, said, "Sentinel-5P is the sixth satellite for the EC Copernicus environmental monitoring program but the first dedicated to monitoring our atmosphere. These first images offer a tantalizing glimpse of what's in store and are not only an important milestone for the Sentinel-5P mission, but also an important milestone for Europe. Data such as we see here will soon underpin the Copernicus Atmosphere Monitoring Service, and will be used to issue forecasts, and will ultimately be valuable for helping to put appropriate mitigation policies in place."
- Sentinel-5P carries the most advanced sensor of its type to date: Tropomi. This state-of-the-art instrument can map pollutants such as nitrogen dioxide, methane, carbon monoxide and aerosols, all of which affect the air we breathe and our climate. After the satellite was launched, Tropomi went through a planned decontamination process. The door that kept it sealed during this time was opened recently, allowing light to enter and the first images to be taken.
- These first results were revealed at the DLR German Aerospace Center in Oberpfaffenhofen, where Sentinel-5P's data are processed.
- Stefan Dech, Director of DLR's Earth Observation Center, said, "These first images are astonishing, especially given the satellite is still in the early stages of being commissioned for operations. The Tropomi instrument promised to offer images of pollutants in higher resolution than ever before, and it's certainly living up to its promise."
• November 30, 2017: The first images from Sentinel-5P will be revealed on 1 December 2017. Although it will be a few months before the satellite is ready for service, these first results are expected to show just how this new Copernicus mission is set to be a game changer for monitoring air quality. 13)
- With air pollution putting the health of millions of people at risk, it is important to understand exactly what is in the air so that accurate forecasts can be issued, and, ultimately, appropriate mitigation policies be put in place.
- While the notion of an inventory might sound a tad boring, air pollution emission inventories are fundamental to implementing new environmental directives. But as important as these inventories are, they do not currently include satellite data.
- The problem is that today's satellites do not provide measurements in high enough spatial resolution to be useful for emission inventories – but the Copernicus Sentinel-5P mission is about to change this.
- Launched on 13 October, the Sentinel-5P satellite carries the most advanced multispectral imaging spectrometer to date: TROPOMI. What sets TROPOMI apart from other satellite sensors is that it measures trace gases in much higher spatial resolution, than, say, the OMI (Ozone Monitoring Instrument) on NASA's Aura satellite – which Europe relies on mostly for information on air pollutants.
- Ronald van der A from KNMI (Royal Netherlands Meteorological Institute) said, "Our estimates of pollutants are often limited by the current resolution of satellite measurements. - We are looking forward to using Sentinel-5P's TROPOMI because it will make it much easier to distinguish between different sources of pollutants."
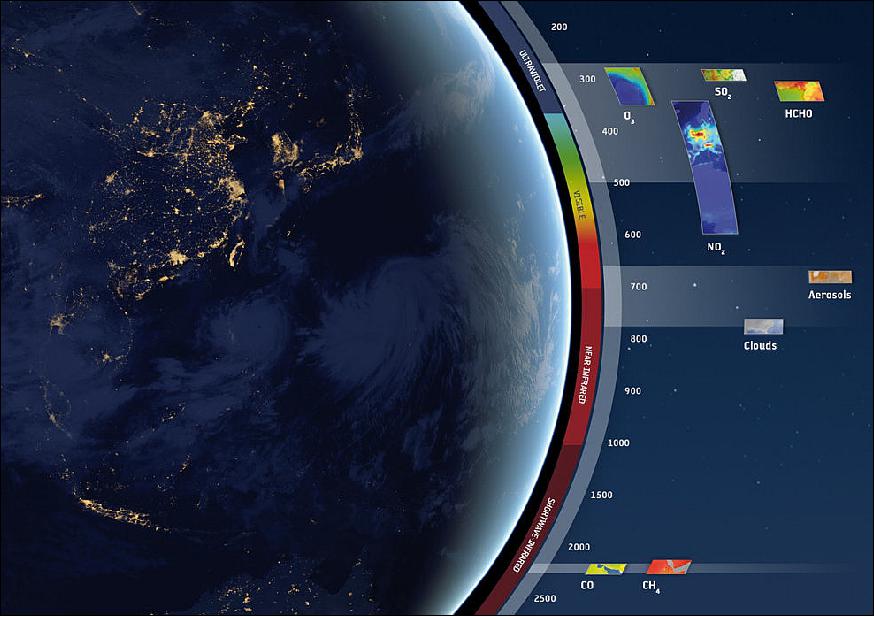
- Measuring from the ultraviolet to the shortwave infrared, TROPOMI can detect the unique fingerprints of numerous polluting gases such as nitrogen dioxide, ozone, formaldehyde, sulphur dioxide, methane and carbon monoxide. And, being able to image with a resolution as high as 7 x 3.5 km, the mission can measure pollution emitted by individual cities or parts of a city.
- This is key because the information currently used in emission inventories is currently compiled largely from statistical information on industrial sites, population density and traffic, for example. - These inventories tend to be updated only every few years and they are subject to national reporting, which can vary from country to country.
- Even given the present constraints, organizations such as the European Environment Agency work hard to generate comprehensive inventories but it is anticipated that Sentinel-5P will be a huge boost for these inventories.
- Claus Zehner, ESA's Sentinel-5P mission manager, said, "We really are at a very important juncture for air-quality monitoring. This astonishing new satellite mission will measure air pollutants like never before from space. In the near future, measurements from this novel mission can be certainly used to complement and improve classic air-quality emission inventory calculations."
• October 31, 2017: Now that Sentinel-5P is safely in orbit, engineers have started commissioning the satellite for the task of delivering extremely high-quality information on air quality. Meanwhile, the Copernicus Atmosphere Monitoring Service is poised to ensure we all reap the benefits from this latest mission. 16)
- Launched from Russia on 13 October 2017, this Copernicus satellite is in excellent health and is being maneuvered gently into its operational orbit.
- As planned, the satellite's Tropomi instrument is in the process of being decontaminated. This will take another couple of weeks and then it will be carefully fine-tuned for service.
- Sentinel-5P was designed to provide a primary source of data for CAMS (Copernicus Atmosphere Monitoring Service), which is at the ECMWF (European Center for Medium-Range Weather Forecasts) in the UK, and it is their job to ensure that the mission ultimately benefits Europe's citizens.
- Philippe Brunet, EC Director of Space Policy, Copernicus and Defence, said, "The EC is strongly committed to monitoring global air quality. Sentinel-5P will provide loads of information about the air we breathe, which means that Europe will be better equipped to address the challenges affecting citizens in their daily lives. "And, as with all data provided by the Copernicus Program, data from Sentinel-5P are free and open to anyone in the world, so the benefits are expected to extend way beyond Europe Union's borders."
- With new software written that allows Sentinel-5P's stream of data to fit into their current forecasting system, CAMS is ready to test and compare these new observations with forecast models. This is essential to make sure that the new data are not biased or flawed. Importantly, their findings will also contribute to the overall effort to validate the mission.
- Assuming this all goes well, Sentinel-5P, which offers data with better accuracy and at higher resolution than ever before, will underpin the ‘products' CAMS produces when the mission goes into service.
- Since Sentinel-5P delivers information on aerosols and harmful gases such as nitrogen dioxide, sulphur dioxide and carbon monoxide, CAMS' products include those that feed into daily European air-quality forecasts.
- There are also a number of downstream users that range from national environmental agencies to small- and medium-sized enterprises that develop innovative applications related to air quality and renewable energy.
- CAMS also contributes to explaining particular events such as the recent dust plume of Saharan dust and ashes from fires in Portugal and Spain that was carried to France and UK by Storm Ophelia, which led to yellow skies.
- Deputy Head of CAMS, Richard Engelen, said, "The observations we will get from Sentinel-5P are pivotal for CAMS operations at ECMWF. The mission will provide vast amounts of high-quality data for our global forecasts of atmospheric composition. "Sentinel-5P ensures we will have observations for years to come and that users get a continuous and reliable service."
- Vincent-Henri Peuch, Head of CAMS, added "While anyone can access the data, they are complex and have to be processed – CAMS does the job for you! It's similar to weather forecasts; you don't need to be a meteorologist to benefit from complex numerical models. "Through the CAMS service chain, high-quality information about air quality, pollen allergies, UV or solar renewable energy is made available through websites, smartphone apps and other communication channels so that everyone can reap the benefits of this wonderful new satellite mission."
- Josef Aschbacher, ESA's Director of Earth Observation Programs, noted, "With six Sentinel satellites in orbit observing our environment, the Copernicus program is living up to its ‘Europe's eyes on Earth' claim. "We have been getting exceptional data about our land, oceans and ice from the Sentinel-1, Sentinel-2 and Sentinel-3 missions. And soon, Sentinel-5P, once in operation, will shed new light on the atmosphere giving us detailed information about something that affects us all – the quality of the air we breathe."
• October 16, 2017: Launched last week, Europe's Sentinel-5P satellite – the first Copernicus mission dedicated to monitoring the air we breathe – is in excellent health. 18)
- Contact meant that engineers at ESA's mission control in Darmstadt, Germany, could assume control of the satellite, and begin working around the clock to check its condition and start setting it up it for routine flight.
- The satellite is on solar power, its navigation and communication systems are operating as expected and it is fully functional after its raucous ride into space.
• October 13, 2017: After separating from the upper stage, Sentinel-5P deployed its three solar panels and began communications with Earth. The first signal was received 93 min after launch as the satellite passed over the Kiruna station in Sweden (Ref. NO TAG#.
- Telemetry links, command and control were then established by controllers at ESA's operations center in Darmstadt, Germany, allowing them to monitor the health of the satellite.
- The launch and the early orbit phase will last three days, during which controllers will check the satellite's key systems and configure it for flight in space.
- Following this, a commissioning phase will check all elements of the satellite's systems and the main instrument will be decontaminated. Once completed after a few weeks, the cooler door will be opened and the calibration and validation of Sentinel-5P's main TROPOMI instrument will be performed.
- The mission is expected to begin full operations six months from now.
1) "Copernicus Sentinel-5P ozone boosts daily forecasts,"
2) "Paradise lost," ESA, 21 November 2018, URL: http://m.esa.int/spaceinimages/Images/2018/11/Paradise_lost
3) "Copernicus Sentinel-5P reveals new nasties," ESA, 24 October, 2018, URL: http://m.esa.int/Our_Activities/Observing_the_Earth/Copernicus/Sentinel
-5P/Copernicus_Sentinel-5P_reveals_new_nasties
4) "New kid on the block picks up relay for ozone," ESA, 14 September 2018, URL: http://m.esa.int/Our_Activities/Observing_the_Earth/
Copernicus/Sentinel-5P/New_kid_on_the_block_picks_up_relay_for_ozone
5) "Copernicus Sentinel-5P releases first data," ESA, 11 July 2018, URL: http://m.esa.int/Our_Activities/Observing_the_Earth/Copernicus/
Sentinel-5P/Copernicus_Sentinel-5P_releases_first_data
6) "Fuego Plume," ESA, 05 June 2018, URL: http://m.esa.int/spaceinimages/Images/2018/06/Fuego_plume
7) "Tracking aerosols from California's fires," ESA, 15 Dec. 2017, URL: http://m.esa.int/spaceinimages/Images/2017/
12/Tracking_aerosols_from_California_s_fires
8) "Sentinel-5P brings air pollution into focus," ESA, 1 Dec. 2017, URL: http://m.esa.int/Our_Activities/Observing_the_Earth/
Copernicus/Sentinel-5P/Sentinel-5P_brings_air_pollution_into_focus
9) "Watch live: Sentinel-5P First Light event," ESA, 1 Dec. 2017, URL: http://m.esa.int/Our_Activities/Observing_the_Earth/Copernicus
/Sentinel-5P/Watch_live_Sentinel-5P_First_Light_event
10) "Sentinel-5P - a quantum leap in atmospheric observation," DLR News, 01 Dec. 2017, URL: http://www.dlr.de/dlr/en/desktopdefault.aspx/tabid
-10081/151_read-25294/year-all/#/gallery/29251
11) "Global carbon monoxide measured by Sentinel-5P," ESA, 1 Dec. 2017, URL: http://m.esa.int/spaceinimages/Images/2017/12/Global
_carbon_monoxide_measured_by_Sentinel-5P
12) "Ozone from Sentinel-5P," ESA, 01 December 2017, URL: http://m.esa.int/spaceinimages/Images/2017/12/Ozone_from_Sentinel-5P
13) "Taking air-quality inventories to new heights," ESA, 30 November 2017, URL: http://m.esa.int/Our_Activities/Observing_the_
Earth/Copernicus/Sentinel-5P/Taking_air-quality_inventories_to_new_heights
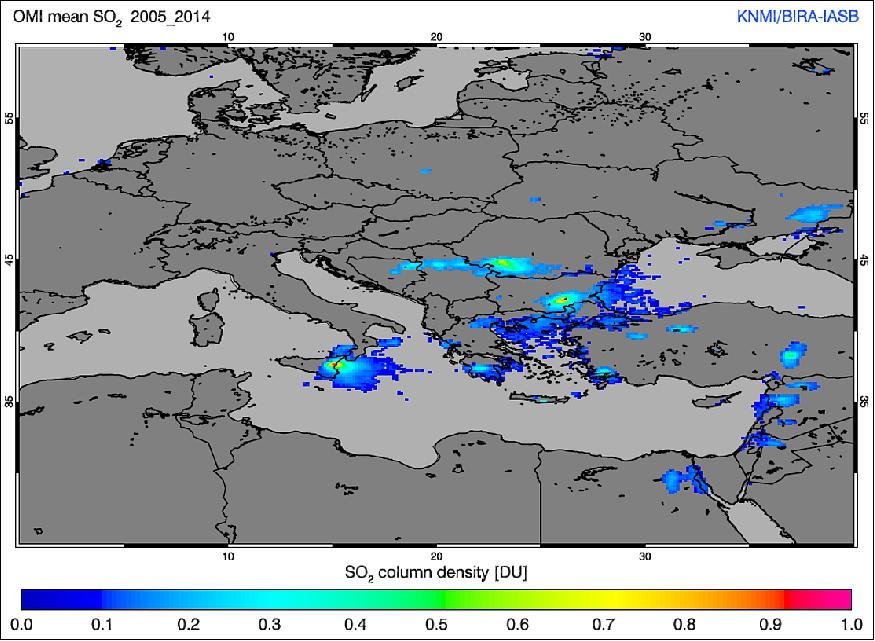
14) "Sulphur dioxide over Europe from OMI," ESA, 30 Nov. 2017, URL: http://m.esa.int/spaceinimages/Images/2017/11/Sulphur_dioxide_over_Europe_from_OMI
15) "Tropomi's spectral range," ESA, 20 July 2017, URL: http://m.esa.int/spaceinimages/Images/2017/07/Tropomi_s_spectral_range
16) "Ready to reap the benefits from Copernicus Sentinel-5P," ESA, 31 Oct. 2017, URL: http://www.esa.int/Our_Activities/Observing_the_Earth/Copernicus/Sentinel-5P/
Ready_to_reap_the_benefits_from_Copernicus_Sentinel-5P
17) "Nitrogen dioxide forecast," ESA, 31 Oct. 2017, URL: http://www.esa.int/spaceinimages/Images/2017/10/Nitrogen_dioxide_forecast
18) "Sentinel-5P: satellite in excellent health," ESA, 16 Oct. 2017, URL: http://m.esa.int/Our_Activities/Operations/Sentinel-5P_satellite_in_excellent_health
19) "Bringing air pollution into focus," ESA, July 19, 2017, URL: http://m.esa.int/spaceinimages/Images/2017/07/Bringing_air_pollution_into_focus
The information compiled and edited in this article was provided by Herbert J. Kramer from his documentation of: "Observation of the Earth and Its Environment: Survey of Missions and Sensors" (Springer Verlag) as well as many other sources after the publication of the 4th edition in 2002. - Comments and corrections to this article are always welcome for further updates (herb.kramer@gmx.net).