Copernicus: Sentinel-5P 2019
Sentinel-5P Status and Imagery for the period 2019
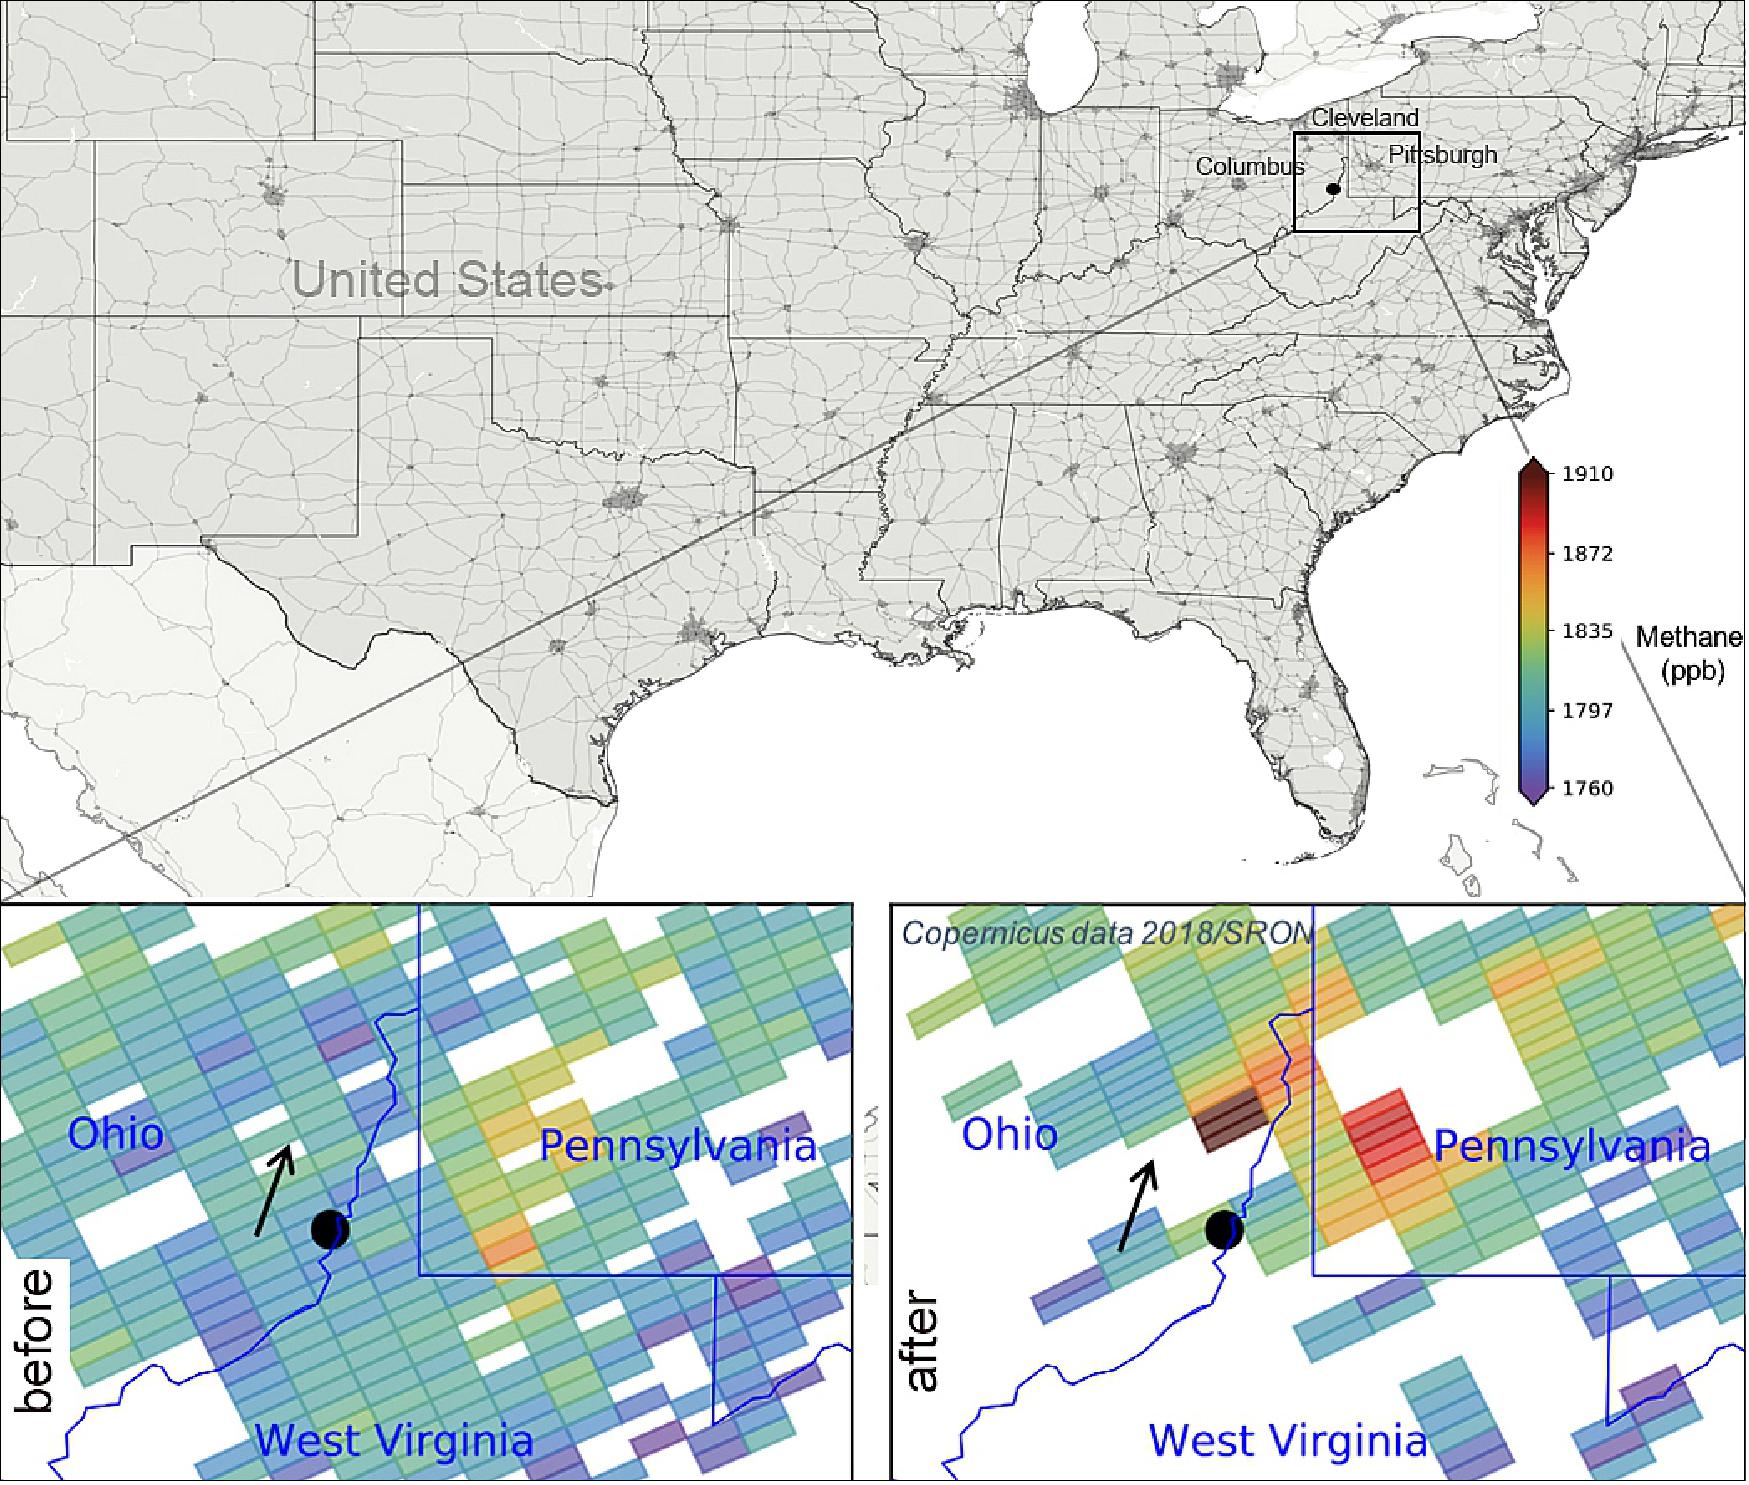
• December 17, 2019: Data from the Copernicus Sentinel-5P satellite revealed that an explosion in a natural gas well in Ohio in February 2018 released more than 50,000 tons of methane into the atmosphere. The blowout leaked more of this potent greenhouse gas in 20 days than the majority of many European nations do in a year from their oil and gas industries. 1)
- The findings were published in a study published on 16 December 2019 in the Proceedings of the National Academy of Sciences (PNAS), and the study reveals the importance of using satellite data to detect and quantify pollutants such as methane. Data from the Copernicus Sentinel-5P’s TROPOMI instrument revealed that 120 tons of methane were emitted per hour due to the blowout. 2)
- Claus Zehner, ESA’s Copernicus Sentinel-5P mission manager, comments, “These Sentinel-5P measurements show that satellites can measure the concentrations of greenhouse gases emitted by a point source. The satellite’s capabilities will be further exploited with the upcoming Copernicus Carbon Dioxide Monitoring mission.”
- While carbon dioxide is more abundant in the atmosphere and therefore more commonly associated with global warming, methane is about 30 times more potent as a heat-trapping gas. It usually enters the atmosphere mainly from the fossil fuel industry, landfill sites, livestock farming, rice agriculture and wetlands – but can also be released during oil and gas extraction.
- Sentinel-5P, with its state-of-the-art instrument TROPOMI, can also map other pollutants such as nitrogen dioxide, carbon monoxide, sulphur dioxide and aerosols – all of which affect the air we breathe and our climate.
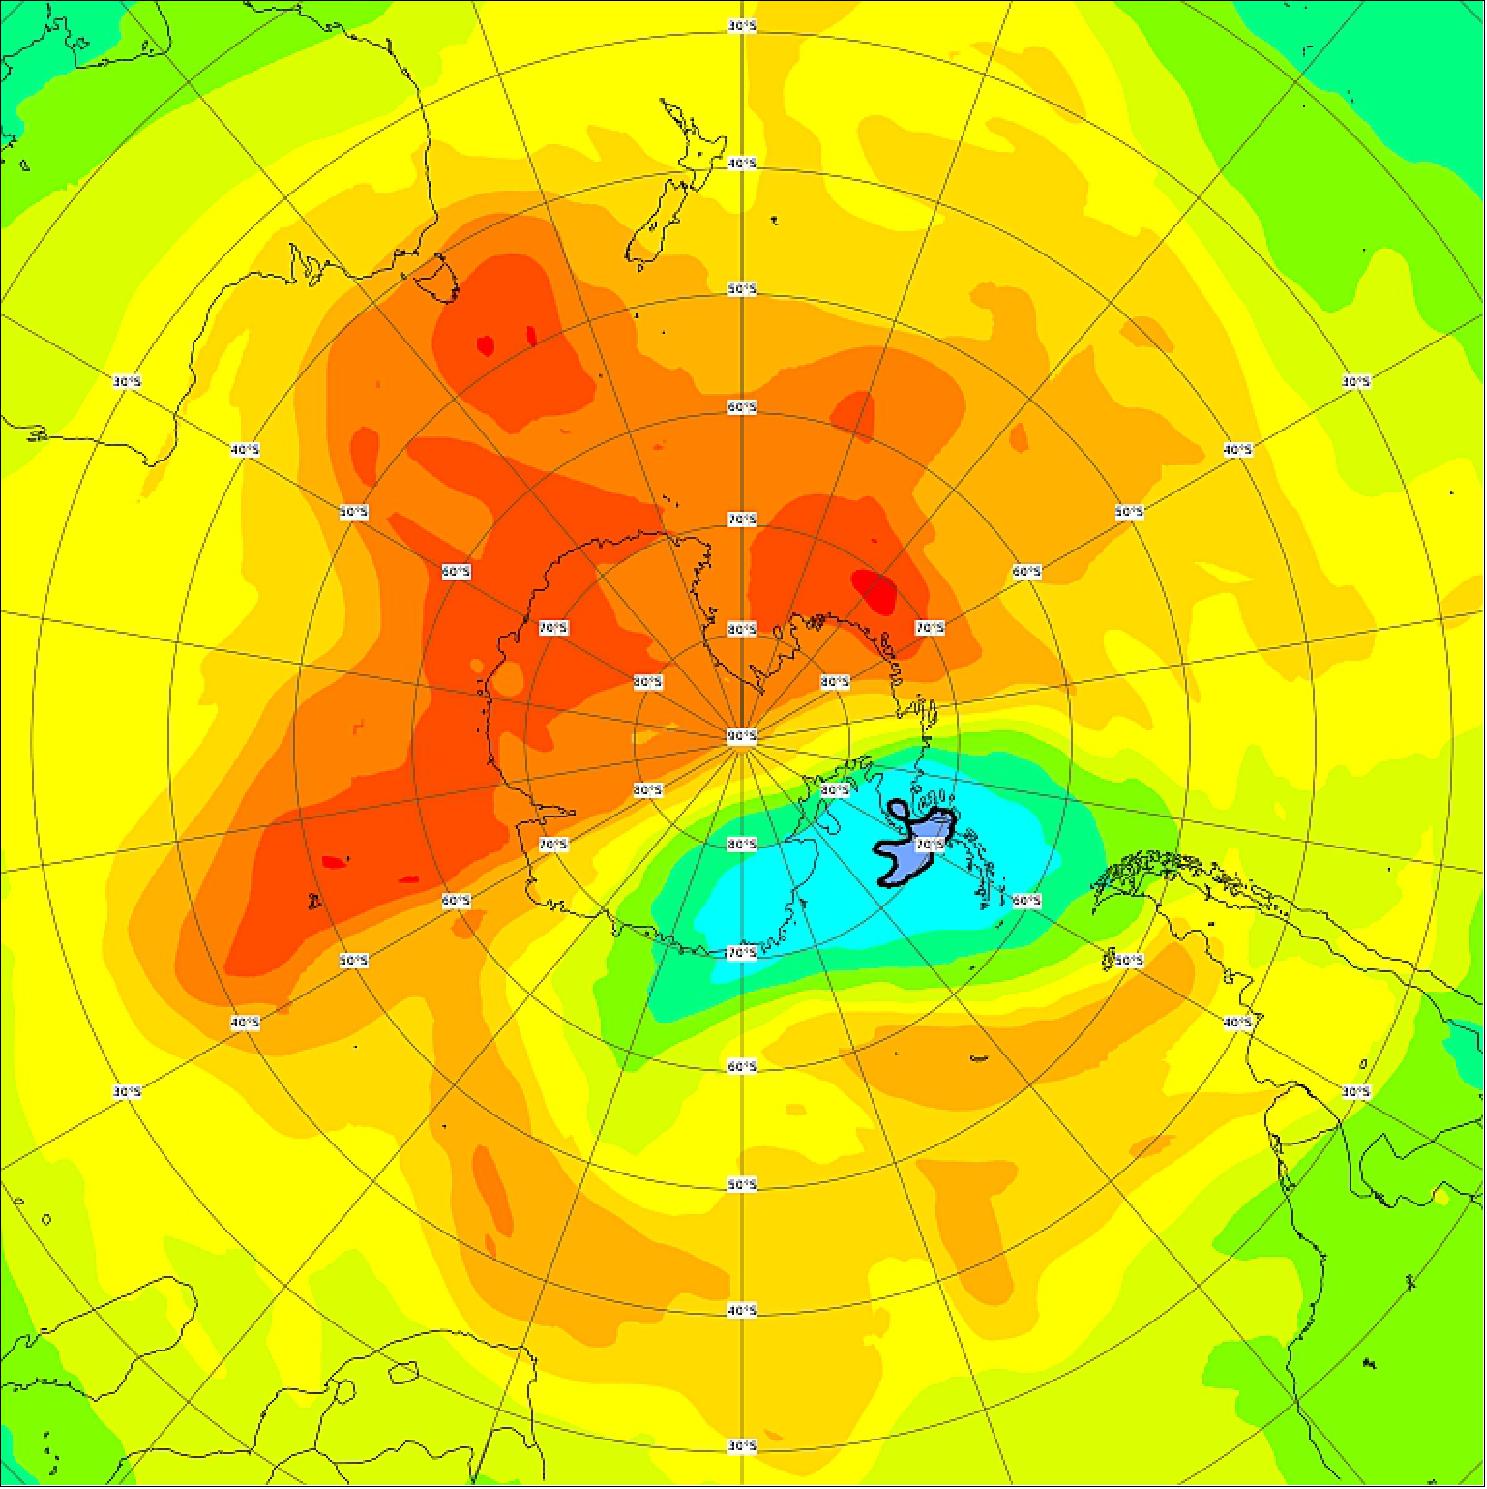
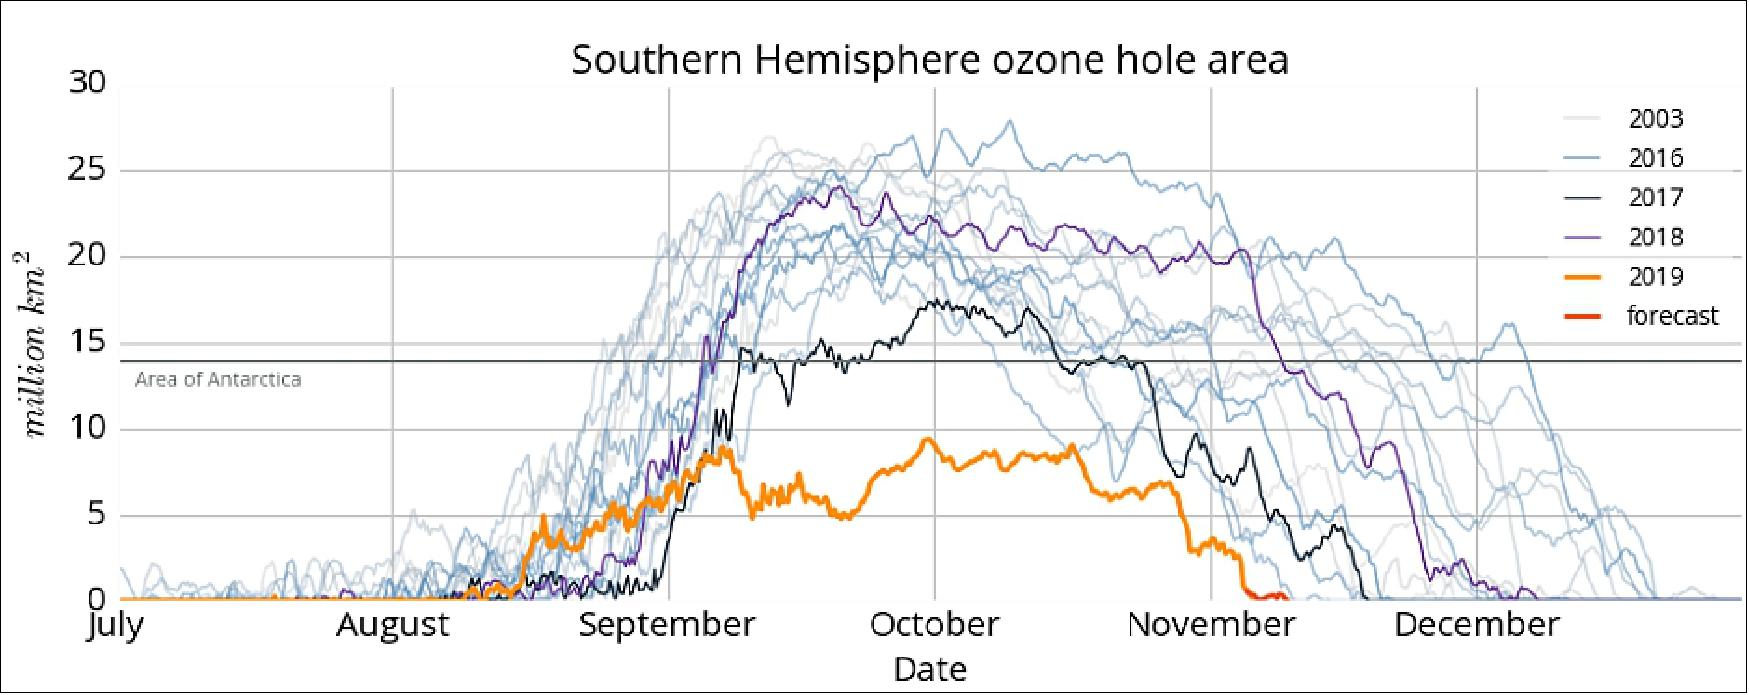
• November 8, 2019: The size of the ozone hole fluctuates – usually forming each year in August, with its peak in October, before finally closing in late November or December. Not only will the hole close earlier than usual in 2019, but it is also the smallest it has been in 30 years owing to unusual atmospheric conditions. 3)
- Forecasts from the Copernicus Atmosphere Monitoring Service (CAMS), which uses total ozone measurements from the Copernicus Sentinel-5P mission processed at the German Aerospace Center, have forecasted that this year’s ozone hole will close sooner than usual.
- Antje Inness, CAMS Senior Scientist commented, “The ozone hole’s maximum extent this year was around 10 million km2, less than half of the size the ozone hole usually reached in the last decades. This makes it one of the smallest ozone holes since the 1980s. Our CAMS ozone forecasts predict that the ozone hole will close within a week.”
- ESA’s mission manager for Copernicus Sentinel-5P, Claus Zehner, noted, “This record-breaking small ozone hole size and duration during 2019 was caused by a warming of the stratosphere over the South Pole. However, it’s important to note that this is an unusual event and does not indicate that the global ozone recovery is speeding up.”
- Large fluctuations in polar vortices and temperatures in the stratosphere lead to ozone holes that vary in size. This year, the warmer polar stratosphere caused a slowing down of the wind fields around the South Pole, or the polar vortex, and reduced the formation of the ‘polar stratospheric clouds’ that enable the chemistry that leads to rapid ozone loss.
- Josef Aschbacher, ESA’s Director of Earth Observation programs, said, "The ozone hole is a perfect example where scientific evidence led to significant policy change and subsequently changes in human behavior. The ozone hole was discovered in the 1970s, continuously monitored from space and by in situ devices and, finally in the 1980s led to the Montreal Protocol forbidding the use of chlorofluorocarbons.
- "Today, the ozone hole is recovering thanks to clear political action. This example shall serve as inspiration for climate change."
- High up in the stratosphere, the ozone acts as a shield to protect us from the Sun’s harmful ultraviolet radiation, which is associated with skin cancer and cataracts, as well as other environmental issues.
- In the 1970s and 1980s, the widespread use of damaging chlorofluorocarbons in products such as refrigerators and aerosol tins damaged ozone high up in our atmosphere – which led to a hole in the ozone layer above Antarctica.
- In response to this, the Montreal Protocol was created in 1987 to protect the ozone layer by phasing out the production and consumption of these harmful substances, which is leading to a recovery of the ozone layer.
- Recovery of the ozone hole will continue over the coming years. In the 2018 Scientific Assessment of Ozone Depletion, data shows that the ozone layer in parts of the stratosphere has recovered at a rate of 1-3% per decade since 2000. At these projected rates, the Northern Hemisphere and mid-latitude ozone is predicted to recover by around 2030, followed by the Southern Hemisphere around 2050, and polar regions by 2060.
- ESA has been involved in monitoring ozone for many years. Launched in October 2017, Copernicus Sentinel-5P satellite maps a multitude of air pollutants around the globe. With its state-of-the-art instrument, TROPOMI, it is able to detect atmospheric gases to image air pollutants more accurately and at a higher spatial resolution than ever before from space.
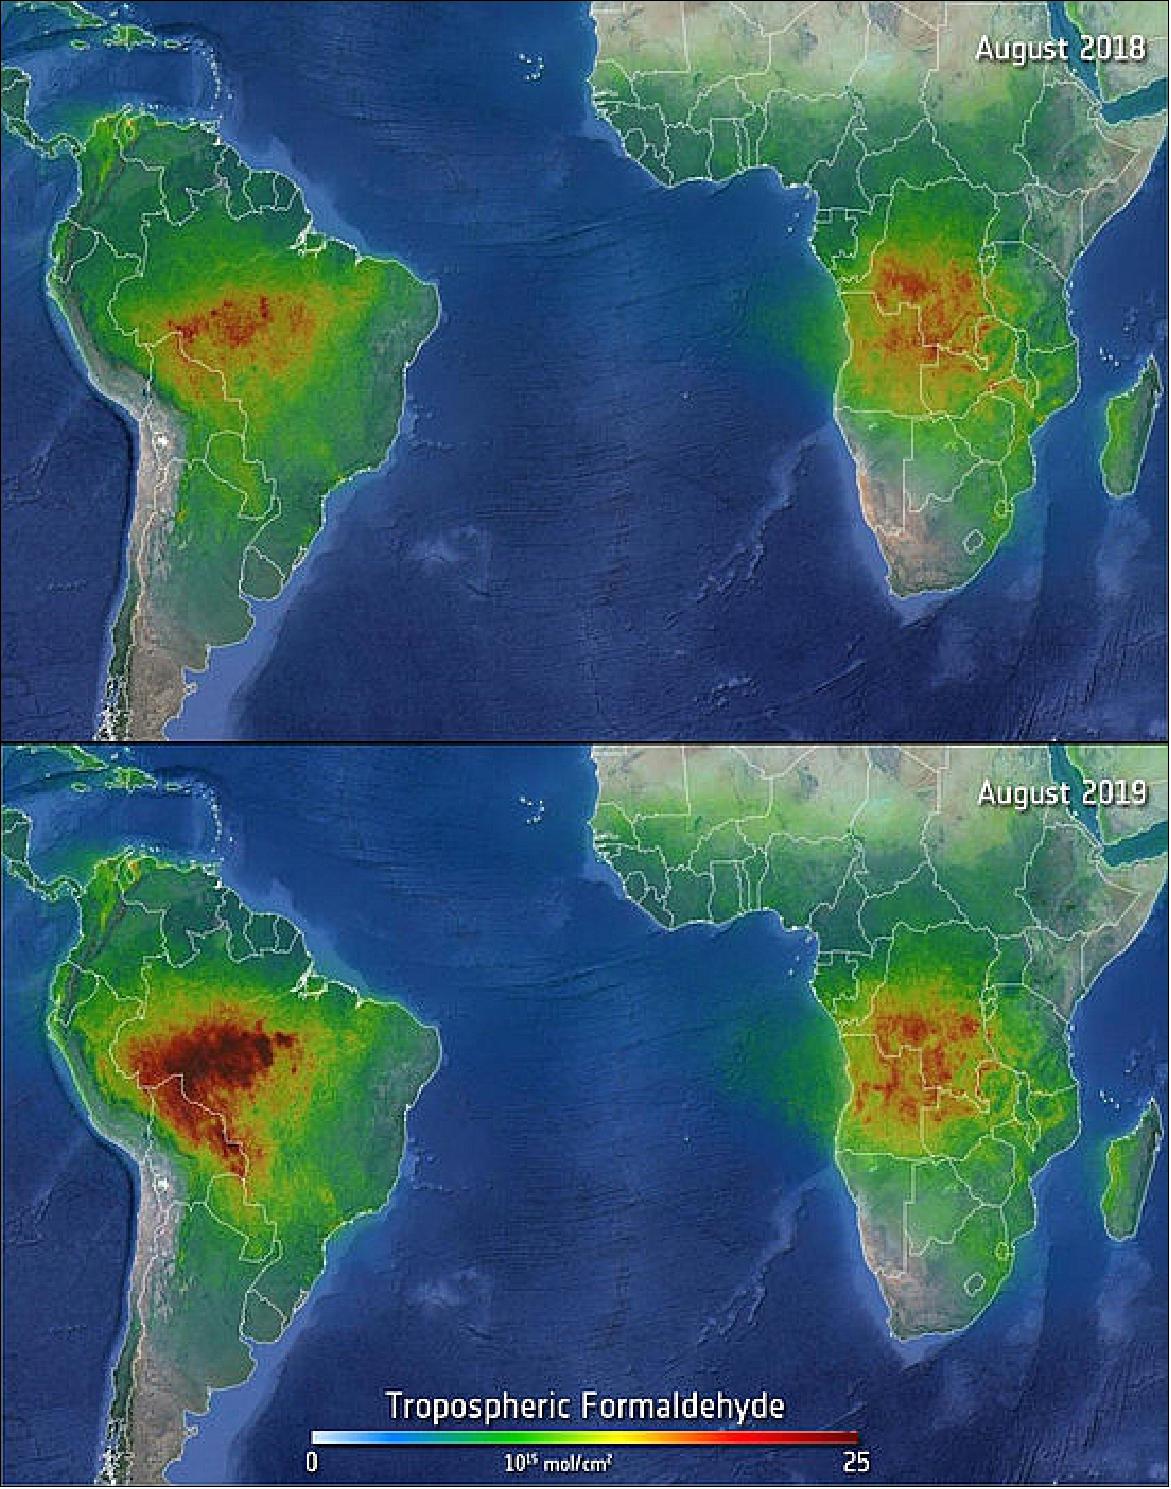
• September 9, 2019: The wildfires that have been devastating the Amazon rainforest have been international headline news over the last weeks. These fires are not only an environmental tragedy in terms of lost forest and biodiversity, but they are also leaving their mark on the atmosphere, affecting air quality and, potentially, the global climate. 4)
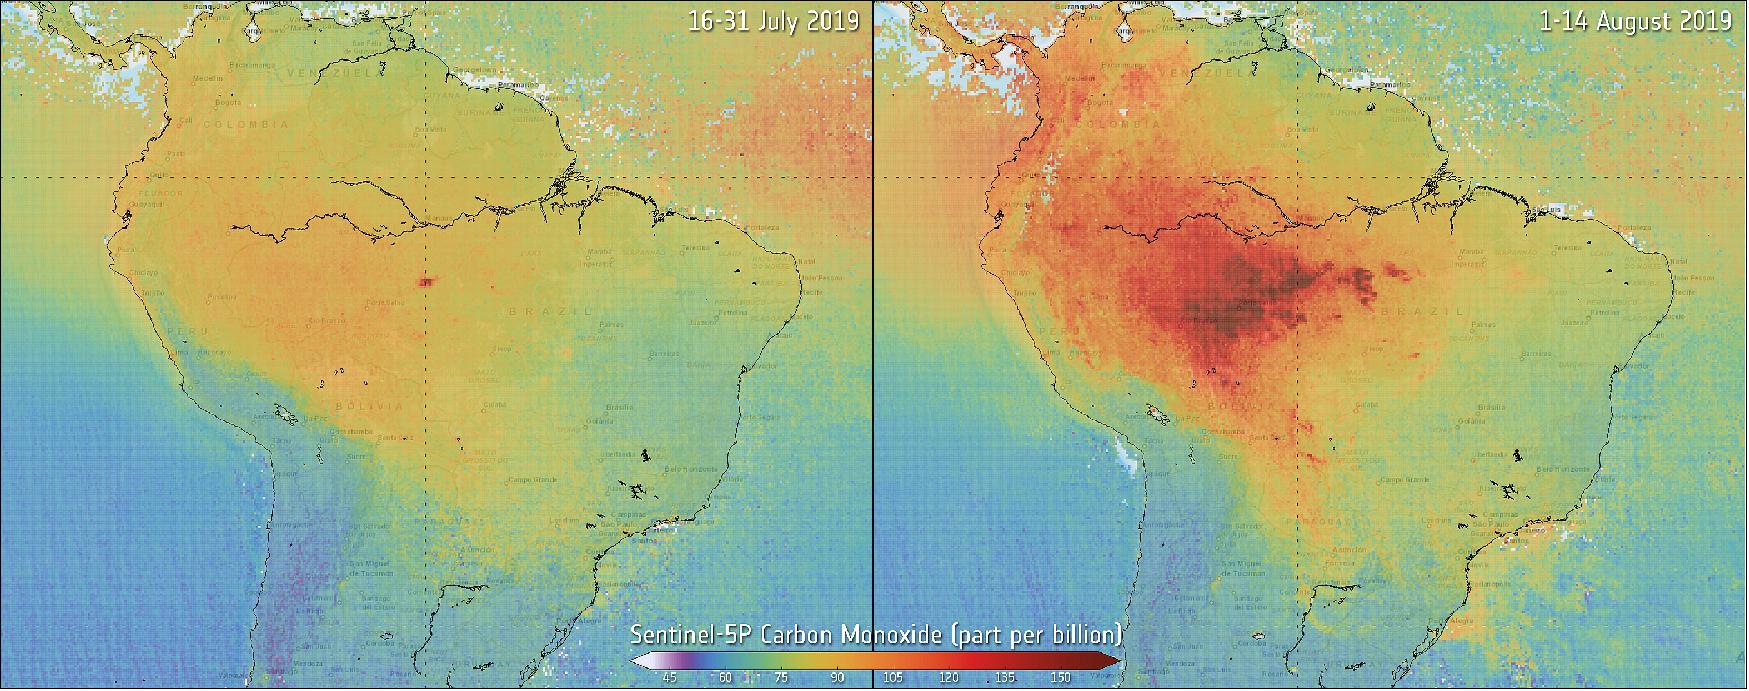
- In light of the climate crisis, the loss of swathes of forest is a serious concern. Everyone on Earth benefits from the health of rainforests like the Amazon. Trees acts as sinks for carbon, absorbing and storing atmospheric carbon dioxide – one of the main greenhouse gases – and therefore helping to cool the planet.
- Consumed by fires in recent months, forests are releasing much of the carbon dioxide they once stored in their biomass back into the atmosphere. However, there are also a host of other pollutants entering the air. The Copernicus Sentinel-5P mission is being used to closely monitor the changes in air quality.
- The satellite carries the state-of-the-art TROPOMI instrument to map a multitude of trace gases such as nitrogen dioxide, ozone, formaldehyde, sulphur dioxide, methane, carbon monoxide and aerosols – all of which affect the air we breathe.
- With both air pollution and climate change major global concerns, satellites play a key role in monitoring the constituents of the atmosphere so that authorities have access to accurate information to help respond to incidents such as these recent fires and, ultimately, formulate environmental policies.
- While Copernicus Sentinel-5P monitors air quality, one of the satellite missions in the same Copernicus family, Sentinel-3, is used to detect fires around the world.
- Josef Aschbacher, ESA’s Director of Earth Observation programs, said, "Over the last months, we have observed more and more vegetation fires on our planet, in Brazil, Siberia, Greenland, Africa, Spain, Greece and many other places. Our Earth observation satellites keep a close eye on them in order to inform people and politicians with undisputed facts about our changing planet."
• June 20, 2019: New maps that use information from the Copernicus Sentinel-5P satellite reveal emissions of nitrogen dioxide along a Siberian natural gas pipeline that connects the Urengoy gas field – the second-largest gas field in the world – with Europe. 5)

- The Urengoy–Pomary–Uzhhorod pipeline is one of Russia’s main natural gas export pipelines. In order to maintain the pressure and flow over long distances, a series of compressor stations are strategically placed to help push the gas along.
- Compressor stations typically run on gas-powered turbines, and their high-temperature combustion usually leads to small quantities of nitrogen dioxide emissions being lost to the atmosphere.
- Until now, it has proved difficult to measure trace-gas concentrations over snow-covered regions such as Siberia, northern Europe and Canada, as it has been very difficult to distinguish clouds from snow and ice in the data retrieval algorithms – considering snow and clouds appear equally bright and cold.
- This reduced the number of months in which nitrogen dioxide could be measured at high altitudes, because satellite measurements were only trusted in summer months, once the snow had melted.
- Using data from the Copernicus Sentinel-5P’s TROPOMI instrument, scientists from the Royal Netherlands Meteorological Institute (KNMI) have now solved this problem.
- If a bright ‘spot’ is detected very close to the height of the surface, it is presumed to be an ice or snow, or in extreme cases, very low-lying clouds such as fog.
- When scientists from KNMI began to investigate these measurements, they quickly noticed a string of spots of nitrogen dioxide, in an otherwise remote area of northern Siberia.
- “By using Google Earth, we could identify small industrial complexes along with what appeared to be a pipeline. By comparing maps of gas pipelines, Google Earth and street view images, we quickly determined that it was the Urengoy natural gas pipeline and gas compressor stations,” says Jos de Laat from KNMI.
- “We estimate the nitrogen dioxide emissions are typically 10—30 ton (N)/month, a small amount. These results show what the high-spatial resolution of TROPOMI combined with new and innovative detection methods, can do,” adds Ronald van der A also from KNMI. “For most locations, there is no nitrogen dioxide information during the snow season, but with this new method, nitrogen dioxide can be observed despite the snow.”
- Josef Aschbacher, Director of ESA’s Earth observation programs, comments, “We think, that these new results will offer new exciting possibilities for detecting smaller-scale emissions, that we did not even know existed today. This will be another example that will lead to a better understanding of air quality.”
• June 10, 2019: Most people get a health boost from exercise. But for those with heart disease or a lung condition such as asthma, exercising during periods of high urban air pollution can exacerbate rather than improve their condition. 6)
- Now scientists at the University of Leicester are developing a mobile application that uses data from Earth observation satellites to map pollution hotspots in towns and cities. The app will enable individuals not only to decide whether or not to go for a run, but also which route to take.
- The work is being funded by ESA’s program of ARTES (Advanced Research in Telecommunications Systems), which aims to develop new business opportunities that benefit European and Canadian industry, in partnership with the UK Space Agency and NHS (National Health System) England.
- Andre Ng, Professor of Cardiac Electrophysiology at the University of Leicester, said: “Whilst we know physical activity is good for many patients with long-term conditions including heart and lung diseases, clinicians are often anxious about recommending exercise and often unable to prescribe accurate and effective exercise for their patients.
- “We will develop a patient-centered mobile app that takes in satellite data with unique resolution including that of air quality that delivers precise guideline-based exercise advice tailored to their condition and ability. This greatly enhances the confidence of both healthcare professionals to prescribe, and patients to put into practice, effective physical activity which improves well-being and reduces healthcare utilization.”
- The app will use data from the Sentinel-5P satellite that was launched in October 2017. It will combine this with realtime, high-resolution air quality data to deliver individualized and disease-specific exercise advice, with pollution warnings at resolutions of just 10 meters.
- Meanwhile a second app is also being developed, which aims to provide air quality forecasts to guide decisions on traffic management in polluted city centers. This is an evolution of work that received early support from ESA’s ARTES program.
- EarthSense, a spin-off company from the University of Leicester, is developing a tool that will enable urban dwellers to see both live and forecast pollution data for city center streets and school-run routes.
- It has just won a second round of funding to run and deliver an advanced demonstration of its technology, this time from Innovate UK.
- EarthSense will use realtime data from air quality sensors installed on streetlamps around Wolverhampton, which record levels of pollutants such as nitrogen dioxide and fine particulate matter.
- “Using the information from the app, users can choose to avoid certain high pollution areas, reducing the amount of emissions inhaled, and hopefully divert traffic away from those areas, thereby reducing the levels of pollution,” said Tom Hall, Managing Director of EarthSense.

• April 5, 2019: Air quality: what’s space got to do with it? — Air pollution is a global environmental health problem that is responsible for millions of people dying prematurely every year. In cities and towns, traffic pumps pollutants such as nitrogen oxides and carbon monoxide directly into the air we breathe, which can increase the risk of cardiovascular and respiratory diseases, for example. Governments and decision-makers rely heavily on satellite data, such as that from the Copernicus Sentinel-5P mission, and computer models to show how pollution accumulates and how it is carried in the air so that they can develop appropriate mitigation strategies. 7)
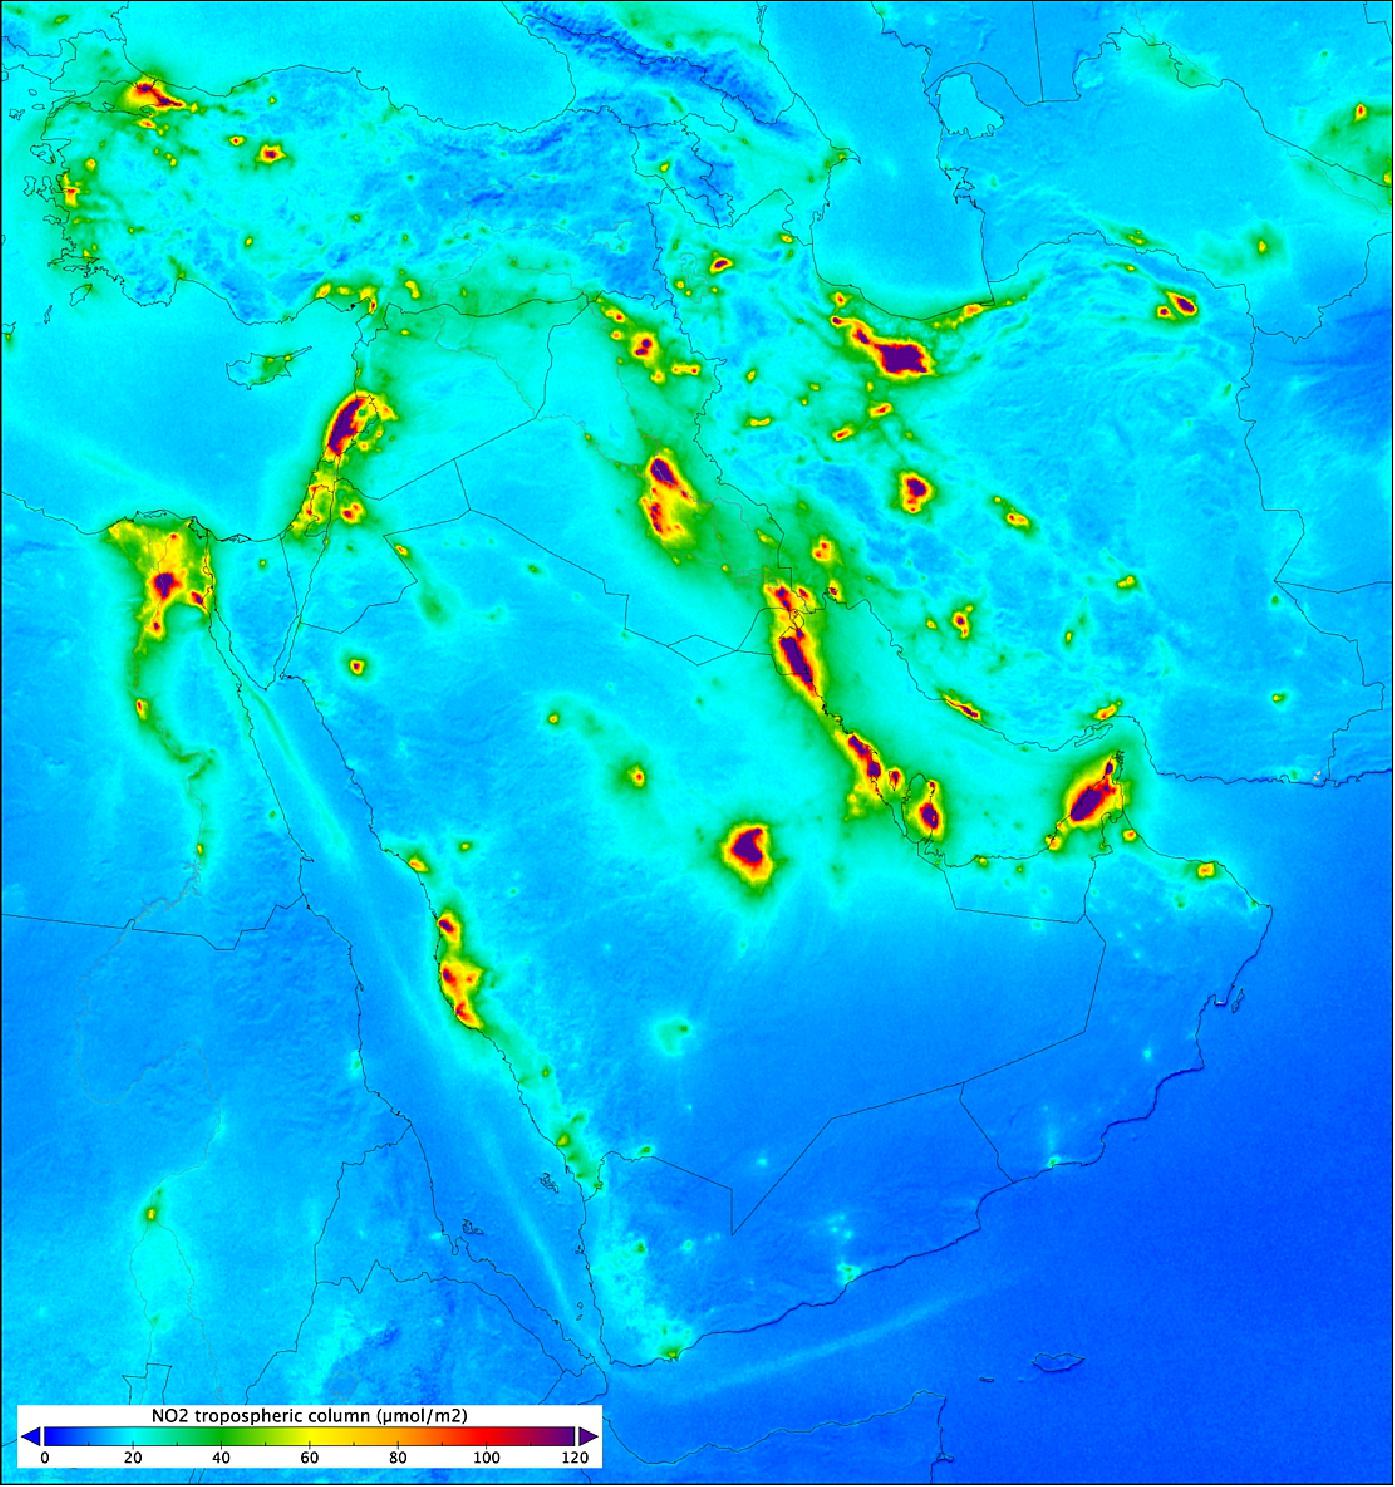
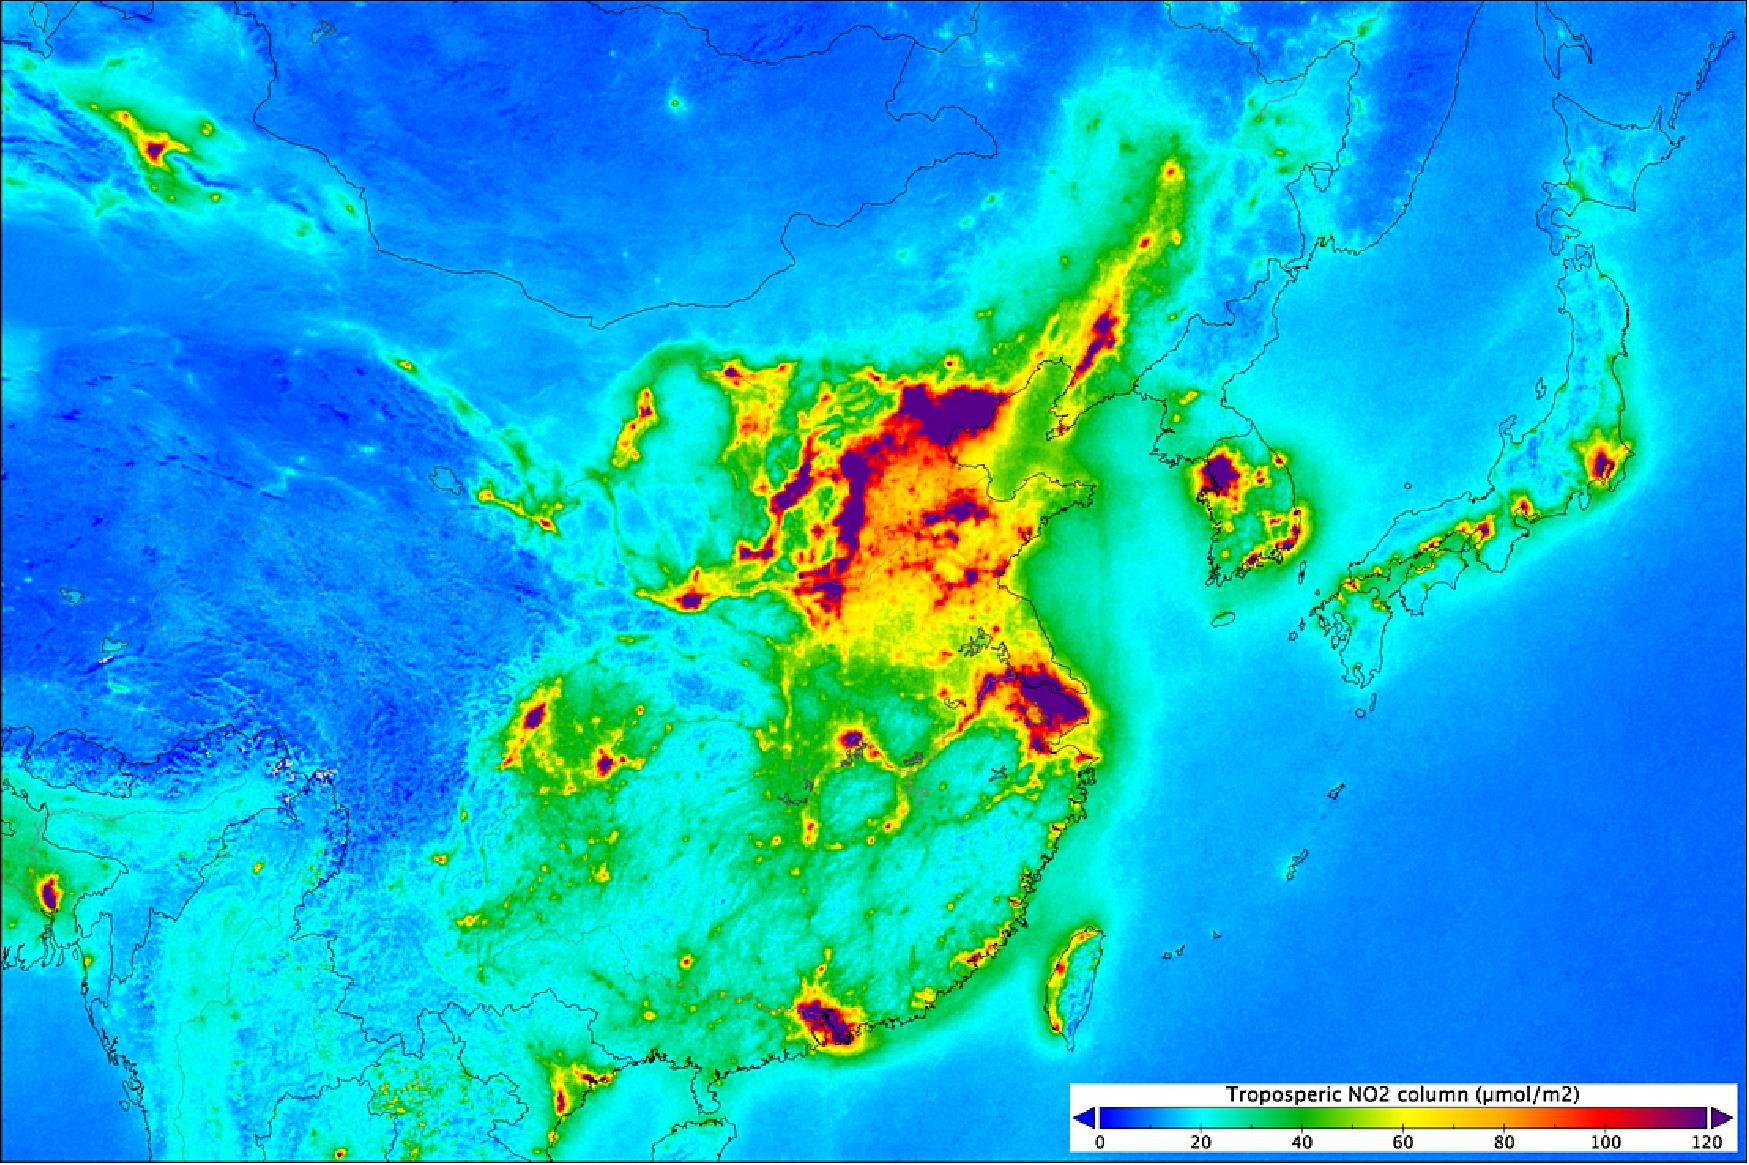
• March 12, 2019: New maps that use information from the Copernicus Sentinel-5P satellite reveal nitrogen dioxide emission being released into the atmosphere in cities and towns across the globe. 8)
- Air pollution is a global environmental health problem that is responsible for millions of people dying prematurely every year. With air quality a serious concern, the Copernicus Sentinel-5P satellite was launched in October 2017 to map a multitude of air pollutants around the globe.
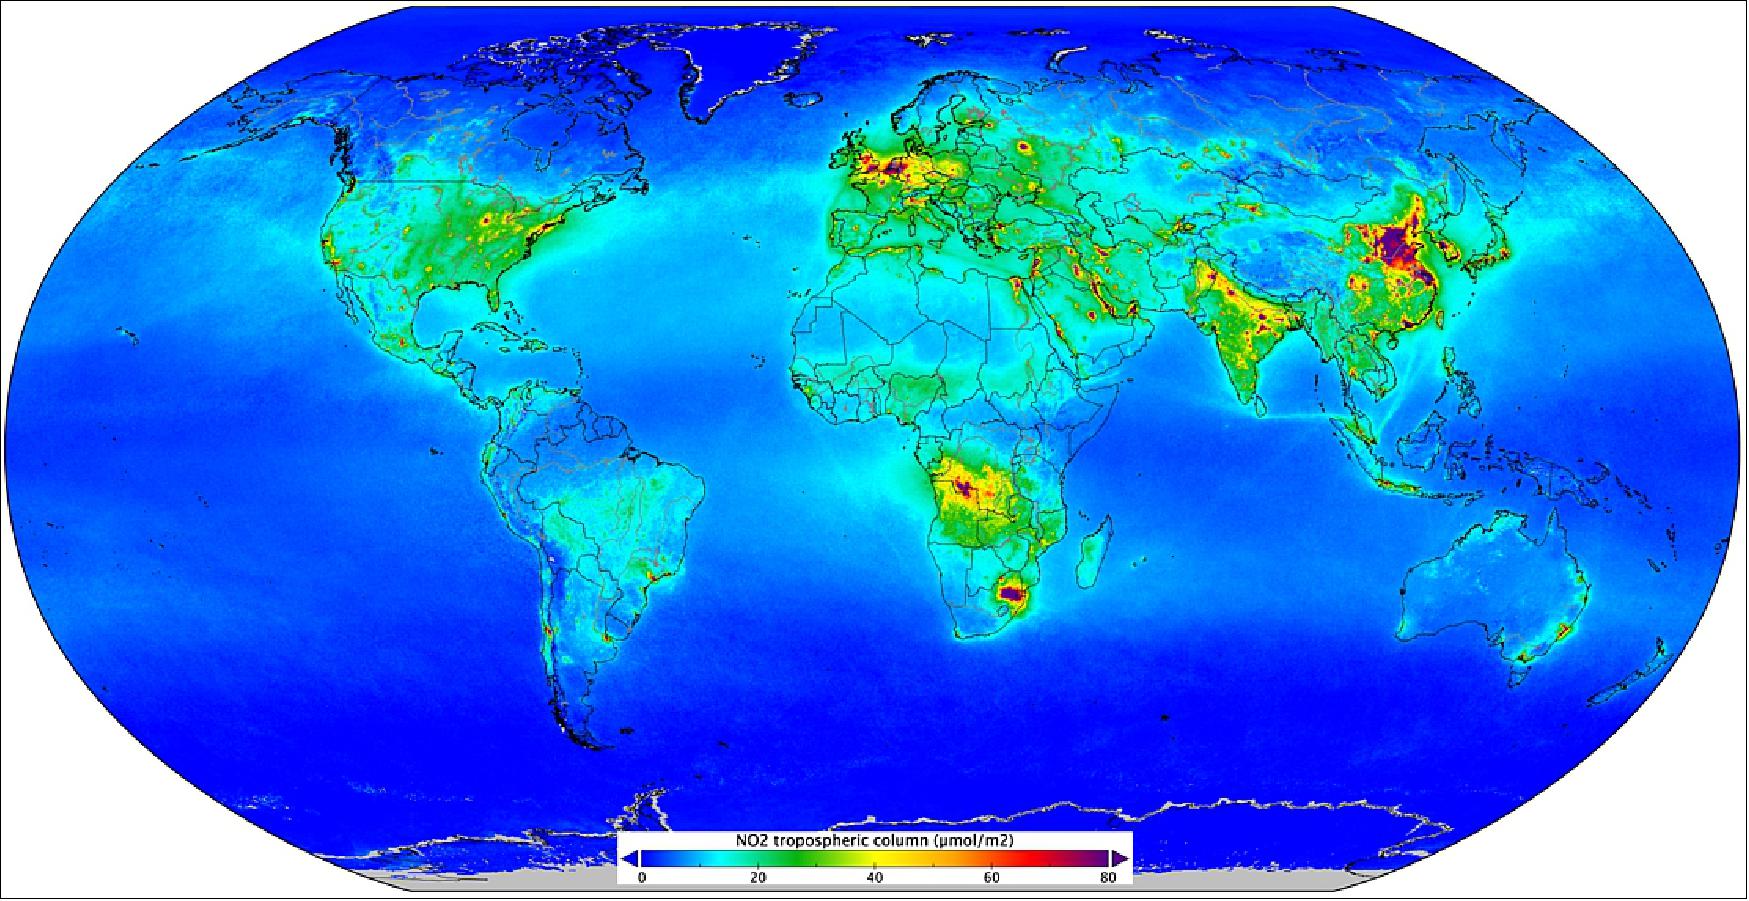
- The satellite carries the most advanced sensor of its type to date: TROPOMI. This state-of-the-art instrument detects the unique fingerprint of atmospheric gases to image air pollutants more accurately and at a higher spatial resolution than ever before.
- “The European Commission is extremely satisfied with the performance of its satellite,” says Mauro Facchini from the European Commission. “It is a major step forward for Copernicus and European Union’s capacity to monitor air quality.”
- It has already delivered key information on sulphur dioxide and carbon monoxide, for example. Now measurements gathered between April and September 2018 have been averaged to show exactly where nitrogen dioxide is polluting the air.
- This kind of pollution results from traffic and the combustion of fossil fuel in industrial processes. It can cause significant health issues by irritating the lungs and can contribute to respiratory problems.
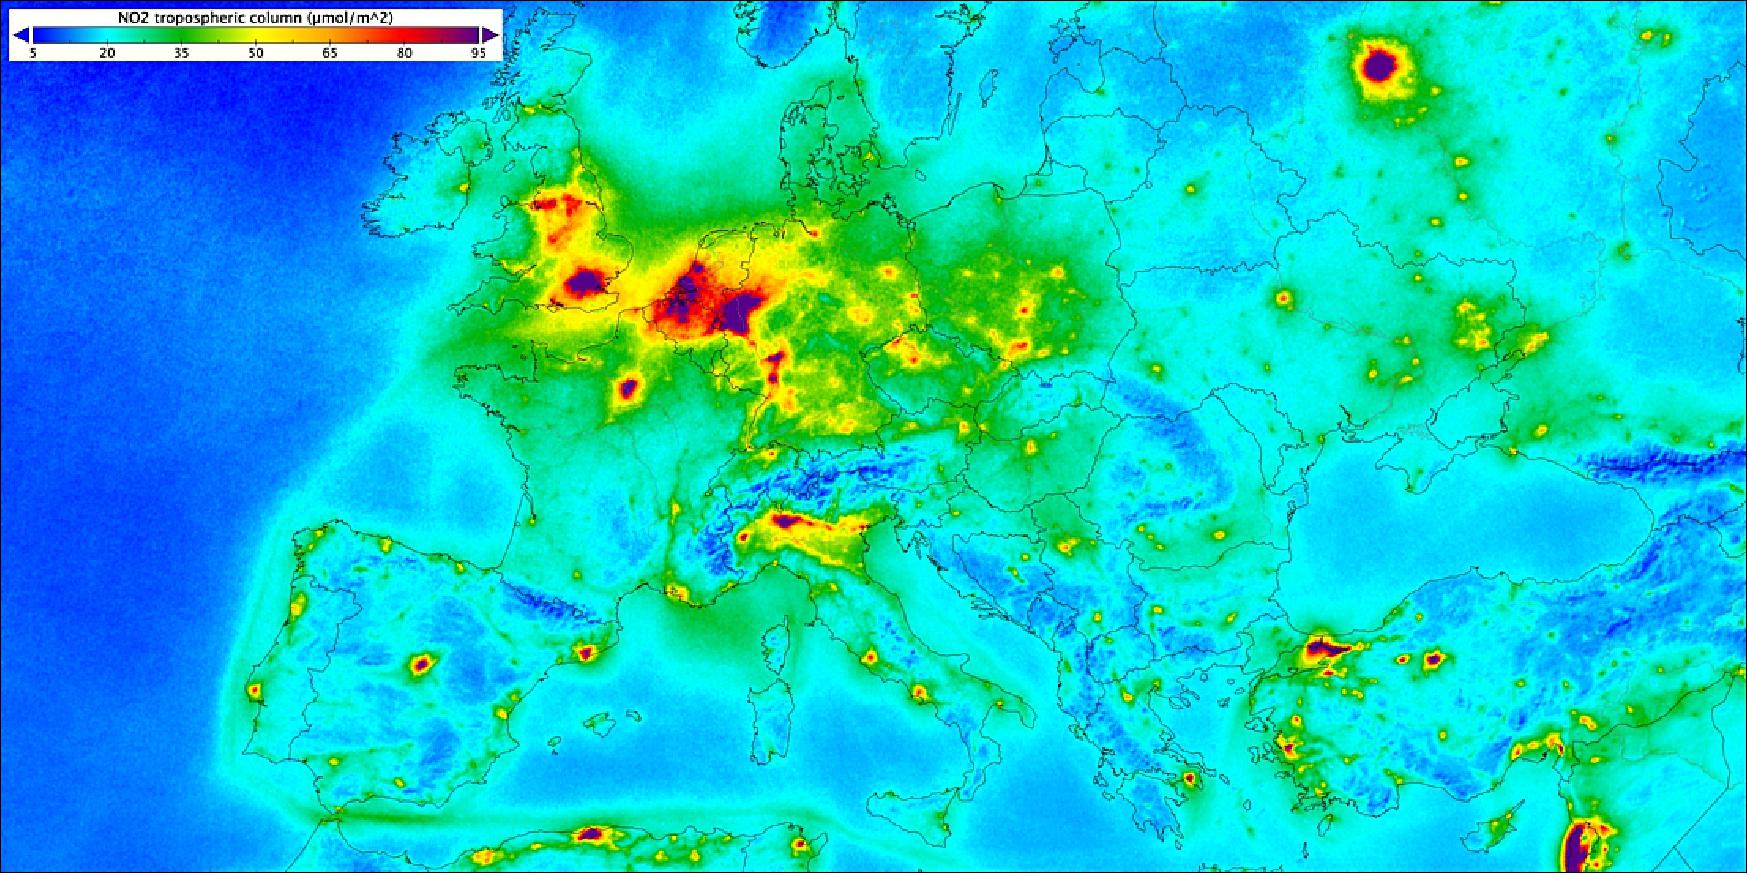
- Henk Eskes, from the Royal Netherlands Meteorological Institute (KNMI), comments, “The map shows emissions from major cities, but also medium-size towns. With Copernicus Sentinel-5P’s TROPOMI instrument, we can observe pollution from individual power plants and other industrial complexes, major highways, and we can identify many more ship tracks than we could before.
- “The TROPOMI instrument has a spatial resolution of 3.5 x 7 km, compared to the resolution of 24 x 13 km we had from the OMI (Ozone Monitoring Instrument) on NASA’s Aura mission. TROPOMI is basically ten times better.
- “This is very valuable in improving our knowledge on how different sectors contribute to the overall emission of nitrogen oxides.”
- Claus Zehner, ESA’s Copernicus Sentinel-5P mission manager, added, “Although we are not thrilled to see all this pollution, we are very happy to see that the satellite is delivering on its promise.
- “The spatial resolution really sets the mission apart, which is exactly what is needed to monitor air pollution and understand where it is coming from.”
- Vincent–Henri Peuch from the ECMWF (European Centre for Medium-Range Weather Forecasts) says, “The Copernicus Atmosphere Monitoring Service, known as CAMS, and operated by ECMWF on behalf of the European Union, is monitoring these nitrogen dioxide data in its daily operations.
- “Current data assimilation tests show a positive impact on the air-quality forecasts, and we expect to upgrade from monitoring to operational assimilation in the coming months.”
- CAMS senior scientist, Antje Inness, added, “CAMS is indeed testing the use of the nitrogen dioxide data in its global forecasting system and hopes to operationally implement this later this year.”
- “The TROPOMI data show amazing details, but the combination of forecast models and satellite observations within CAMS adds extra value. While TROPOMI provides incredible views of pollution hot spots from above, the CAMS global and European forecast models translate this information into concentrations of nitrogen dioxide and other pollutants at ground level. CAMs then forecasts the values for the next four to five days.”
• March 4, 2019: The Copernicus Sentinel-5P mission has been used to produce global maps of two atmospheric gases responsible for making our world warmer: methane, which is a particularly potent greenhouse gas, and ozone, which is a greenhouse gas and a pollutant in the lower part of the atmosphere. The maps give insight into where these gases are coming from. 9)
- Launched in October 2017, Sentinel-5P is the first Copernicus satellite dedicated to monitoring our atmosphere. It carries an advanced multispectral imaging spectrometer called Tropomi to image a wide range of air pollutants more accurately and at a higher spatial resolution than ever before.
- Prior to making data available to the public, scientists spend months testing and evaluating the information to make sure it is accurate. The mission is already being used to map pollutants such as nitrogen and sulphur dioxide and to monitor the hole in the ozone layer over Antarctica.
- And now, data on methane and ozone in the troposphere, which is the lower part of the atmosphere, are available.
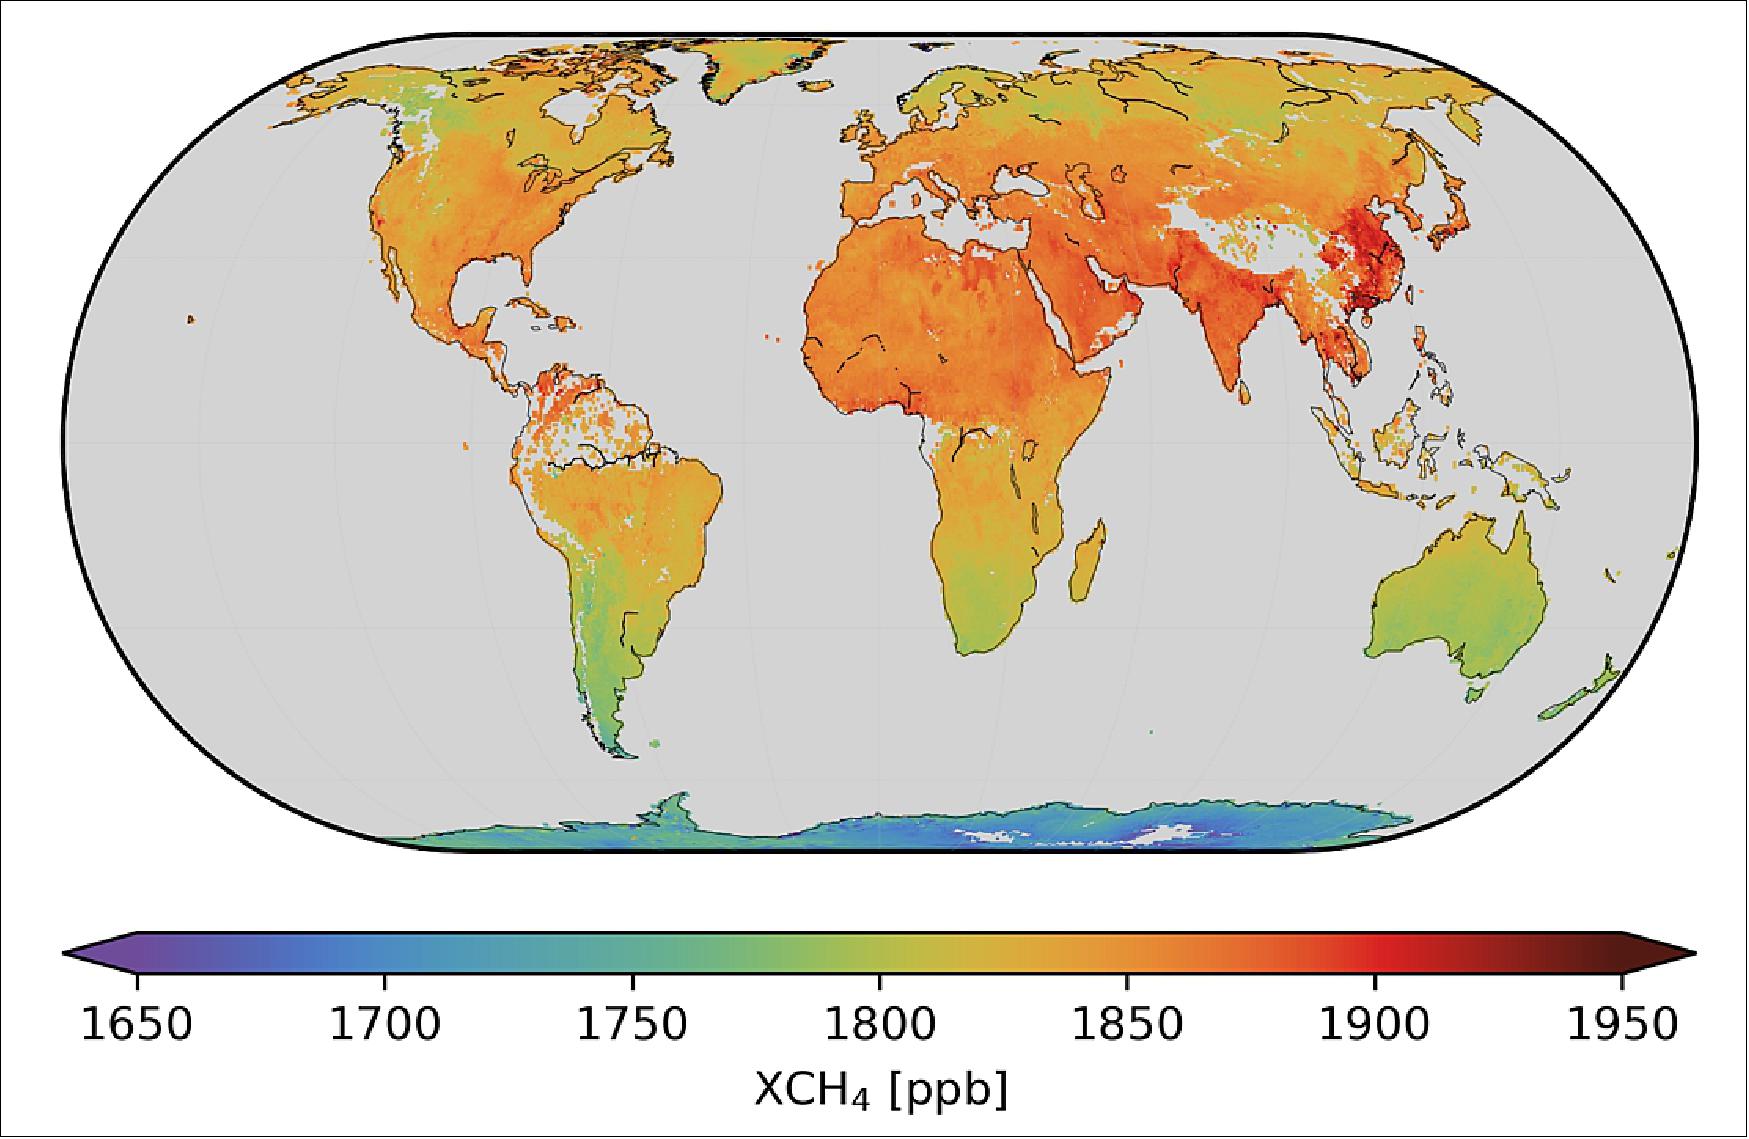
- While carbon dioxide is more abundant in the atmosphere and therefore more commonly associated with global warming, methane is about 30 times more potent as a heat-trapping gas. It enters the atmosphere mainly from the fossil fuel industry, landfill sites, livestock farming, rice agriculture and wetlands.
- Jochen Landgraf, from the SRON Netherlands Institute for Space Research, said, “We have spent more than a year carefully testing the methane data and now the availability of data to everyone offers new opportunities for climate services.
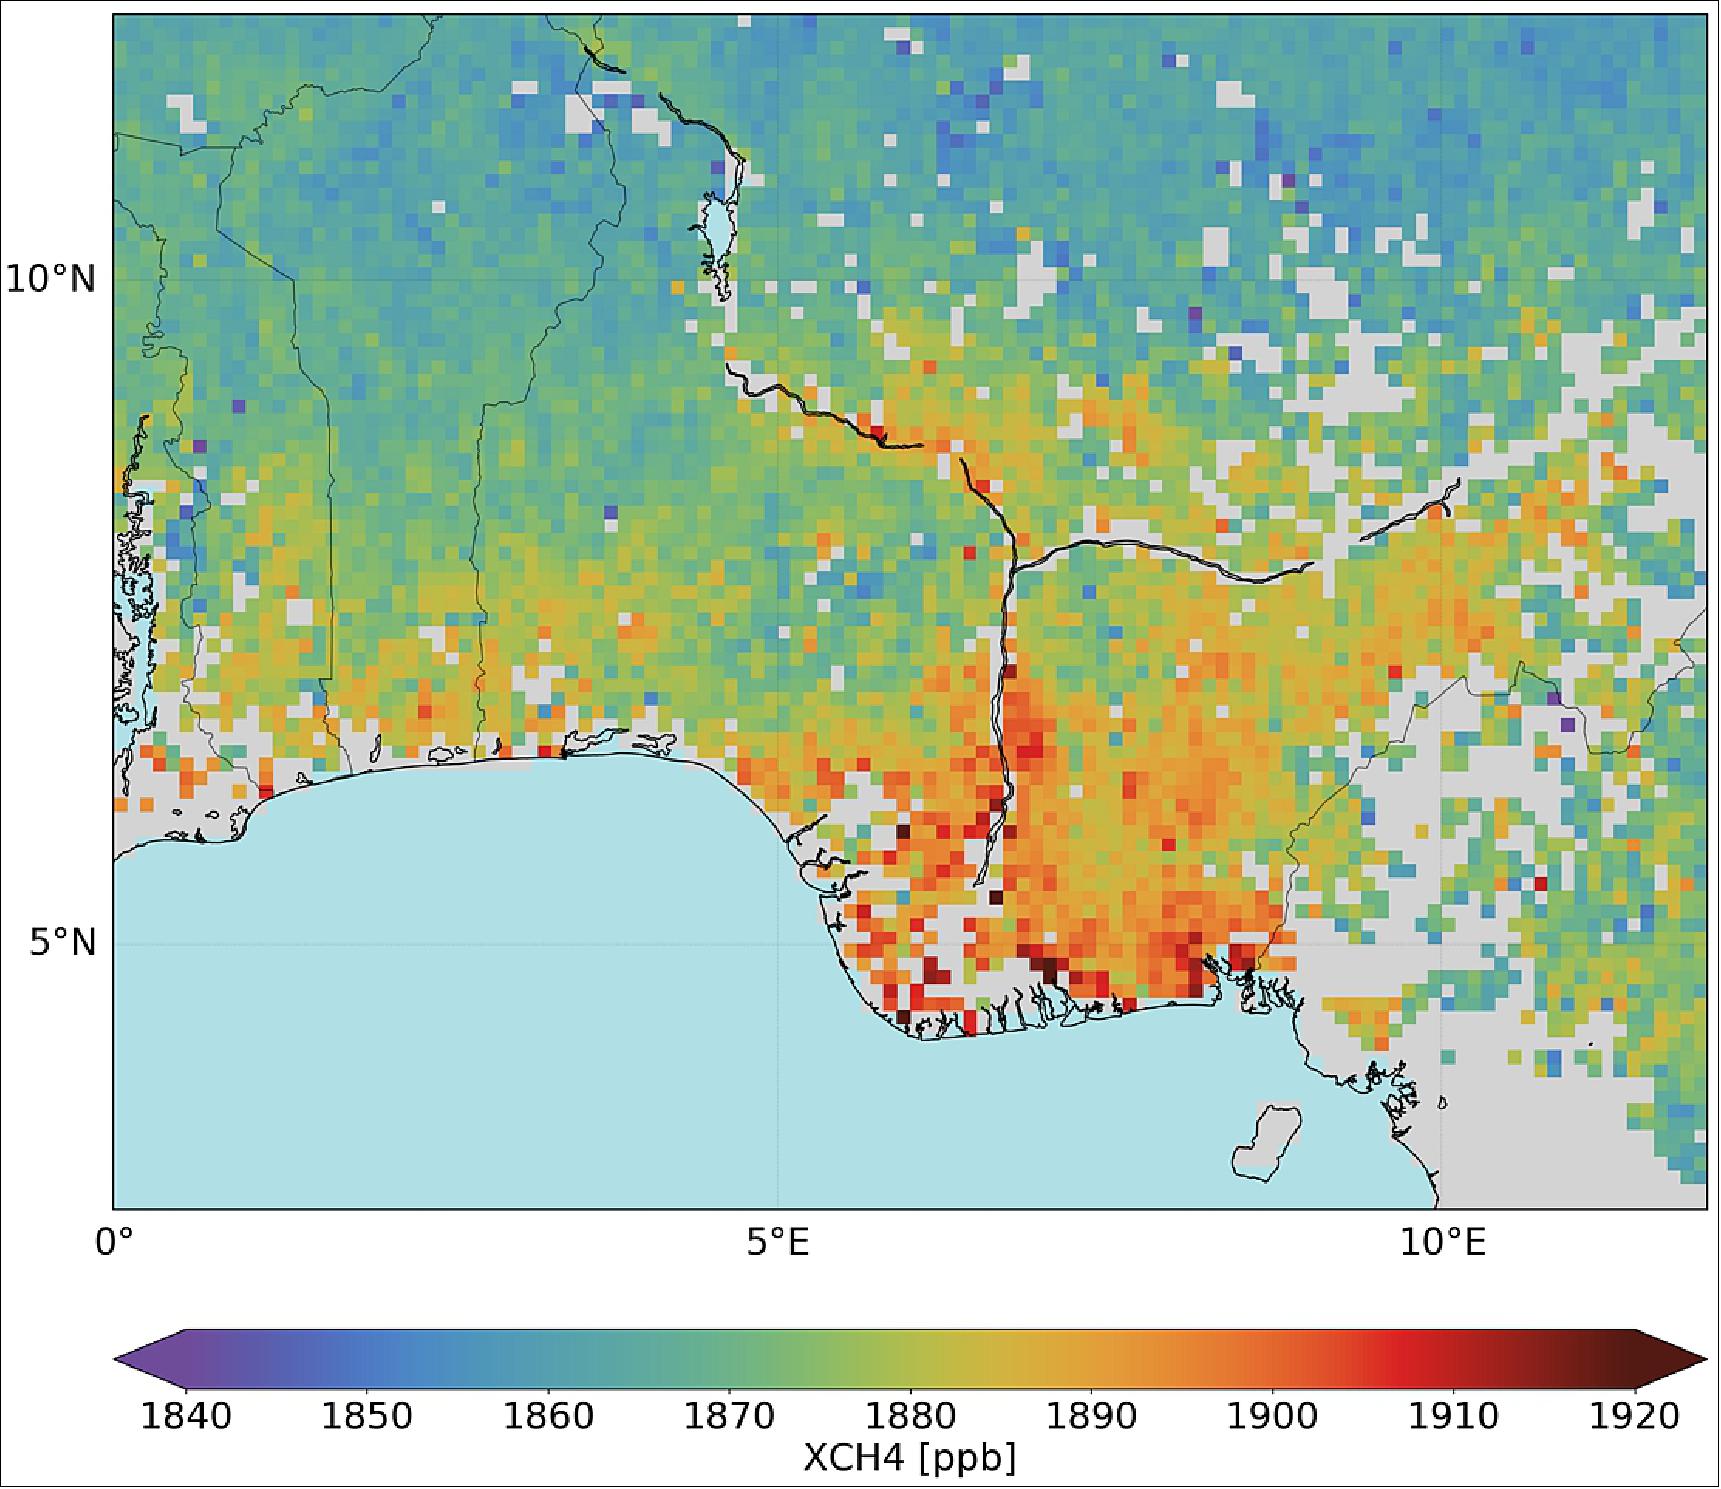
- “Like all gases that enter the atmosphere, methane is spread by the wind, so it is unclear where it originates. But thanks to Tropomi’s ability to measures at a spatial resolution of 7 x 7 km and global coverage every 24 hours, we can see daily methane emissions on regional scales and also larger point sources. - This information is important for policy makers working on climate regulations and for checking that countries adhere to agreements.”
- Michael Buchwitz, from the University of Bremen, Germany, and who leads ESA’s Climate Change Initiative greenhouse gas project, noted, “Over the coming months we will be further studying these data in detail, comparing them with ground-based observations and global models, but we expected that a lot can be learned about atmospheric methane and its various emission sources.”
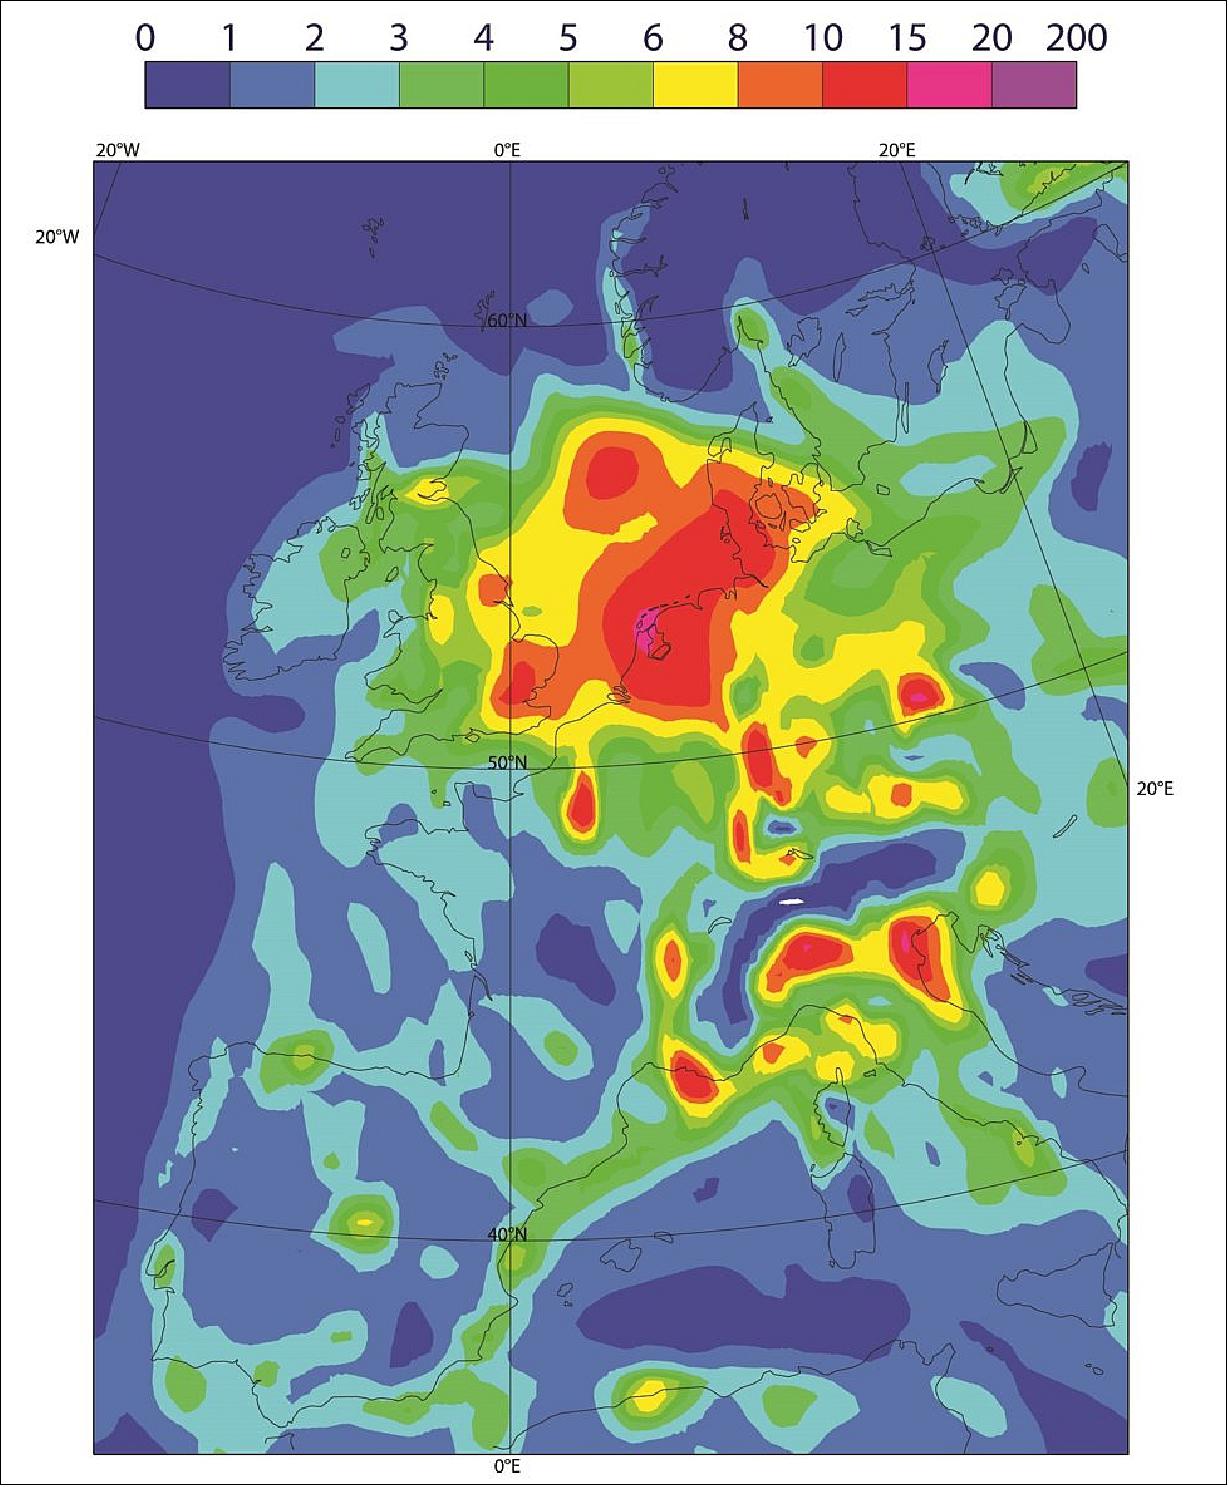
- The new data release also includes tropospheric ozone. Ozone high up in the stratosphere shields us from the Sun’s harmful rays of ultraviolet radiation, but lower down in the troposphere it is a pollutant and can cause respiratory problems and can damage vegetation. Ozone is also a greenhouse gas.
- Diego Loyola, from the German Aerospace Center, explains, “Ozone in the troposphere is an air pollutant and a greenhouse gas contributing to global warming.”

- “Tropospheric ozone is a difficult greenhouse gas to measure because of its short lifespan and the fact that concentrations can vary hugely from place to place,” continued Dr Loyola.
- “The unprecedented spatial resolution offered by Copernicus Sentinel-5P’s Tropomi instrument means that we can now better analyze the complex relationship between tropospheric ozone and climate.”
- Claus Zehner, ESA’s Sentinel-5P mission manager, noted, “With this new methane and tropospheric ozone data release, we are now providing almost all of the Copernicus Sentinel-5P’s data products to the user community. Both products are important for monitoring climate change and can also be used to gain experience for future missions such as for the candidate Copernicus expansion mission that is being developed to measure carbon dioxide.”
- The Tropomi instrument was developed jointly by ESA and the Netherlands Space Office.
1) ”Methane leak visible from space,” ESA Applications, 17 December 2019, URL: http://www.esa.int/ESA_Multimedia/Images/2019/12/Methane_leak_visible_from_space
2) Sudhanshu Pandey, Ritesh Gautam, Sander Houweling, Hugo Denier van der Gon, Pankaj Sadavarte, Tobias Borsdorff, Otto Hasekamp, Jochen Landgraf, Paul Tol, Tim van Kempen, Ruud Hoogeveen, Richard van Hees, Steven P. Hamburg, Joannes D. Maasakkers, and Ilse Aben, ”Satellite observations reveal extreme methane leakage from a natural gas well blowout,” PNAS, 16 December 2019, https://doi.org/10.1073/pnas.1908712116
3) ”Ozone hole set to close,” ESA / Applications / Observing the Earth / Copernicus / Sentinel-5P, 8 November 2019, URL: http://www.esa.int/Applications/Observing_the_Earth
/Copernicus/Sentinel-5P/Ozone_hole_set_to_close
4) ”Monitoring air pollution from fires,” ESA, 9 September 2019, URL: http://www.esa.int/Our_Activities/Observing_the_Earth
/Copernicus/Sentinel-5P/Monitoring_air_pollution_from_fires
5) ”Connecting the dots: nitrogen dioxide over Siberian pipelines,” ESA, 20 June 22019, URL: http://www.esa.int/Our_Activities/Observing_the_Earth/Copernicus
/Sentinel-5P/Connecting_the_dots_nitrogen_dioxide_over_Siberian_pipelines
6) ”How satellites can improve the health of city dwellers,” ESA, 10 June 2019, URL: http://www.esa.int/Our_Activities/Telecommunications_Integrated_Applications
/How_satellites_can_improve_the_health_of_city_dwellers
7) ”Air quality: what’s space got to do with it?,” ESA, 5 April 2019, URL: http://m.esa.int/spaceinvideos/Videos/2019/03/Air_quality_what_s_space_got_to_do_with_it
8) ”Nitrogen dioxide pollution mapped,” ESA, 12 March 2019, URL: http://m.esa.int/Our_Activities/Observing_the_Earth
/Copernicus/Sentinel-5P/Nitrogen_dioxide_pollution_mapped
9) ”Methane and ozone data products from Copernicus Sentinel-5P,” ESA, 4 March 2019, URL: http://m.esa.int/Our_Activities/Observing_the_Earth/Copernicus
/Sentinel-5P/Methane_and_ozone_data_products_from_Copernicus_Sentinel-5P
The information compiled and edited in this article was provided by Herbert J. Kramer from his documentation of: ”Observation of the Earth and Its Environment: Survey of Missions and Sensors” (Springer Verlag) as well as many other sources after the publication of the 4th edition in 2002. - Comments and corrections to this article are always welcome for further updates (herb.kramer@gmx.net).