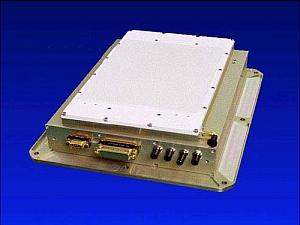
EO-1 (Earth Observing-1)
EO
Atmosphere
Ocean
Aerosols
Managed and operated by NASA’s Goddard Space Flight Centre (GSFC), the EO-1 (Earth Observing-1) spacecraft is a technology demonstration mission in NASA’s New Millennium Program (NMP). Launched in November 2000 and initially designed for 1.5 years of operation, the mission focused on testing cutting-edge satellite and instrument technologies that could be incorporated into future missions. Due to its numerous valuable contributions, NASA approved the extension of the satellite until it was finally decommissioned in March 2017.
Quick facts
Overview
| Mission type | EO |
| Agency | NASA |
| Mission status | Mission complete |
| Launch date | 21 Nov 2000 |
| End of life date | 30 Mar 2017 |
| Measurement domain | Atmosphere, Ocean, Land, Snow & Ice |
| Measurement category | Aerosols, Radiation budget, Multi-purpose imagery (land), Surface temperature (land), Vegetation, Albedo and reflectance, Surface temperature (ocean), Sea ice cover, edge and thickness, Snow cover, edge and depth, Atmospheric Winds |
| Measurement detailed | Aerosol optical depth (column/profile), Land surface imagery, Vegetation type, Fire fractional cover, Earth surface albedo, Short-wave Earth surface bi-directional reflectance, Leaf Area Index (LAI), Vegetation Cover, Land cover, Land surface temperature, Sea surface temperature, Sea-ice cover, Snow cover, Normalized Differential Vegetation Index (NDVI), Sea-ice thickness, Fraction of Absorbed PAR (FAPAR), Glacier cover, Oil spill cover, Soil type |
| Instruments | Hyperion, LEISA AC, ALI |
| Instrument type | Imaging multi-spectral radiometers (vis/IR), High resolution optical imagers, Hyperspectral imagers |
| CEOS EO Handbook | See EO-1 (Earth Observing-1) summary |
Summary
Mission Capabilities
The EO-1 satellite was launched with 13 new technologies, including 3 new instruments: ALI, Hyperion and LAC. The most important goal of EO-1 was to validate the Advanced Land Imager (ALI) instrument for future Earth-observing satellites. Built and tested at the MIT Lincoln Laboratory, ALI is a hybrid multisensor system for the measurement of Earth’s surface reflectance. ALI provided a variety of data including observations of forest cover, crops, coastal waters and aerosols, and has directly shaped the design of the Operational Land Imager (OLI) onboard Landsat-8.
Built by Northrop Grumman (formerly TRW), Hyperion is a hyperspectral instrument that enables scientists to see the chemical constituents of Earth’s surface in fine detail. This data has been used to identify specific minerals, track vegetation type and vigour of forests and monitor volcanic activity. For this reason, it is being considered for incorporation into a potential future hyperspectral satellite by NASA. The final instrument onboard EO-1 is the LEISA Atmospheric Corrector (LAC). Developed by the Advanced Technology Insertion Program, the LAC hyperspectral imager provided atmospheric correction data (water vapour) for ALI and the ETM+ instrument onboard Landsat-7.
Following the first year of successful operations, the EO-1 mission entered its extended mission phase in which the EO-1 Sensor Web Enablement (SWE) experiment and the Autonomous Science Experiment (ASE) software were run on the existing infrastructure and instruments.
Performance Specifications
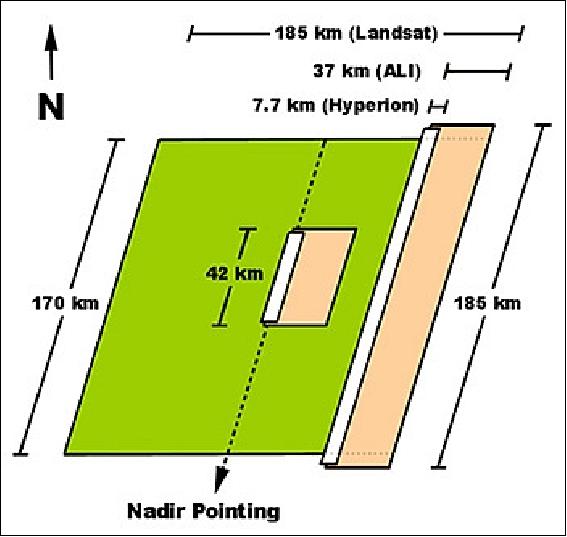
The EO-1 spacecraft was designed to feature the highest performance capabilities within a short lifespan. The ALI instrument features a Wide Field of View (WFOV) telescope and a highly integrated multispectral and panchromatic instrument which provides a swath width of 37 km. The instrument features six spectral bands in the visible to near infrared spectrum (VNIR), three bands in the short-wave infrared spectrum (SWIR) and one panchromatic (PAN) band. These spectral bands have a high spatial resolution of 30m, with a 10m PAN-band resolution. The Hyperion instrument is capable of resolving 220 spectral bands from a range of 0.4 to 2.5 μm with a 30 m spatial resolution and a swath width of 7.5 km. The continuous spectral coverage in the VNIR and SWIR spectrum is defined by a spectral resolution of 10 nm. LAC has a high spectral, moderate spatial resolution capability, imaging 256 spectral bands in the range of 0.89 to 1.6 μm with a spectral resolution of 2 - 6 nm. It covers the full swath width of 185 km at a spatial resolution of 250m.
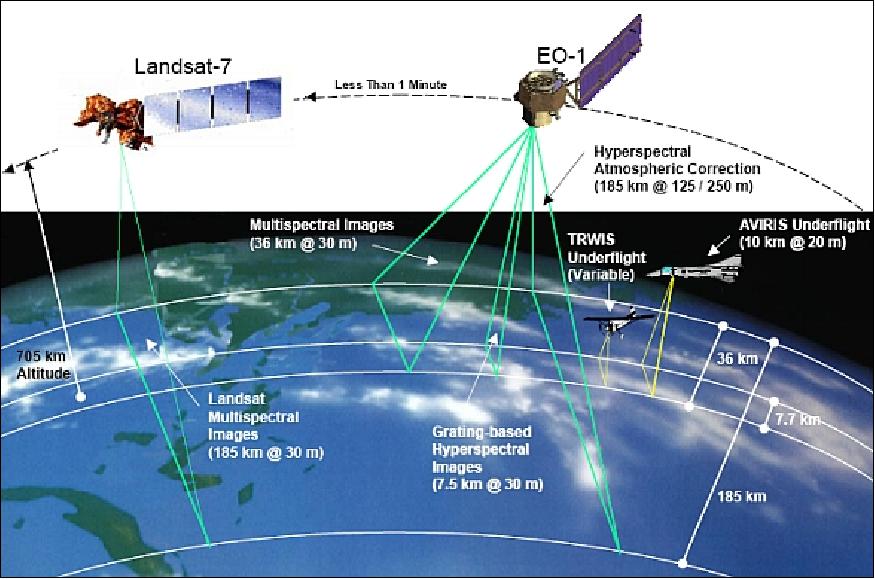
The satellite undergoes a sun-synchronous polar orbit at an altitude of 705 km and an inclination of 98.7°, coincident with that of Landsat-7. The orbit supports a 16 day repeat cycle with a period of 99 minutes. In late 2005, EO-1 was taken out of orbit with Landsat-7 and underwent numerous orbital changes in later years to study the effect of lower orbits on the usefulness of image data.
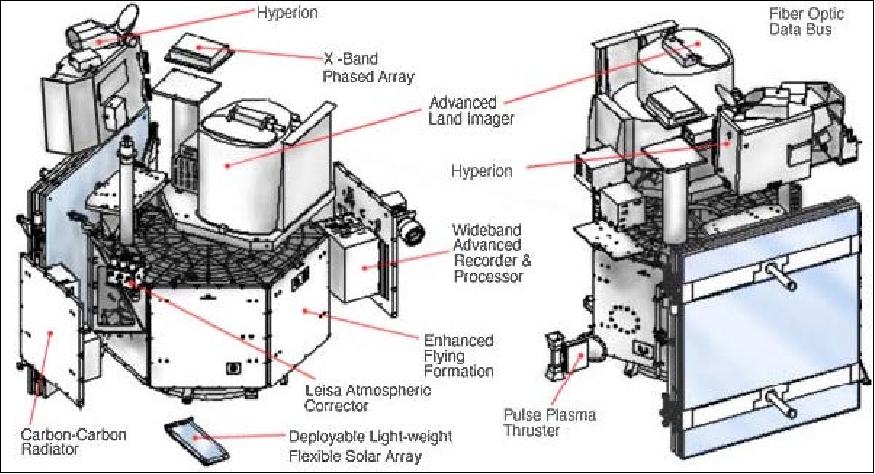
Space and Hardware Components
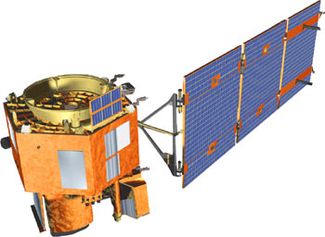
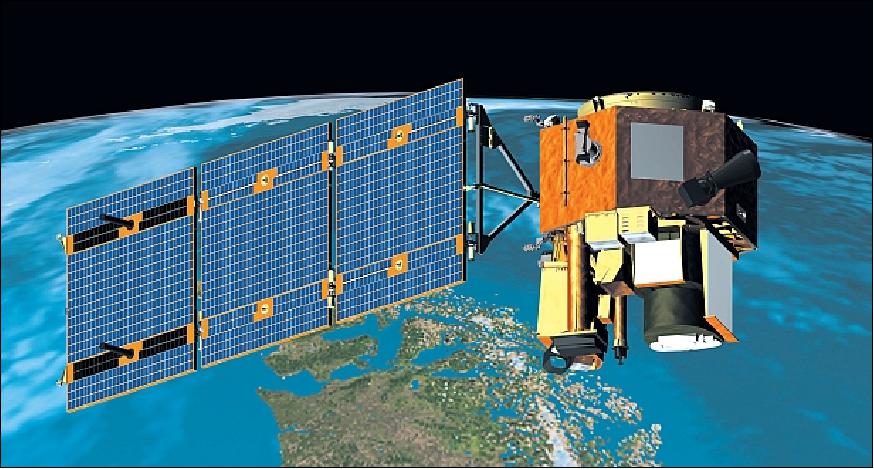
EO-1 was developed with a design-life of 1.5 years, however, after it had no major issues from the initial mission, it continued to operate for another 16 years. The spacecraft was developed and built by ATK Spacecraft Systems and Services with a mass of 588kg. It features a hexagonal bus structure with a Autonomous Star Tracker, an Altitude Control System (ACS), a three-panel solar array, four hydrazine thrusters and a secondary propulsion system (PPT).
In March 2017 it was decommissioned, drained of its energy and became inert. Without fuel to keep it in orbit, the satellite is estimated to degrade and re-enter Earth’s atmosphere in approximately 2056.
EO-1 (Earth Observing-1)
Spacecraft Launch Sensor Complement Demonstration of new technologies Mission Status References
EO-1 is a technology demonstration mission in NASA's NMP (New Millennium Program) Earth science program (a Landsat-7 follow-up) with the overall objectives to perform Landsat-like measurements and to explore new remote sensing technologies (instruments, spacecraft, ground segment) that advance and enhance capabilities [evaluation/validation of technologies and performance, intersatellite calibration (comparison of data), evaluation of lunar calibration, autonomous navigation/instrument operation, use of proven new technologies for other missions]. A number of baseline validation scenarios are defined (generation of test scenes, ground proofs in conjunction with major field campaigns, airborne underflights, tandem flights with Landsat-7, etc.) in support of the overall objectives. S/C design life = 1 year. The paradigm of "faster, better and cheaper" applies to all aspects of the mission. 1) 2) 3) 4)
Spacecraft
The EO-1 spacecraft, managed and operated by GSFC, was developed, built and integrated by ATK Spacecraft Systems and Services (HQ Minneapolis, MN), formerly Swales Aerospace of Beltsville, MD as prime contractor (ATK acquired Swales in 2007). The S/C bus (of MIDEX heritage) features an Al structure, hexagonal in shape with a 1.25 m diameter (across flats) and 0.73 m high (bus mass of 370 kg, payload mass of up to 110 kg). The S/C is three-axis stabilized for inertial and nadir pointing, an AST (Autonomous Star Tracker) provides three-axis attitude knowledge. Four 1 N thrusters of a hydrazine propulsion system provide a pointing accuracy of 0.03º, the jitter is < 5 arcseconds. The PPT, a secondary propulsion system, represents a new technology which may eventually replace the reaction wheels. 5)
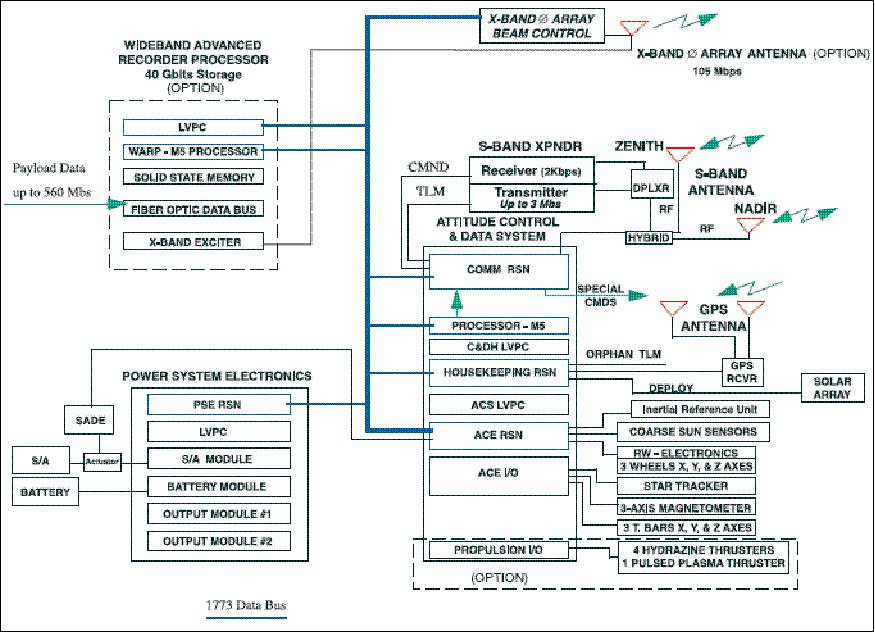
S/C orbit and attitude adjustment is based on GPS receivers and ACS (Attitude Control System) sensors (demonstration of autonomous manoeuvre capabilities initiated by GPS). ACS consists of the following major components: reaction wheel assembly, magnetic torquer bars, a three-axis magnetometer, IRU (Inertial Reference Unit), an autonomous star tracker, a GPS receiver (Space Systems Loral GPS Tensor with 4 antennas), and coarse sun sensors. A versatile ACS software permits S/C slewing to celestial bodies (it provides instrument calibration capability of ALI sun and lunar calibrations); this provides also a cross-track pointing capability to observe adjacent tracks. The EO-1 ACS software includes the functions of the attitude determination and closed-loop control modes for magnetic de-spin following separation from the Delta II launch vehicle, initial stabilization and sun acquisition, nadir pointed science data collection and downlink, thruster manoeuvres for delta-V, and solar/lunar slew/scan manoeuvres for instrument calibrations.
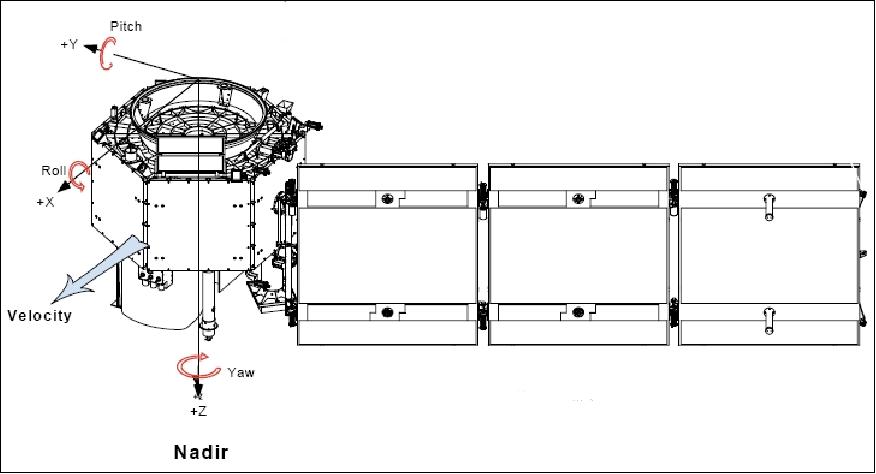
The solar array consists of a single wing, comprised of three panels. The array is canted at 30º, and it utilizes a single-axis drive assembly to clock the array at an orbital rate, essentially keeping the array normal to the sun, minimizing cosine losses. A cable wrap mechanism is implemented between the rotating array and the S/C, which requires the array to "rewind" during eclipse periods, preparing for the next sunlit period in which it moves forward at the orbital rate. Each panel is of size 1.26 m x 1.43 m. Two types of solar cells are used: Si cells of 15% efficiency and GaAs (cascade) cells of 22% efficiency (due to the later addition of the Hyperion instrument). A hydrazine propulsion system with 22.3 kg propellant mass is used for orbit maintenance and formation flying. An onboard solid-state recorder provides science data storage of up to 40 Gbit. S/C total mass =572 kg (dry mass = 370 kg, payload mass = 90 kg), power= 600 W EOL (300 W orbit average) and 50 Ah super NiCd battery (28±7 V DC power).
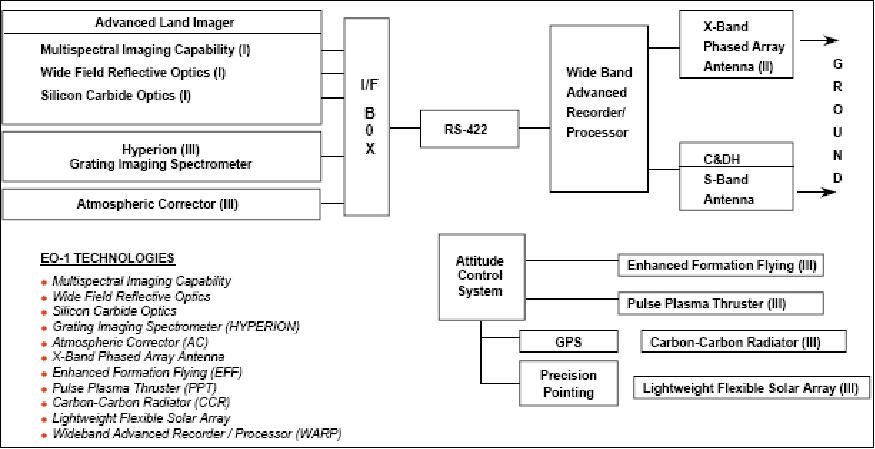
The OBC uses a Mongoose V (M5) processor with 12 MHz and 1.8 Gbit of TT&C data storage. A lightweight fibre optic data bus with ATM (Asynchronous Transfer Mode) protocol is used to transfer onboard data. 6) 7)
Note: The EO-1 spacecraft has two Mongoose M5 processors onboard. The first M5 is used for the EO-1 TT&C functions. The other M5 is part of the WARP (Wideband Advanced Recorder Processor) system, a large mass storage device (see below). Both M5's run the VxWorks operating system.
Orbit:
Sun-synchronous circular polar orbit, altitude = 705 km, inclination = 98.7º, period = 99 minutes, descending nodal crossing time of 10:15 AM. The orbit supports a 16-day repeat cycle. - A coordinated tandem orbit within a minute of Landsat-7 is prescribed for reasons of data calibration and synergetic use of data.
Spacecraft launch mass | 588 kg |
Spacecraft bus dry mass | 410 kg (including WARP and X-band phased array antenna (PAA) |
Spacecraft bus size | 1.4 m x 1.4 m x 2 m high |
Spacecraft structure | Hexagonal; aluminum honeycomb |
Spacecraft power | - 350 W (average), nominal voltage = 28 V, |
Spacecraft stabilization | Zero momentum system, 3-axis stabilized, |
ACS | - Actuators: reaction wheel assembly, magnetic torquer bars, |
Navigation (location) accuracy | 60 m, each direction (3σ) |
C&DH bus architecture | - Mongoose V processor, Rad Hard at 12 MHz, RISC architecture |
Hydrazine populsion system | - 1 tank, 4 thrusters |
RF communications | - Science data storage capability = 48 Gbit within WARP |
Mission design life | 1.5 years, (nominal life = 1 year) |
Launch
A launch of EO-1 from VAFB on a Delta 7320-10 launch vehicle took place on Nov. 21, 2000 (along with SAC-C (CONAE, Argentina), and Munin (Sweden) as secondary payloads).
RF communications:
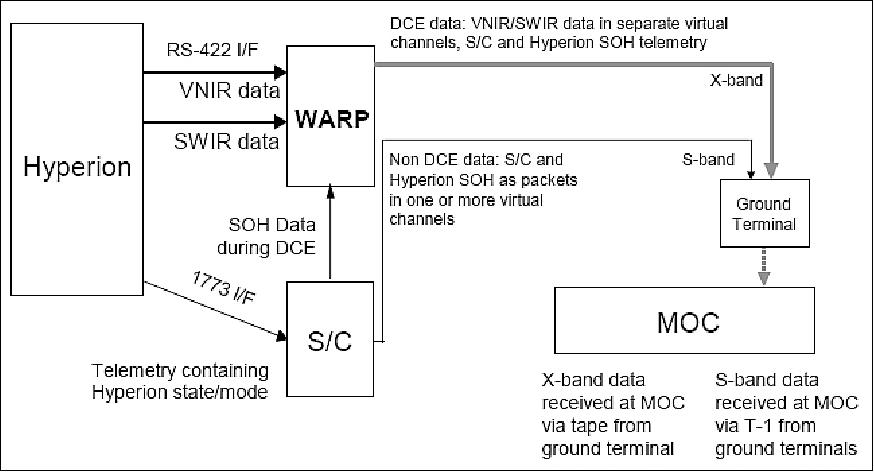
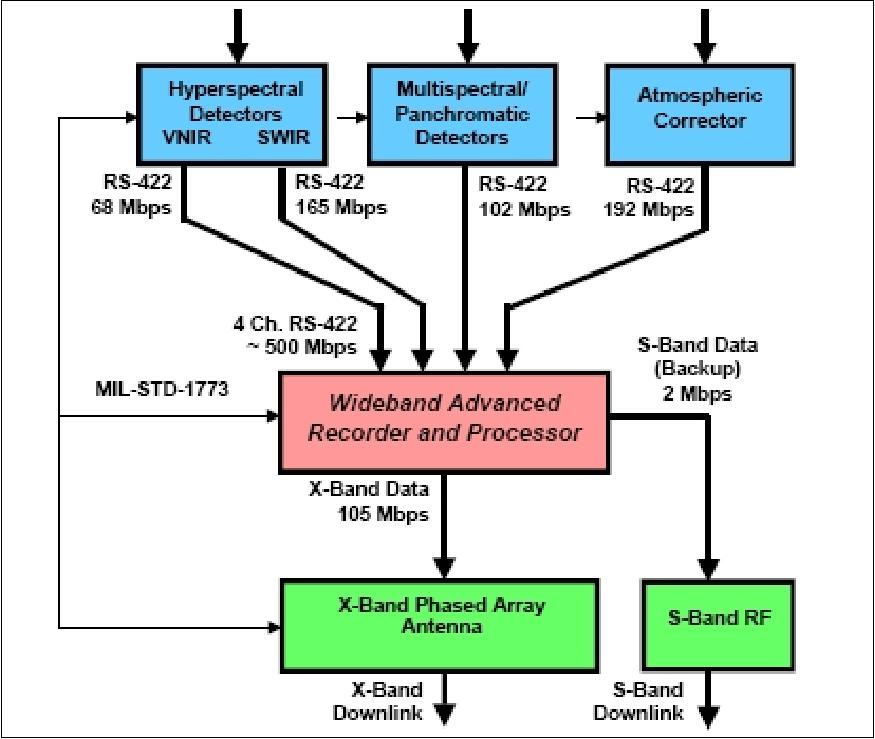
The data system uses the MIL-STD-1773 fiber optic data bus for serial command/telemetry communications at 1 Mbit/s. The EO-1 antenna complement is comprised of two transmit/receive S-band omni antennas and a transmit-only electronically steerable XPAA (X-band Phased Array Antenna). The 64-element XPAA is nadir pointing. The XPAA is LHCP polarized with a 3 dB beam width which varies from 18º-30º depending on scan angle. It scans a 360º azimuth angle within a 65º half cone angle from boresight. Each of the 64 XPAA transmit elements contains its own solid-state power amplifier. One of the omni antennas is zenith facing, the other is nadir facing. Use of CCSDS protocols in all S/C communication links. The science data downlink is in X-band: frequency = 8225 MHz, data rate=105 Mbit/s, minimum EIRP = 22.0 dBW, encoding scheme= modulo-4 gray code differential encoding, modulation=QPSK. The TT&C links are in S-band, either direct or via TDRSS. The downlink data rate is selectable from 2 kbit/s to 2 Mbit/s (2, 32, 1000, or 2000 kbit/s), and the uplink data rate is 2 kbit/s.
The ground network consists of the following stations: SGS (Spitzbergen Ground Station) at Svalbard, Norway; AGS (Alaska Ground Station) at Fairbanks, AK; WOTS (Wallops Orbital Tracking Station) at Wallops Island, VA; and MSG (McMurdo Ground Station) at Antarctica. SGS is the primary station. In addition, there is the TDRSS White Sands Station for links via TDRSS. EO-1 mission operations are provided at NASA/GSFC. 8)
Sensor Complement
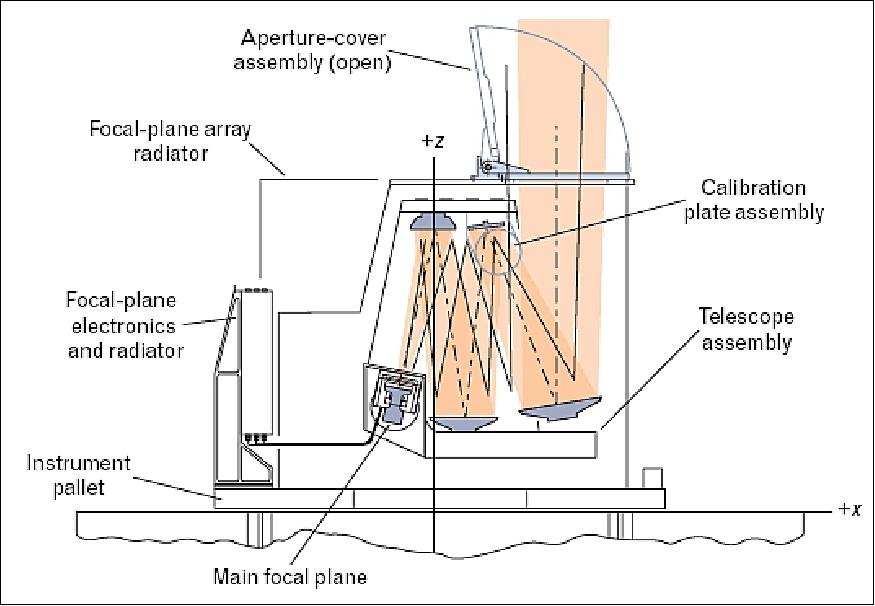
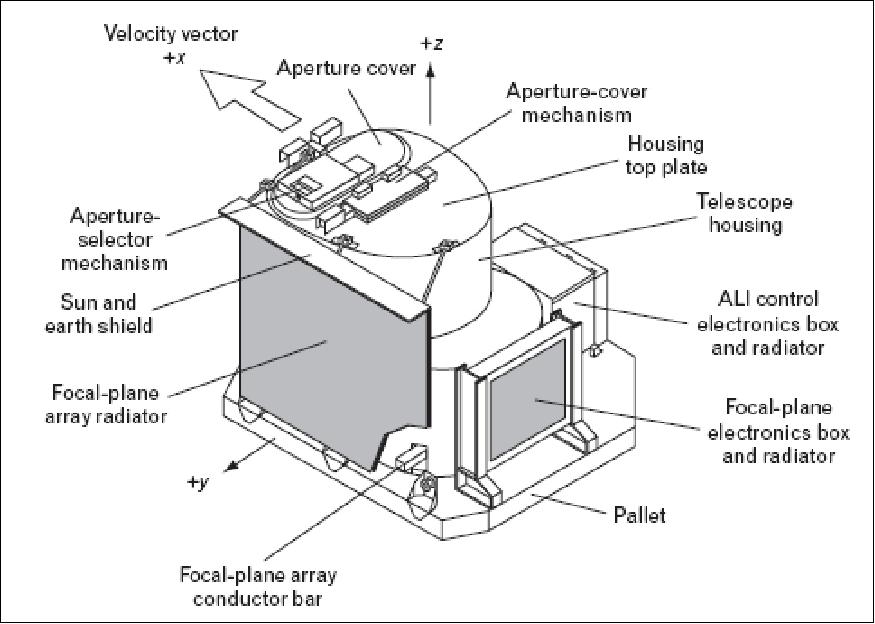
ALI (Advanced Land Imager)
ALI was designed/built and tested at MIT/LL as a prime contractor within the New Millennium Program of NASA [focal plane system: Raytheon/Santa Barbara Remote Sensing (SBRS), optical system: Sensor Systems Group, Inc. (SSG), Wilmington, MA]. ALI is a hybrid multisensor system, a technology verification instrument, for the measurement of Earth surface reflectance. A prime objective is to provide continuity with data from earlier Landsat missions at the reduced sensor/operating costs (introduction of a new measurement approach).
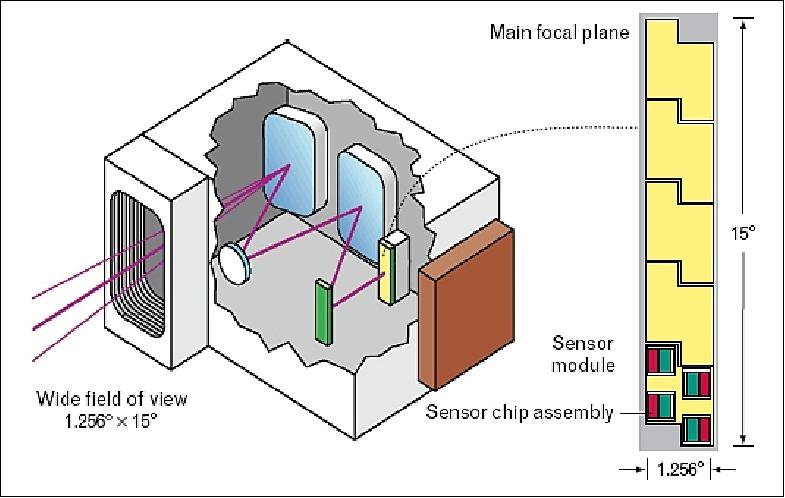
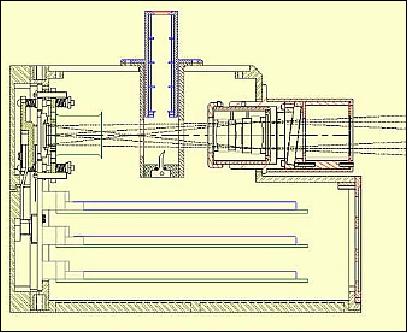
The ALI design features a WFOV (Wide Field of View) telescope and a highly integrated multispectral and panchromatic instrument. The telescope employs a reflective Cooke triplet mirror design with a 12.5 cm unobscured aperture diameter and a FOV (Field of View) of 15º (cross-track) x 1.26º (along-track) and is providing a ground swath of 185 km, nominally centred along the nadir ground-track. The design uses four mirrors; the primary is an off-axis asphere, the secondary is an ellipsoid, and the tertiary is a concave sphere; the fourth mirror is a flat folding mirror. This technology enables the use of large arrays of detectors at the focal plane for covering an entire swath of 185 km. The optical design features a flat focal plane and telecentric performance, which greatly simplifies the placement of the filter and detector array assemblies. The design uses lightweight silicon carbide (SiC) mirrors and an Invar truss structure with appropriate mounting and attachment fittings. The detector array assembly has 10 spectral bands in VNIR and SWIR. Note: SiC offers the advantage of a very high stiffness-to-density ratio and a very high conductivity-to-heat capacity ratio. These characteristics are superior to currently used materials for reflective optical systems. 9) 10) 11)
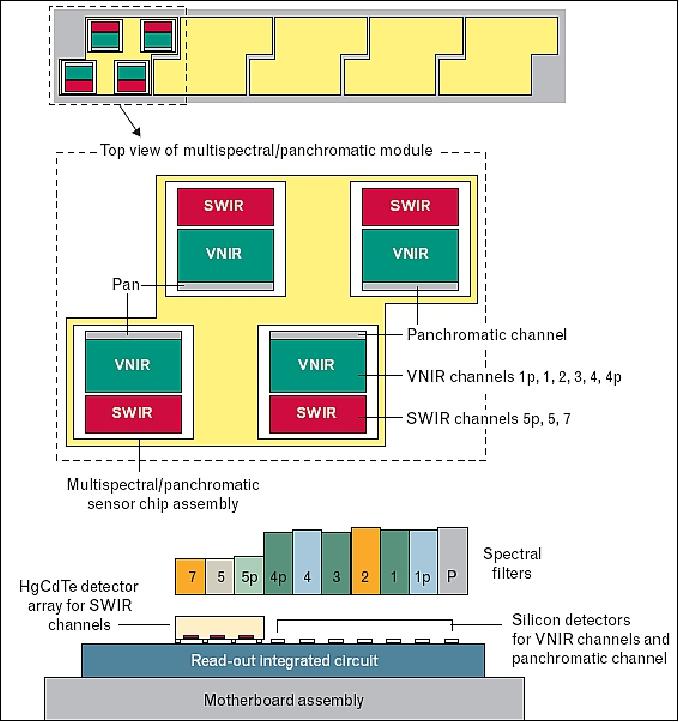
The focal plane assembly (FPA) for ALI is populated with four sensor chip assemblies (SCA) providing a continuous FOV of 3º x 1.625º for a fully populated focal plane, each SCA providing a cross-track coverage of 37 km. There are four SCAs per module. Each module covers a ground swath of about 37 km. A fully populated focal plane would have five populated modules, i.e., 20 SCAs in all. ALI has only one module as a low-cost technology demonstration.
Unlike the Landsat TM and ETM+ whiskbroom scanners, the ALI instrument operates in pushbroom fashion providing panchromatic and multispectral imagery. A single hybridized SCA is employed for PAN/MS (panchromatic multispectral) detection in the VNIR/SWIR spectral range (0.4 - 2.4 µm). This includes a PAN band, six VNIR bands (identical to Landsat ETM+), plus two additional VNIR bands (primed in Table 2), and three SWIR bands. The focal plane is only partially populated with SCAs resulting in only partial coverage by the various SCAs.
• Four MS SCAs are used side by side. Each SCA contains nine rows consisting of 320 MS detector cells in the cross-track direction. The dimension of each MS cell is 39.6 µm x 39.6 µm, providing a GSD (Ground Sample Distance) of 30 m
• The PAN detector cells are integrated directly into each MS SCA as a 960-element row, providing overlapping coverage to the MS bands, but at a 10 m GSD.
The HgCdTe SWIR detectors provide high performance over the 0.9 to 2.5 µm wavelength region at temperatures which can be reached by passive or thermoelectric cooling. The nominal focal plane temperature is 220 K and is maintained by the use of a radiator. Application of detectors of different materials to a single readout integrated circuit (ROIC) enables a large number of arrays covering a broad spectral range to be placed close by together. This technology is extremely effective when combined with the WFOV optical design being used on ALI. The VNIR bands (MS/Pan) use silicon-diode detectors fabricated in the silicon substrate of a ROIC. The SWIR detectors are HgCdTe photodiodes that are Indium-bump bonded onto the ROIC that services the VNIR detectors. 12)
The nominal integration times are 4.05 ms for the MS detectors and 1.35 ms for the Pan. The frame rate can be adjusted in 312.5 ns increments to synchronize the frame rate with ground scan velocity variations due to altitude and velocity variations during orbit. The focal plane electronics samples the output of each detector with a 12-bit converter.
ALI (EO-1) | ETM+ (Landsat-7) | ||||
Band No. | Wavelength (µm) | GSD (m) | Band No. | Wavelength (µm) | GSD (m) |
PAN | 0.480 - 0.690 VNIR | 10 | PAN | 0.50 - 0.90 VNIR | 13 x 15 |
MS-1' | 0.433 - 0.453 VNIR | 30 |
|
|
|
MS-1 | 0.450 - 0.515 VNIR | 30 | MS-1 | 0.450 - 0.515 VNIR | 30 |
MS-2 | 0.525 - 0.605 VNIR | 30 | MS-2 | 0.525 - 0.605 VNIR | 30 |
MS-3 | 0.630 - 0.690 VNIR | 30 | MS-3 | 0.630 - 0.690 VNIR | 30 |
MS-4 | 0.775 - 0.805 VNIR | 30 | MS-4 | 0.760 - 0.890 VNIR | 30 |
MS-4' | 0.845 - 0.890 VNIR | 30 |
|
|
|
MS-5' | 1.200 - 1.300 SWIR | 30 |
|
|
|
MS-5 | 1.550 - 1.750 SWIR | 30 | MS-5 | 1.550 - 1.750 SWIR | 30 |
MS-7 | 2.080 - 2.350 SWIR | 30 | MS-7 | 2.080 - 2.350 SWIR | 30 |
|
|
| MS-6 | 10.40 - 12.50 TIR | 60 |
ALI is the prime instrument of EO-1. It is mounted to and aligned to an interface plate, bolted to the S/C. The instrument-to-S/C alignment is within 20 arcseconds. A comparison of ALI/ETM+instruments (see also Tables 2, 3, and 6) reveals the following: ALI can gather higher-quality imagery than ETM+ but is smaller and less expensive (one-forth); its mass is one-forth, with one-half its size it requires only one-fifth the power of ETM+.
Calibration:
ALI instrument calibration is provided by several means: solar and/or lunar calibration, internal reference lamp calibration, and ground truth calibration. 13) 14) 15) 16) 17)
• On-orbit solar instrument calibration of ALI is conducted in 2-week intervals. This involves pointing the instrument into the sun with the aperture cover closed. A motor-driven aperture selector in the aperture cover assembly moves an opaque slide over a row of small to increasingly larger slit openings and then reverses the slide motion to block all sunlight. Just prior to solar calibration, a space-grade Spectralon® diffuser plate is swung over the secondary mirror by a motor-driven mechanism. The diffuser reflectively scatters the sunlight that would otherwise impinge on the secondary mirror. The scattered sunlight exposes the FPA to irradiance levels equivalent to Earth-reflected sunlight for albedos ranging from 0 to 100%.
• Lunar calibration involves observing the moon with the instrument and comparing the measured lunar irradiance with a predicted lunar irradiance for the observation period. Lunar calibration is used to test the optical MTF of the system.
• Another calibration method involves reflectance-based ground truth measurements of selected target sites (imaging of a stable, high-altitude, flat, diffuse ground target using the ALI while ground teams simultaneously measure the reflective properties of the target region and local atmospheric conditions). Several ground truth campaigns were conducted during the first year of the EO-1 mission.
• Internal calibration: The internal reference lamps are activated during two data collection events per day when the ALI aperture cover is closed.

Parameter | ALI (EO-1) | ETM+ (Landsat) |
Instrument mass | 106 kg | 425 kg |
Instrument power | 100 W | 545 W |
Instrument size | 0.2 m3 | 1.4 m3 |
Nr. of VNIR/SWIR bands | 10 | 7 |
Detectors per band | 6200 | 16 |
Thermal bands | None | 1 |
Data rate | 300 Mbit/s | 150 Mbit/s |
Pan resolution | 10 m | 15 m |
Relative SNR | 4 x | 1 x |
Instrument observation technique | Pushbroom | Whiskbroom scanner |
Swath width | 37 km | 185 km |
Hyperion
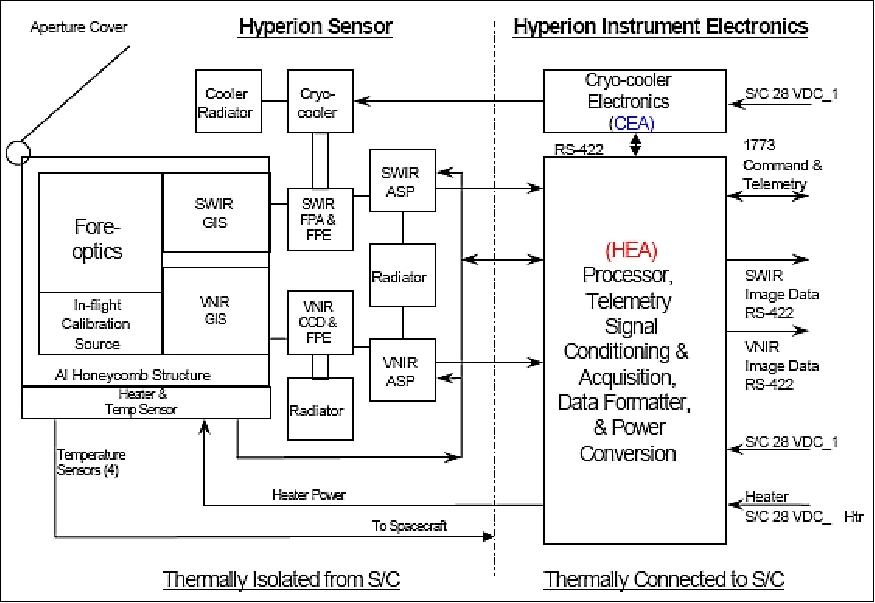
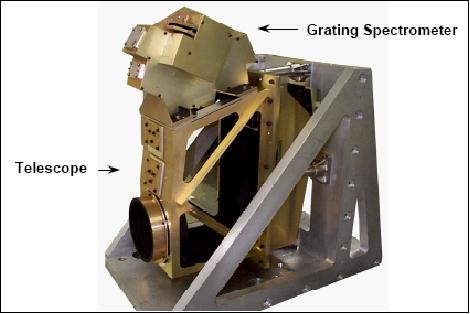
The pushbroom Hyperion instrument is of HSI (Hyperspectral Imager) heritage on the Lewis S/C (launch Aug. 23, 1997, control of the S/C was lost Aug. 26, the S/C was lost and reentered the atmosphere Sept. 28, 1997) and was built by Northrop Grumman (formerly TRW) of Redondo Beach, CA. Hyperion is a pushbroom instrument with a grating imaging spectrometer (slit design); the design includes a telescope, two grating spectrometers with supporting focal plane electronics, and a cooling system. 18) 19) 20)
The fore-optics design is based on the EOC (Electro-Optical Camera) instrument of the KOMPSAT mission (KARI of Korea). The telescope has an aperture diameter of 12 cm, it images the Earth onto a slit that defines the instantaneous FOV which is 0.624º wide (7.5 km swath) x 42.55 µrad in along-track. This slit image of the Earth is relayed at a magnification of 1.38:1 to two focal planes in the two grating imaging spectrometers. A dichroic filter in the system reflects the band from 400 to 1,000nm to one spectrometer (VNIR) and transmits the band from 900-2,500 nm to the other spectrometer (SWIR). The SNR is improved by the two separate spectrometers.
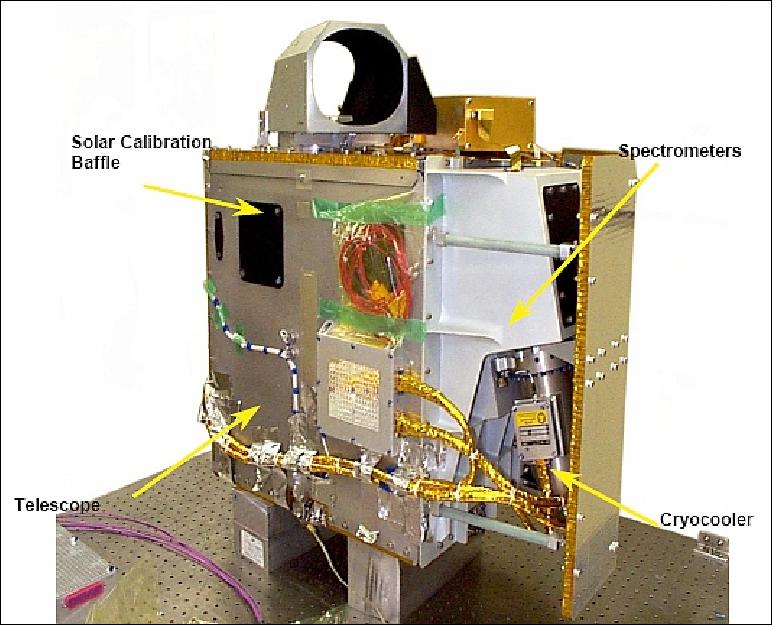
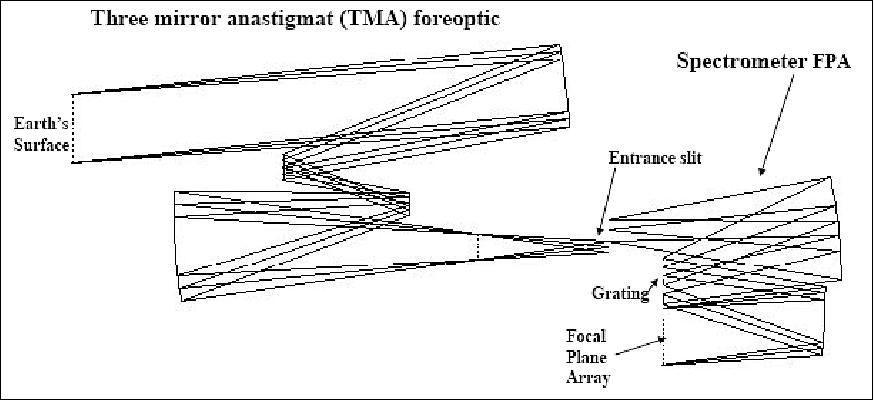
A focal plane array provides separate VNIR and SWIR detectors (HSI heritage). The SWIR detectors are cooled by a cryocooler. A dichroic filter in the system reflects the band from 400 to 1,000 nm to one spectrometer and transmits the band from 900 to 2,500 nm to the other spectrometer. The SWIR overlap with the VNIR from 900 to 1000 nm permits cross-calibration between the two spectrometers. Both spectrometers use a JPL convex grating design in a 3-reflector Offner configuration. The VNIR spectrometer uses a 60 (spectral) x 250 (spatial) pixel detector array, which provides a 10 nm spectral bandwidth over a range of 400-1000 nm. The SWIR spectrometer has HgCdTe detectors in an array of 160 (spectral) x 250 (spatial) channels, cooled to 120 K. The SWIR spectral bandwidth is 10 nm. The telescope is a three-mirror astigmatic design, the high-resolution hyperspectral imager is capable of resolving 220 spectral bands (from 0.4 to 2.5 µm) with a 30-meter resolution. All of the mirrors in the system are constructed from coated aluminium; the structure holding the optical elements is also constructed from aluminium so that the mirrors and housing all expand and contract at the same rates.
Hyperion calibration:
A common calibration system is provided for both the VNIR and SWIR spectrometers. Dual calibration lamps produce reference signals to monitor detector performance following image acquisition. Calibrations are also performed with the sun, ground target sites, and the moon. The solar calibration utilizes a diffuse reflector on the backside of the optical cover to provide uniform illumination across the focal plane arrays. Direct viewing lunar calibration is accomplished by scanning the instrument across the lunar surface. Solar and in-flight calibration data is used as the primary source for monitoring radiometric stability, with the ground site and lunar calibration as secondary alternatives.
The Hyperion on-orbit calibration strategies fell into four general categories: solar; lunar, lamp-based, and opportunistic. Currently, solar calibrations are performed every two weeks. As EO-1 passes beyond the North Pole in its orbit, the spacecraft is maneuvered to point the solar baffle aperture at the sun. The internal lamps are exercised as part of this calibration procedure. 21)
The instrument typically images surface scenes of 7.5 km (swath) by about 100 km in length, providing detailed spectral mapping across all 220 channels with high radiometric accuracy. The data is typically processed into cubes (19.8 km long by 7.5 km wide) to facilitate data handling in current desktop computers. Each image cube consists of 75 MByte of data. A typical acquisition consists of multiple image cubes.
Spectral coverage | 400 - 2500 nm; 400 - 1000 nm (VNIR); 900 - 2500 nm (SWIR) |
FOV | 0.624º (i.e., 7.5 km swath width from a 705 km orbital altitude) |
IFOV (spatial resolution) | 42.55 µrad (30 m ) |
Imaging aperture | 12.5 cm diameter |
Detectors | 60 x 250 silicon CCD array in VNIR; 160 x 250 HgCdTe array |
No of spactral bands | 220 |
Spectral resolution | 10 nm in VNIR and SWIR |
Data quantization | 12 bit |
Frame rate | 225 Hz |
Cross-track spectral error | < 1.5 nm (VNIR), < 2.5 nm (SWIR) (TBR) |
Spatial co-registration of spectral bands | < 20% of pixel (TBR) |
Absolute radiometric accuracy | <6% (1σ) |
Instrument mass, power | 49 kg, 78 W (average) |
Instrument size | 39 cm x 75 cm x 66 cm |
Mode | Cover position | Data collect | Comment |
Standby | Closed | None | Default mode for active state |
Dark calibration | Closed | 100 frames (min) | Performed as close as possible to imaging, before and after |
Lamp calibration | Closed | 100 frames (min) | Performed after second dark calibration: two radiance levels |
Solar calibration | Open 37º | 1 second (min) | Performed over North Pole only to keep cover out of ALI keepout zone; yaw maneuvers required |
Lunar calibration | Fully open (135º) | 1 second (min) | Performed on dark side of earth; off-track spacecraft pointing required |
Ground calibration | Fully open (135º) | 1 second (min) | Ground target selected |
Imaging | Fully open (135º) | 1 second (min) | Nominal data collect is equivalent to Landsat scene, and takes 27 seconds |
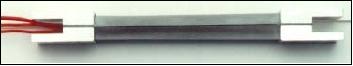
LAC (LEISA Atmospheric Corrector)
The objective is to provide atmospheric correction data (water vapor) for ALI and ETM+ on Landsat-7. LAC is a high spectral, moderate spatial resolution hyperspectral imager based on wedge filter technology. LAC is of WIS and LEISA heritage. LEISA was originally developed for the Lewis satellite mission (launch Aug. 23. 1997) under the Advanced Technology Insertion Program (however, on Aug. 26, three days after launch, an inflight anomaly led to the loss of attitude control and a discharged battery - contact was lost when Lewis entered a spin that disrupted the satellite's power‐generating capability. LEISA was also flown as an airborne instrument in the summers of 1997, 1998 and 1999 as part of the instrument complement in an agricultural sensor program.
The spectral coverage of LAC is from 0.89 - 1.6 µm; in addition there is a separate channel at 1.380 µm to detect cirrus clouds. Spatial resolution = 250 m. LAC is coaligned with the ALI WFT assembly to cover the full swath of 185 km.
LAC is comprised of two modules, the optics module and the electronics module. The optics module contains the lenses, focal planes and electronics necessary to operate the arrays and to transfer the digitized pixel data to the electronics module. It is mounted to the nadir deck of the spacecraft and bore-sighted with ALI. The electronics module contains the command and data interface to the spacecraft, the array timing and bias circuitry, the thermal electric cooler (TEC) control circuitry and the instrument power supply. It is mounted in a bay below the nadir deck.
LAC has a total mass of 10.5 kg, 4.4 kg for the electronics module, 3.9 kg for the optics module and 2.2 kg for the cable connecting them. It uses a maximum power of 48 W on start-up, which decreases to about 35 W for a nominal TEC temperature setting of 275 K, once the temperature is stabilized. At the nominal fame rate of 28 Hz, which slightly oversamples the spatial dimension in the along-track dimension, the data rate is 95 Mbit/s (12 bit A/D converters are used). A frame rate of 56 Hz allows double sampling in the along-track spatial dimension at the expense of reduced single-frame signal-to-noise ratios (SNR).
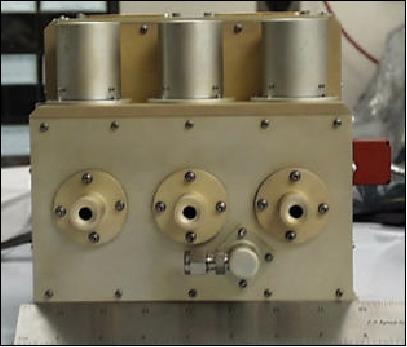
Legend of Figure 20: The optics module is shown with lenses facing upward and solar calibration tubes facing forward. The red object to the right is a cover for the optical alignment cube used to align the LAC with the ALI. The fitting in front is an N2 purge coupling.
The instrument uses three 256 x 256 pixel InGaAs infrared detector focal plane assemblies in a single module. Each array is placed behind a lens covering a FOV of 5º to obtain a swath width of 185 km (15º). A wedged dielectric film etalon filter [a linear variable etalon (LVE)] is placed in very close proximity to a 2-D detector array. This produces a 2-D spatial image that varies in wavelength along one dimension. The filter has a nearly linear dependence of wavenumber on position. It has a 0.45 cm section which covers the 1.2 to 1.6 mm spectral region at a resolution of about 35 cm-1, and a 0.55 cm section covering the 0.9 to 1.2 mm spectral range at a resolution of about 50 cm-1. The sections are bonded together to form a single filter assembly. This filter represents an advance in dielectric thin film technology. Reflective ¼-wave stacked layers placed on both sides of one, or more, ½-wave etalon cavity(s) provide the spectral resolution. Order-sorting of the etalon is accomplished with lower resolution filter layers. In operation, the 2-D spatial image is formed by a small, wide field of view (WFOV) lens. Unlike the grating spectrometer that captures the spectra at a point "instantaneously," the spectrum for the LAC is obtained as the orbital motion of the spacecraft scans the image across the focal plane in wavelength, thereby creating a 3-D spectral map. The spatial resolution of a pixel is 360 mrad x 360 mrad, or about 250 m x 250 m at nadir. 22) 23)
Parameter | Multispectral Instruments | Hyperspectral Instruments | ||
ETM+(Landsat-7) | ALI (EO-1) | Hyperion (EO-1) | LAC (EO-1) | |
Spectral range | 0.4 - 2.4 µm | 0.4 - 2.4 µm | 0.4 - 2.5 µm | 0.89 - 1.60 µm |
Spectral resolution | 30 m | 30 m | 30 m | 250 m |
Swath width | 185 km | 37 km | 7.5 km | 185 km |
Spectral resolution | Variable | Variable | 10 nm | 2-6 nm |
Spectral coverage | Discrete | Discrete | Continuous | Continuous |
PAN band resolution | 13 m x 15 m | 10 m | N/A | N/A |
Nr of bands | 7 | 10 | 220 | 256 |
Demonstration of New Technologies
One important purpose of the EO-1 mission is to, wherever possible, maximize the transfer and infusion of EO-1 validated technologies into other applications and missions. Described below are the technologies that have been transferred and infused or have strong potential for such. 24)
XPAA (X-band Phased Array Antenna)
XPAA was developed and built by the Boeing Co. XPAA is a communication experiment with the objective to demonstrate link-pointing capability with the use of a body-fixed low-mass and low-cost phased array antenna. The antenna is mounted on the Earth-facing side of EO-1 to allow communications with ground stations (downlink of high-rate data from the EO-1 solid-state recorder). 25) 26)
XPAA is composed of a flat grid of 64 radiating elements whose transmitted signals are combined spatially to produce the desired antenna directivity. The phases of each of the radiating elements are varied by computer to point the beam in the desired direction. It has an Effective Isotropic Radiated Power (EIRP) of approximately 160 W and transmits data at 105 Mbit/s. An inherent advantage of the body-fixed design is to permit simultaneous capture and transmission of data, avoiding perturbations to instrument measurements. Some performance parameters are:
• Frequency: 8225 MHz
• Bandwidth: 400 MHz
• Scan Coverage: 60º half-angle cone
• Radiating Elements: 64
• Polarization: LHCP
• Command Interface / Controller: 1773 / RSN
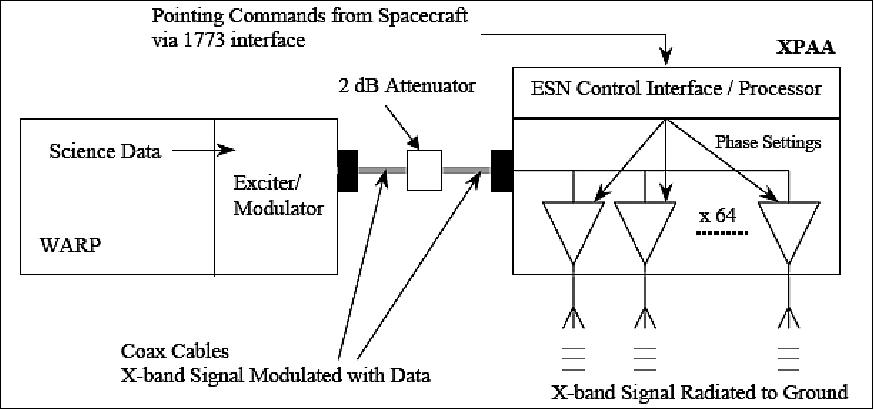
XPAA has an integral controller and power conditioner, communicates with the spacecraft over a MIL-STD-1773 fiber-optic data bus, and is fully space qualified. The antenna aperture consists of an 8 x 8 array of modules, each comprising a dielectrically loaded, circular waveguide, two orthogonal antenna feeds, a phase shifter, and a dual power amplifier. The 64 modules are mounted in a printed wiring board, which distributes radio frequency (RF) excitation, logic control signals, and power to each module. The array and remote service node (RSN) are located in a single enclosure (size: 30.5 cm x 33 cm x 7.4 cm) and a total mass of 5.5 kg (Figure 25).
The validation plan for the XPAA called for collecting data to meet the following objectives:
• Validate the communications link error performance
• Validate the antenna pattern scan performance of the phased array
• Validate the performance and reliability of the antenna's electronics and software in the space environment.
The on-orbit performance of the XPAA was validated, first and foremost, by the conduct of successful science downlinks. Throughout the first year of on-orbit operation, the XPAA has been operated at a rate more than five times the original requirement, without difficulty. All tests show a consistent performance throughout the life cycle of the antenna. 27)
CCR (Carbon Carbon Radiator)
CCR is a material science experiment with the objective to demonstrate various uses of carbon-carbon. The composite material is used in the primary structure of EO-1, serving as both an advanced thermal radiator and a load bearing structure. The advantages of carbon-carbon are: high thermal conductivity (including through thickness) and good strength and weight characteristics. The use of CCR technology may simplify thermal radiator design in some applications (e.g., no need for actively cooled radiators) and support increased science payload mass ratios for future missions. 28)
The Carbon-Carbon Radiator (CCR) shown in Figure 26 is a sandwich composite panel with facesheets made of carbon fibers in a carbon matrix. The EO-1 flight panel is coated with an epoxy encapsulant (Figure 26 left) to prevent particle contamination of sensitive instruments on board EO-1, and provide additional strength to the panel. The external surface (Figure 26 right) of the CCR panel is coated with silver Teflon as required by the EO-1 spacecraft thermal design.
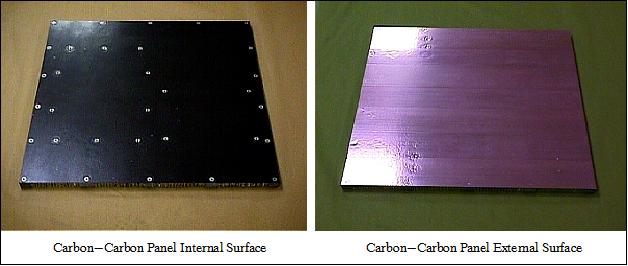
Carbon-Carbon (C-C) is a special class of composite materials in which both the reinforcing fibers and matrix materials are made of pure carbon. The use of high conductivity fibers in C-C fabrication yields composite materials that have high stiffness and high thermal conductivity. The primary thermal function of the EO-1 CCR is to radiate the 27.8 W generated by the EO-1 Power Supply Electronics (PSE) and the 16.3 W (peak power) generated by the LAC electronics boxes. The panel is also a structural member and must support the combined weight of the PSE (23 kg) and the LAC (5 kg) boxes and the dynamic and static loads during EO-1 integration, launch and orbit induced stresses.
The CCR is a 73 cm x 73 cm composite panel with two 0.56 mm thick C-C facesheets bonded to a 2.5 cm 5056 aluminum honeycomb core weighing ~ 3 kg.
The Carbon-Carbon Radiator panel met the mission requirements and its on-orbit performance has been flawless to date. The thermal model results correlate very well with the EO-1 flight data. The on-orbit thermal conductivity correlation for the CCR panel resulted in thermal conductivities close to the reported value of 230 W/m K.
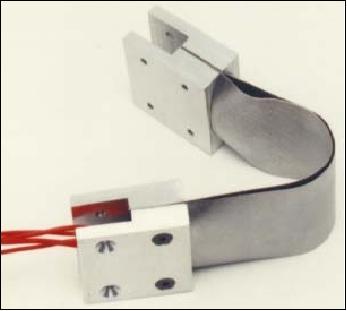
LFSA (Lightweight Flexible Solar Array)
Photovoltaic (PV) solar arrays are the primary sources of electrical power for all Earth-orbiting satellites. The LFSA technology could, for some missions, provide higher power-to-mass ratios (specific energy) than conventional solar arrays, thus allowing a higher science payload mass fraction. The LFSA technology is a lightweight photovoltaic solar array system. 29)
The objective of this photovoltaic system is to demonstrate significant improvements in the power to weight ratios of solar arrays. The LFSA design features:
1) Solar cells of copper indium diselinide (CuInSe2) also referred to as the CIS techniique for an integrated thin‐film solar cell technology.
2) SMA (Shape Memory Alloys) for the hinge and deployment systems.
The shockless deployment technique could improve the spacecraft dynamics during deployment. It is also much safer than conventional solar array systems using conventional pyrotechnics for deployment. The goal of the LFSA initiative is to achieve > 100 W/kg power efficiency ratios (conventional solar arrays of the late 1990s provide <40 W/kg).
CIS solar cells: The CIS thin film solar cell technology is vapor-deposited on a flexible substrate which is substantially lighter than cells bonded to a rigid panel. The LFSA solar cell modules are 10 cm x 10 cm and each consists of 15 monolithically-interconnected cells in series. The AM0 (Air-Mass-Zero) module efficiency achieved for this size was approximately 2%. Higher efficiencies have been achieved on smaller areas.
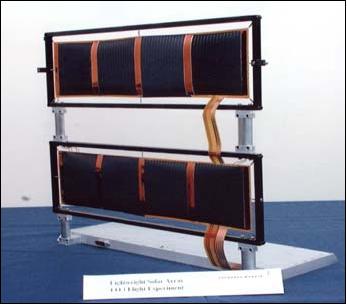
The SMA hinge technique offers substantial mass savings over conventional hinges, deployment systems, and solar array drives. Therefore, a combination of these technologies could provide significant improvement in the power-to-mass ratios. The shockless deployment could improve the spacecraft dynamics during deployment, and also is much safer to handle,integrate and test that conventional pyros. It is also electrically resettable so that the same device flies that is tested. The SMA deployment/hinge devices are significantly cheaper, simpler and therfore more reliable than current technology.
The dual flexure concept was developed for integration on the EO-1/LFSA flight experiment as shown in Figures 28 and 29. In this concept, the SMA strips are heat treated in the deployed ("hot") configuration and joined at the ends by metallic structural fittings. In the martensitic ("cold") state, the hinge is manually buckled and folded into the stowed configuration. Application of heat via internally bonded, flexible nichrome heaters transforms the SMA into the austenitic ("hot") state and causes the hinge deploy. Once deployed, power is turned off and the SMA is allowed to cool back to the low temperature martensitic phase. Although the martensite phase is "softer" than the high temperature austenite phase, the very efficient section geometry in the deployed configuration allows the martensitic SMA hinge to support the lightweight solar array sections.
On-orbit validation: The LFSA was deployed shortly after launch. The indicator switches and the panel temperature profiles indicated that the deployment was nominal.
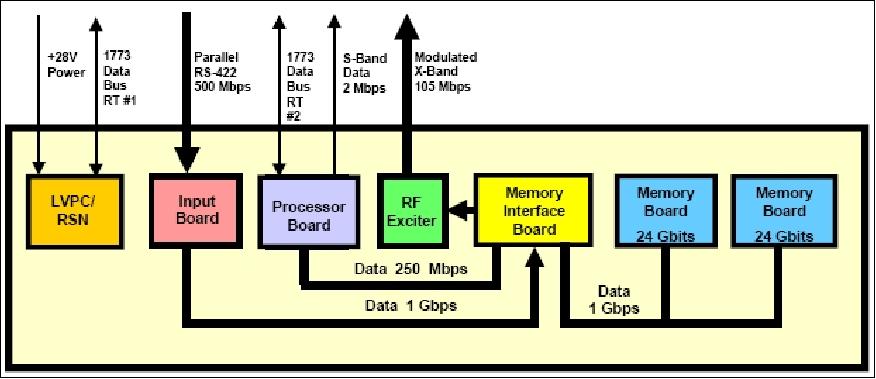
WARP (Wideband Advanced Recorder Processor)
WARP is a high-rate solid-state recorder on the EO-1 spacecraft. The objective is to demonstrate a number of high density electronic board advanced packaging techniques. WARP utilizes advanced integrated circuit packaging (3-D stacked memory devices) and "chip on board" bonding techniques to obtain very high density memory storage per board (24 Gbit/memory card). It also includes a Mongoose V processor which can perform on-orbit data collection, compression and processing of land image scenes. WARP consists of a high-rate (up to 840Mbit/s capability), high-density (48 Gbit storage), low mass (< 20 kg) solid-state recorder/processor with X-band modulation capability. It is in fact the highest rate solid-state recorder NASA has flown so far. 30) 31) 32) 33)
Data storage | 48 Gbit |
Data recording rate | > 1 Gbit/s burst mode, 900 Mbit/s continuous |
Data playback rate | 105 Mbit/s in X-band (with built-in RF modulator) |
Data processing | Post-record data processing capability |
Instrument mass, size | 18 kg, 25 cm x 39 cm x 37 cm |
Power | 38 W orbital average, 87 W peak |
Thermal | 15 - 40ºC minimum operating range |
Mission life | 1 year minimum, 1999 launch |
Radiation | 15 krad minimum total dose, LET 35 MeV |
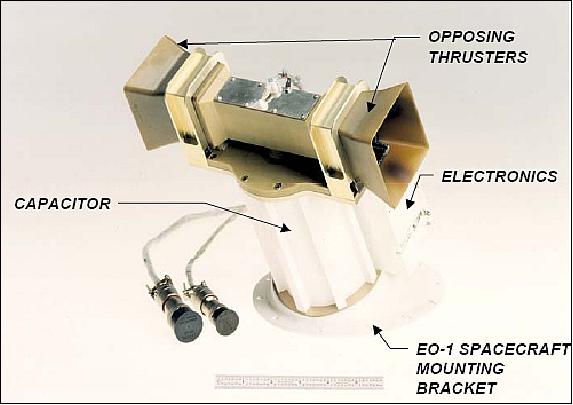
PPT (Pulsed Plasma Thruster)
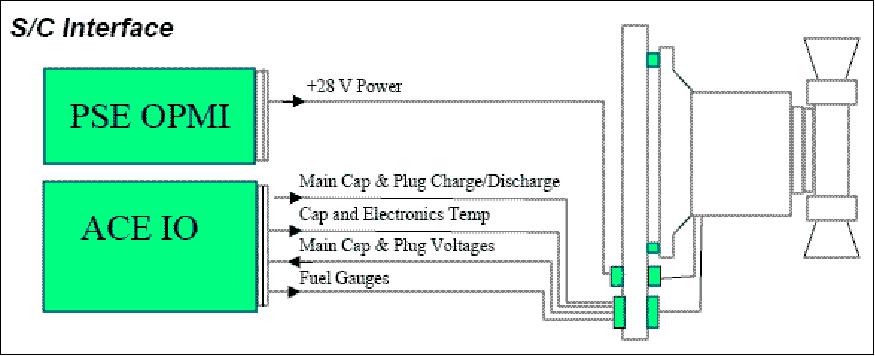
PPT was designed and built at General Dynamics (formerly Primex Aerospace) for NASA/GRC. The system is also referred to as PRS-101 (Plasma Rocket System-101), its model number. The objective is to demonstrate on-orbit electromagnetic propulsion technology and to provide a S/C precision-pointing capability. The EO-1 primary propulsion is provided by the hydrazine system for orbit maintenance and formation flying. The PPT is being used during limited periods of the mission to demonstrate the capability of a PPT system by performing the function of a momentum wheel. When in operation, the pitch axis momentum wheel is being idled and the PPT takes over control of the pitch axis. 34) 35) 36) 37)
The PPT consists of a coiled spring to feed the Teflon propellant, an igniter plug to initiate a small trigger discharge and an energy storage capacitor and electrodes (also: on-board electronics to convert the low voltage from the S/C to appropriate charging voltage for the capacitor, to provide energy to fire spark plugs, and to isolate PPT discharge from the S/C power bus). Plasma is created by the ablation of the Teflon propellant from discharge of the storage capacitor across the electrodes. The plasma is accelerated by the Lorentz force in the induced magnetic field to generate thrust. Impulse levels of 10-1000 µNs are achieved; the specific impulse is 880-1170 m/s; the average power consumption of PPT is between 1-100 W. PPT is used to maintain S/C attitude (fine pitch attitude control pointing requirements while meeting stringent electromagnetic and contamination constraints for the mission).
Type | Rectangular, parallel plate, breech fed propellant |
Trust axis | Two parallel and opposing |
Impulse bit | 90-860 µNs, continuously throttleable |
Specific impulse | 650-1400 s (estimated) |
Total impulse | 460 Ns (estimated) |
Pulse frequency | Single pulse or 1 Hz |
Stored energy | 8.5 - 56 J, throttleable |
Input power | 70 W at 28 V, maximum energy, 1 pps |
Overall efficiency | 8% at maximum energy (estimated) |
PPU efficiency | 81% (estimated) |
Capacitor | 40.1 µF, 2 kV |
Total thruster mass | 4.95 kg |
Fuel mass, fuel | 0.07 kg per side, rectangular cross-section fluorcarbon polymer bars |
A series of fine pitch pointing maneuvers were performed after the end of the primary imaging mission. Flight operations of the EO-1 PPT began on January 4, 2002. As of June 15, 2002, a total of 26.9 hours of operation and almost 97,000 pulses have been logged, including several image acquisitions and continuous control of the pitch attitude of the spacecraft for over 9 hours for 5.5 orbits. This is the first flight demonstration of PPT throttling. Spacecraft pitch attitude was controlled to well within the 30 arcsec requirement during image acquisition and was generally within 10 arcsec. In addition, sensitive tests with images of the dark Earth have detected no evidence of electromagnetic interference from the discharge or light pollution from the plume even though the ALI instrument was known to have very sensitive electronic components. 38) 39)
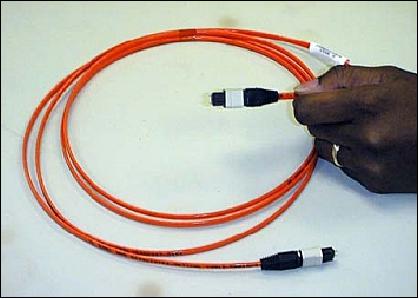
FODB (Fiber Optic Data Bus)
The objective is to demonstrate high aggregate bandwidth data transfer capabilities onboard EO-1 with low mass and low power requirements. FODB was developed as a standard high-speed (Gbit/s) data interface for future spacecraft. It complies with the IEEE P1393 SFODB (Spaceborne Fiber Optic Data Bus) standard. The bus concept is based on a ring topology of 2 to 128 nodes which provides flexibility to meet differing payload requirements. The master node is a Controller Fiber Bus Interface Unit (CFBIU) and up to 127 slaves are implemented with a Fiber Bus Interface Unit (FBIU). The interface between nodes is implemented in fiber optics, it reduces weight and provides for an EMI/EMC problem-free system. 40)
The FODB high data transfer rate and software configurable ATM (Asynchronous Transfer Mode) based protocol provides users extraordinary flexibility with which to design their data handling architectures. The COTS-based 12-channel parallel fiber optic transmitter and receiver pair were developed specifically for parallel FODB through DoD and NASA funding [NASA SBIR (Small Business Innovation Research) contract by Optical Networks, Inc (ONI)].
The FODB on EO-1 is implemented with four nodes. In this configuration, the WARP data system contains the master controller node (CFBIU) and one slave node (FBIU). An external instrument terminal box, mounted on the spacecraft, contains two slave nodes, glue logic, power, and ALI instrument interface connectors. The FODB bus employs an ATM (Asynchronous Transfer Mode) with minimum overhead which simplifies the node interface design. Transfer rates between 200 Mbit/s and 1 Gbit/s are supported by FODB.
AutoCon (Autonomous Control for enhanced formation flying)
NASA/GSFC teamed with a.i.-solutions, Inc. to fly AutoConTM onboard EO-1. The objective is to demonstrate an on-board software package capable of autonomously planning, executing, and calibrating routine spacecraft maneuvers to maintain satellites in their respective constellations and formations. The long-term goal of this technology is to enable many small and inexpensive spacecraft to fly in formation and gather concurrent science data in a "virtual satellite". This "virtual satellite or virtual platform" concept lowers total mission risk, increases science data collection and adds considerable flexibility to future Earth and space science missions. 41) 42) 43)
The AutoConTM technology automated EO-1's maneuver planning and formation control. AutoConTM performs orbit maintenance of single spacecraft or constellations and formations. It can be applied to a variety of orbits ranging from LEO to non-Keplerian trajectories such as libration orbits. EO-1 has as a principal mission requirement to successfully complete paired scene observations with Landsat-7 in order to validate the technologically advanced imagers on EO-1. A paired scene process requires EO-1 to fly over the current groundtrack of Landsat-7 a repeating groundtrack mission, within ±3 km. Also, in order to maintain a safety criterion, the nominal along-track separation is one-minute (450 km), ± 6 s (42.5 km). The six-second tolerance is derived from a ± 3 km groundtrack requirement. maintaining this 3-D separation requirement is referred to as formation flying.
The AutoCon features include an innovative use of fuzzy logic decision making capabilities and natural language to resolve multiple conflicting constraints; scripting environment enables algorithm updates without software changes; flight wrapper interfaces directly with the command and data handling subsystem for input and output; multiple operating modes allow execution control; generic closed-loop formation flying control algorithms applicable to many missions; modular architecture design is flexible enough to control execution of multiple and varying algorithms from several partners.
The EO-1 spacecraft is using a Tensor GPS receiver of Space Systems/Loral (SS/L) for active on-board navigation and attitude control. The flight interface connects directly with the C&DH (Command and Data Handling) system to retrieve all required data, including GPS position information, and to create command loads for computed burn times and durations. Only the objects and methods needed to support EO-1 formation flying are incorporated in the AutoConTM system conserving onboard resources. The AutoConTM flight control system is compatible with the various onboard navigation systems ((i.e. GPS, uploaded ground-based ephemeris, etc). The AutoConTM system onboard EO-1, NASA's first autonomous formation flying mission, demonstrated that autonomous control and formation flying technologies can be implemented.
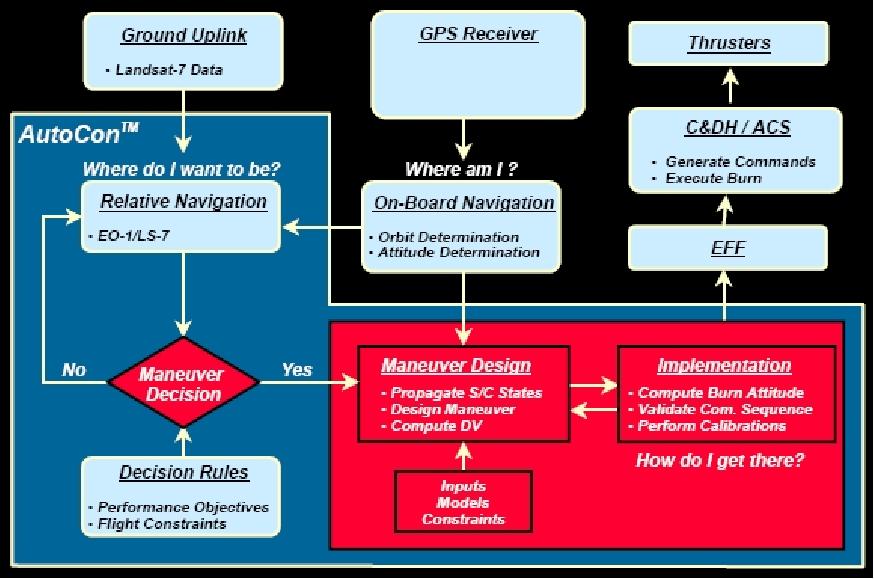
There are two principal components, AutoCon-F (flight) and AutoCon-G (ground), which are used for in-flight operation and ground simulation respectively. This sharing of parts enables use of the same code on the ground and in flight, which reduces complexity and increases reliability.
Formation-keeping control of the EO-1 satellite was successfully handed over to the AutoCon-F software on May 17, 2002, demonstrating for the first time the autonomous formation-flying technology that will enable a host of future multi-spacecraft missions. EO-1 was able to stay within one second of its specified position using onboard algorithms to plan and execute maneuvers, allowing the EO-1 hyperspectral imager to analyze the same image as the Landsat-7 instruments without atmospheric distortion. Although initially planned as a technology experiment, AutoCon-F has performed so reliably that it now functions as the operational software for regularly planned formation control maneuvers.
Mission Overview and Operational Phases
The EO-1 baseline mission (funded by NASA) lasted from launch (Nov. 21, 2000) to the end of 2001, covering mainly instrument performance and instrument data validation and analysis. EO-1 has provided a testbed for refining specifications and expectations in the Landsat Data Continuity Mission (LDCM). As an example, over 5,000 data collection events have been successfully completed, against original success criteria of 1,000 data collection events.
The EO-1 baseline mission was complemented by several campaigns. Examples are:
• Extensive fieldwork, supported by the HyMap airborne spectral imager, was conducted in Australia from early launch throughout the first 120 days in orbit.
• Another extensive field campaign was conducted in Argentina from early January through the third week of February 2001 using the AVIRIS (Airborne Visible/Infrared Imaging Spectrometer) instrument of NASA/JPL.
ALI has undergone extensive on-orbit testing, characterization and calibration. The results indicated superior performance in resolution, image quality, SNR, dynamic range, radiometric accuracy, and repeatability.
All NMP mission objectives were accomplished within 13 months of launch as planned. EO-1 has performed beyond expectations and has demonstrated many new applications for both multispectral and hyperspectral remote sensing of the Earth. In particular, continuous improvements in EO-1 operations have resulted in a six-fold reduction in the cost of EO-1 imagery while achieving a four-fold increase in the data collection rate. These operational improvements are widely applicable to future missions.
EO-1 data became public in December of 2001 at the onset of the EO-1 extended mission (funded by USGS). The NASA/USGS arrangement calls for USGS/EDC to take over level 0 and ALI level 1 data processing at the Sioux Falls SD site. The extended mission opened opportunities for the public to commission EO-1 data collects. Data from both the base mission and extended mission are publicly available from the EROS Data Center (EDC). 45) 46)
Mission Status
• March 30, 2017: The satellite was decommissioned, drained of its energy and became inert. Without enough fuel to keep EO-1 in its current orbit, the mission team has shut down the satellite and will wait for it to return to Earth. When EO-1 does reenter the Earth's atmosphere in about 39 years, it is estimated that all the components will burn up in the atmosphere.
• March 16, 2017: After 17 years in orbit, the EO-1 (Earth Observing-1) satellite's mission comes to an end on March 30, 2017. The satellite will be powered off on that date but will not enter Earth's atmosphere until 2056. 47) Launched on Nov. 21, 2000, EO-1 was designed as a technology validation mission focused on testing cutting-edge satellite and instrument technologies that could be incorporated into future missions.
- EO-1 was originally only supposed to last one year, but after that initial mission, the satellite had no major issues or breakdowns. Commissioned as part of NASA's New Millennium Program, the satellite was part of a series of missions that were developed at a cheaper price tag to test new technologies and concepts that had never been flown before. EO-1 was launched with 13 new technologies, including three new instruments. (Landsat typically looks at the same area once every 16 days.) EO-1 captured scenes such as the ash after the World Trade Center attacks, the flooding in New Orleans after Hurricane Katrina, volcanic eruptions and a large methane leak in southern California.
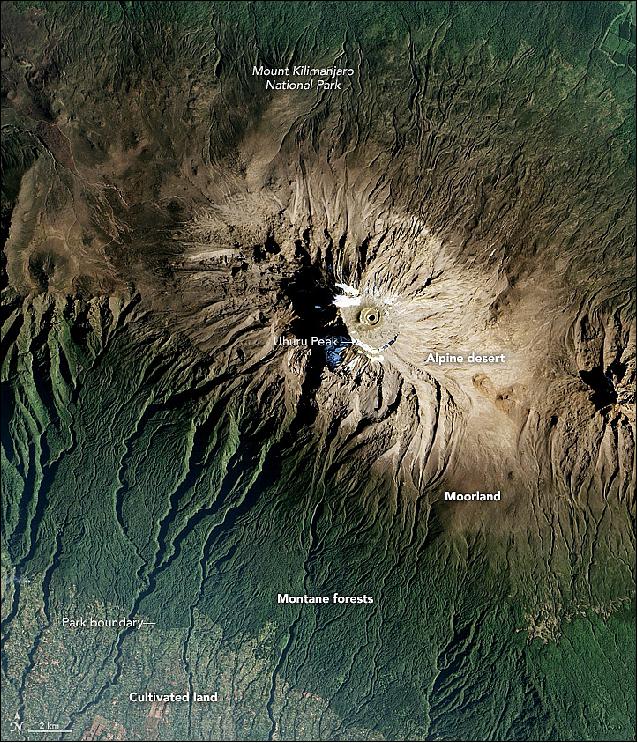
• February 8, 2017: Stories about Mount Kilimanjaro often focus on its height and location. The mountain—the tallest in Africa—is capped with snow and ice, despite sitting at a tropical latitude close to the equator. This volcanic mountain in Tanzania also has been in the news lately because that snowcap is shrinking, and scientists have gone to great lengths to understand why. 48). Below the icy summit there are incredibly diverse vegetation zones. Diverse vegetation zones are visible in this natural-color image (Figure 37), acquired on January 20, 2016, by the Advanced Land Imager (ALI) on NASA's Earth Observing-1 satellite. The mountain rises 5200 meters from the hot, dry savanna, through rainforest and hardy scrublands, to a rocky and icy summit at 5895 meters above sea level.
- The continuous dark-green band around the mountain is forest, which stretches from roughly 1800 to 2800 meters in altitude. Ground-based researchers have found distinct ecosystems and forest types within this green band, but from space, we mostly see it as the lower boundary of Kilimanjaro National Park. When the park was established in 1973, only small corridors within the forest belt were protected. In 2005, the park boundaries were redrawn to include more of the montane forests. As we move up Kilimanjaro, the dark green areas transition to a band of green-brown known as the moorland zone.
• January 6, 2017: After this date, Earth Observing-1 (EO-1) no longer accepted Data Acquisition Requests (DAR) submissions and ended all normal imaging operations. All EO-1; ALI and Hyperion data would cease to be populated in the archive by the end of February 2017, however the historical record of EO-1 data remains available through Earth Explorer (EE) https://earthexplorer.usgs.gov/. 49) The NASA Headquarters Earth Science Division on advice from the 2015 Senior Review panel decided to terminate the EO-1 mission starting October 2016 with spacecraft passivation occurring from November 2016 through February 2017 and full operations were shut down by March 2017.50)
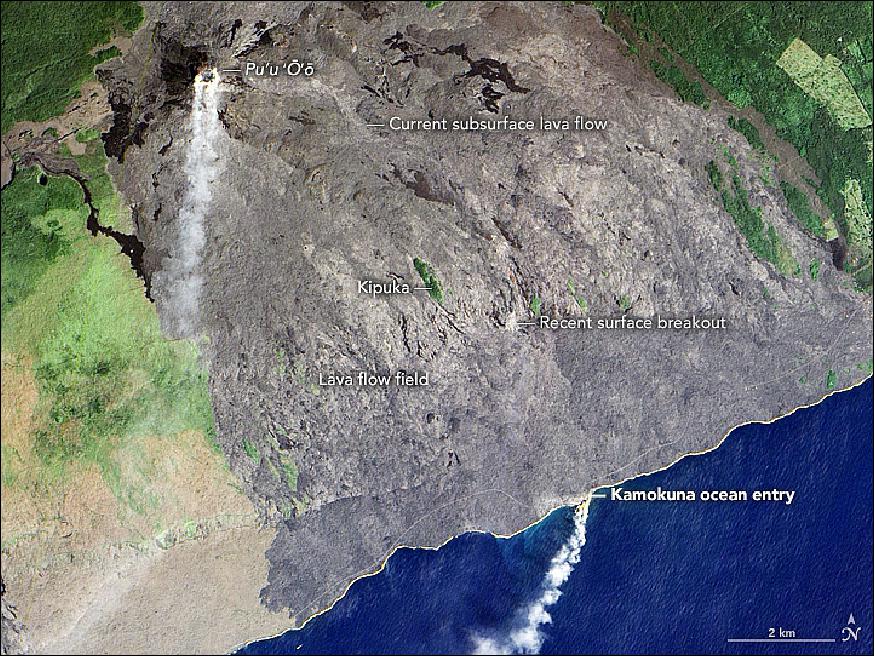
• November 20, 2016: The Pu‘u ‘Ō‘ō eruption of Kilauea, the most active volcano in the Hawaiian island chain, has been going on almost continuously for more than three decades. The location and intensity of lava flows have varied over the years. An individual episode can fluctuate too, sometimes making a glowing appearance at the surface and other times staying hidden from view in sub-surface lava tubes. 51)
- On occasions when the lava enters the ocean, the event makes a spectacular show of island-building. But it's not every day that lava meets the sea. The last time a flow from Kilauea poured into the Pacific was in 2013. The most recent episode (at the time) stemmed from the "61g" flow, which started during an eruption in May 2016, progressed down the flank of the mountain, and has been flowing into the sea since late July. The ALI (Advanced Land Imager) on NASA's Earth Observing-1 satellite acquired this natural-color image of the event on November 13, 2016 (Figure 38).
- The gray areas in the image show nearly the entire flow field, including lava that has accumulated since 1983. The active flow in this image starts at a vent just east of the Pu‘u ‘Ō‘ō crater. Ground-based research suggests that it moves southeast and southward through lava tubes below the surface. The active flow might be hidden from view in this image, but breakouts have sporadically appeared at the surface in the past few months. The signature of a recent surface breakout is the lighter gray area at the base of the pali (cliff). A false-color image from the same day shows that this area was still warmer than usual; so too were the crater and the land where lava enters the sea.
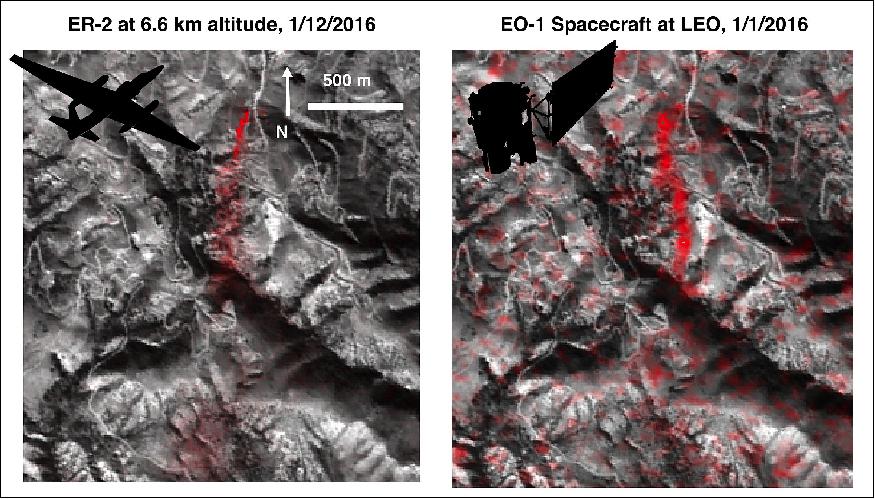
• June 14, 2016: For the first time, an instrument onboard an orbiting spacecraft has measured the methane emissions from a single, specific leaking facility on Earth's surface. The observation by the Hyperion spectrometer on NASA's EO-1 (Earth Observing-1) is an important breakthrough in our ability to eventually measure and monitor emissions of this potent greenhouse gas from space. 52) In a new paper accepted for publication in the journal Geophysical Research Letters, a research team with scientist David R. Thompson of NASA's Jet Propulsion Laboratory, Pasadena, California, detailed the observation, which occurred over Aliso Canyon, near Porter Ranch, California. The Hyperion instrument successfully detected the methane leak on three separate overpasses during the winter of 2015-16. The research was part of an investigation of the large accidental Aliso Canyon methane release last fall and winter. 53)
- The orbital observations from Hyperion were consistent with airborne measurements made by NASA's AVIRIS (Airborne/Infrared Imaging Spectrometer) imager flying onboard a NASA ER-2 aircraft. Other institutions participating in the study include Caltech, Pasadena, California; Helmholtz Center Potsdam, GFZ German Research Center for Geosciences, Potsdam, Germany; and NASA's Goddard Space Flight Center, Greenbelt, Maryland.
• February 2016: "The Earth Observer" of NASA provided a feature article on EO-1, recounting the mission's many achievements during its long history (15 years) of operations so far. EO-1 was originally a technology testbed satellite, built quickly and inexpensively. EO-1 is finally heading for the end of its mission, which is projected for October 2016. While the platform and its instruments are operating well, fuel reserves have been exhausted and the satellite has lost its orbital maintenance ability. 54). Since EO-1 is a pointable satellite and not taking continuous images of the ground, the satellite has become a favorite for rapid-delivery of disaster images. In fact, EO-1 can usually observe disaster events one-to-two days earlier than the ASTER (Advanced Spaceborne Thermal Emission and Reflection Radiometer) instrument onboard NASA's Terra satellite, and Landsat-8, and can provide a second observation of the site within three-to-six days.
- With ALI's success in producing Landsat-like images with less weight and power usage than Landsat-7 required, the Landsat-8 team used ALI as the baseline design for the new Landsat instrument, the Operational Land Imager (OLI). By evaluating the usefulness and limitations of ALI and Hyperion and the EO-1 acquisition strategy, the mission continues to contribute to future Earth-science mission needs (e.g., desired spectral and spatial resolution, SNR, frequency, and time and geometry of acquisition). Hyperion has demonstrated the value of imaging spectroscopy in many science applications, including mining, geology, forestry, agriculture, environmental management, invasive species identification, desertification, land-use, volcano studies, natural and anthropogenic hazards, and disaster assessments. Staying in formation behind Landsat-7 required EO-1 to perform periodic inclination maneuvers using the onboard thrusters. The early overpass time has not impeded EO-1's ability to collect useful data. (Ref. 54).
• January 20, 2016: In early 2016, volcanic activity at Copahue—a stratovolcano in the Andes Mountains, straddling Chile and Argentina—continued. Volcanic plumes have periodically streamed from the volcano and several explosive events have occurred it became restless again in 2012. 55)
- Chile's National Geology and Mining Service (SERNAGEOMIN) reported that monitoring stations near the volcano had recorded a series of earthquakes on January 14, 2016, associated with the fracturing of rock underground. The emissions and seismicity prompted SERNAGEOMIN to put the volcano at alert level yellow. The group recommends that people stay at least 1.5 km away from the crater.

• December 2015: The EO-1 mission reached an impressive milestone in 2015, celebrating its fifteenth anniversary on November 21. Launched during the era of "faster, better, cheaper" as part of NASA's New Millennium Program, it exceeded its original one-year mission and has served as an on-orbit testbed for new technologies, imaging techniques, and targeted data acquisitions. 56) The Hyperion imaging spectrometer (aka hyperspectral imager) measures more than 200 adjacent wavelength bands, providing more complete — and spectrally continuous — coverage than multispectral imagers. Hyperion has given the science community invaluable experience working with complex hyperspectral data that are being incorporated into the design of future instruments, such as the imaging spectrometer on NASA's Earth Science Decadal Survey HyspIRI (Hyperspectral Infrared Imager) mission concept. Perhaps the innovation that has been most essential to EO-1's longevity beyond the initial technology demonstration phase was its onboard computer, which provided excess onboard computing capability that allowed the EO-1 team to attempt activities not initially planned as part of the mission.
• June 22, 2015: In the spring of 2015, the EO-1 project requested an extension of the mission based on the outlines in Table 9. — However, the Senior Review Panel found that the mission should be decommissioned on 30 September 2016. There are three major reasons for this finding: 57)
1) As noted in the 2013 Senior Review Report, the early MLT (Mean Local Time) would greatly limit the usefulness of the data for scientific research and application support.
2) There is only limited utility in extending the EO-1 mission for high latitude observations.
3) The mission team did not provide adequate information to support their claims of the potential scientific benefit and users of the proposed Lunar Lab.
- A condition of continuing the EO-1 mission into FY16 is that a detailed review be conducted of the scientific usefulness of EO-1 data to specific users based on the change in illumination conditions that will result from changes in MLT during 30 September 2015 - 30 September 2016. In addition, the mission team must provide documentation that clearly indicates how to access and use archived data to a broader community. These actions must be completed before the beginning of CY2016. EO-1 mission extension reasons 58)
• March 23, 2015: The EO-1 project requested an extension of the EO-1 mission because in spite of orbital changes, EO-1 provides unique and valuable data to the science & applications communities and supports SLI (Sustainable Land Imaging), HyspIRI, & future mission development. Although EO-1 is slowly drifting to earlier MLT equatorial crossing times, the ALI SNR (Signal-to-Noise Ratio) remains superior to that of all Landsat instruments prior to the OLI instrument on Landsat 8.
- EO-1 is a highly maneuverable testbed asset which can be (and has been) assigned a variety of high priority tasks of critical interest to the NASA Earth Science Division. Hyperion is the only spaceborne satellite imaging spectrometer (IS), uniquely providing a 14.5 year archive. Hyperion data continue to be used as a source for understanding how spectroradiometric properties relate to the physical state (and disturbances) of the Earth's surface. Hyperion paves the way for future IS missions, providing quantitative assessments of terrestrial and aquatic ecosystems.
- Technology Pathfinder for technology such as: Onboard autonomy software (Autonomous ScienceCraft Experiment –JPL); Onboard intelligent diagnostic software (Livingstone –Ames); IP for space (Delay Tolerant Network –GSFC); Onboard cloud detection (Lincoln Lab –GSFC & JPL); SensorWeb/GeoSocial API for ease of tasking satellites, discovery/delivery of satellite data products (GSFC, JPL, International Disaster community); Intelligent Payload Module (IPM) for low latency HyspIRI products (GSFC).
• February 2015: The EO-1 spacecraft and its payload are operational at that time in the extended mission phase. In Feb. 2011, EO-1 ran out of fuel and began precession from 10:00 A.M. overpass toward earlier times. The spacecraft is scheduled to be retired in October 2015 (Ref. 59) The expected change in solar incoming visible radiation at the local equatorial crossing time, as estimated with the SZA (Solar Zenith Angle), for the years between 2009 and 2016 at 4 latitudes in the northern hemisphere: equator, 20ºN, 40ºN, and 60ºN. A typical trend for the years (2001-2012) before the depletion of onboard fuel, is depicted on the left end. With each year, the lowest summer and highest winter SZAs increase. A subjective threshold to end the EO-1 mission is set for Sept. 30, 2015, when the predicted equatorial overpass time becomes earlier than 8:45 A.M.
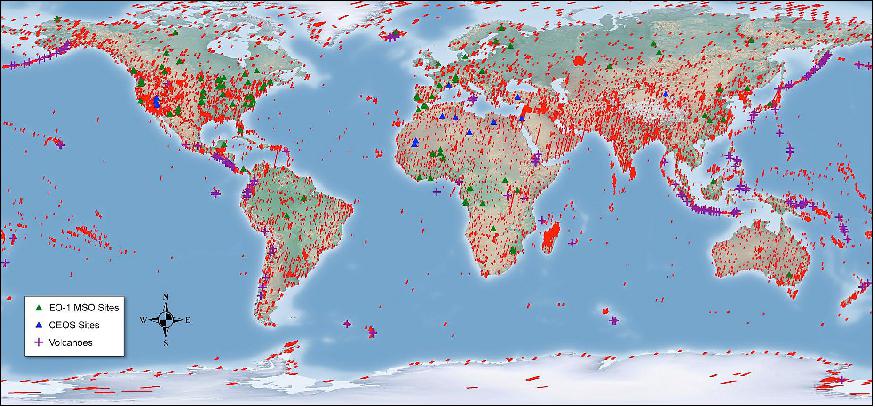
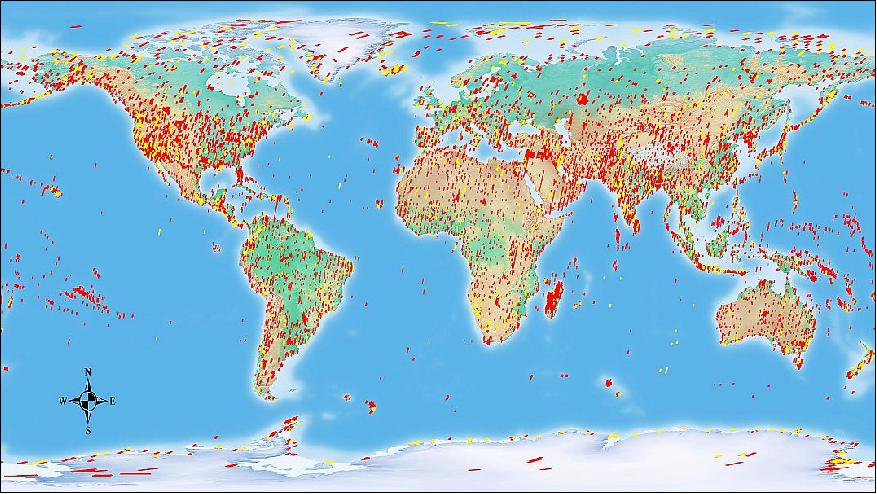
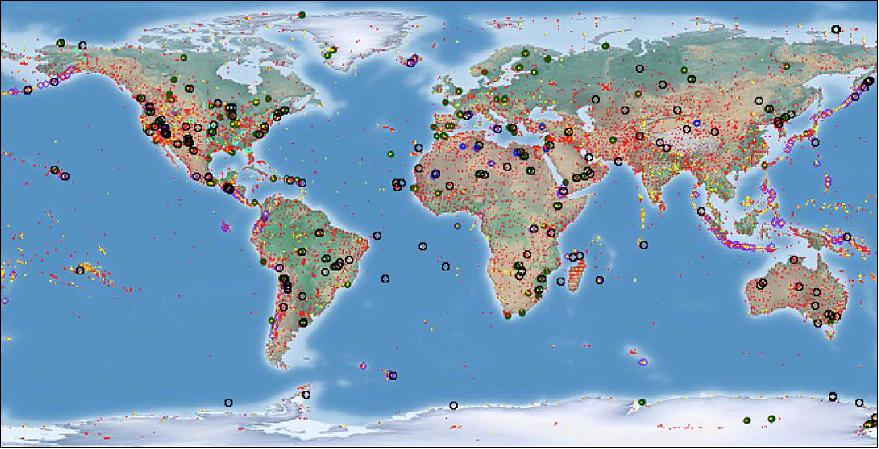
• July 2014: EO-1 is a technology demonstration mission that was launched in November 2000, and by July 2014 had successfully completed almost 14 years of high spatial resolution (30 m) imaging operations from a low Earth orbit. EO-1 has two unique instruments, the Hyperion and ALI (Advanced Land Imager). Both instruments have served as prototypes for NASA's newer satellite missions, including the recently launched Landsat-8 (in February 2013) and the future Hyperspectral Infrared Imager (HyspIRI).59) EO-1 observations in 13 years (2001 through 2014) total over 75,000 for each instrument. Locations of collections made in 2011-2012 (1300+ per instrument) are shown with yellow dots (Figure 43), whereas those collected during the first 10 years are shown with red dots. In addition, the locations of 4 repetitively observed sites are highlighted: CEOS calibration sites (blue circles), MSO (dark green circles), NEON (cyan circles) and Volcanoes (purple diamonds). Locations having >10 collections are outlined with black circles.
• May 9, 2014: A piece of Chinese space debris had a chance of impacting the EO-1 satellite, so a 10 second thruster burn was attempted (without knowing if it would work). The thrusters fired correctly, shifting EO-1 into a slightly higher orbit, and avoiding the collision.
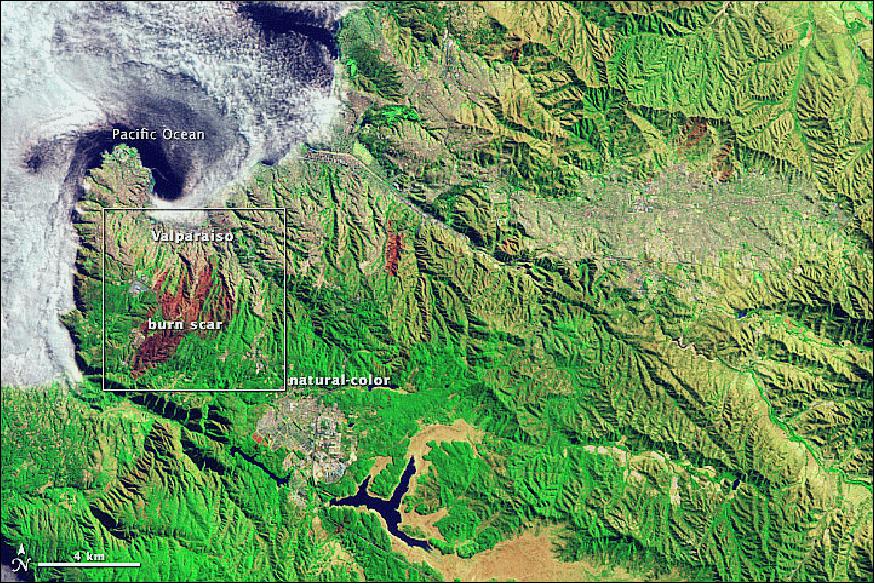
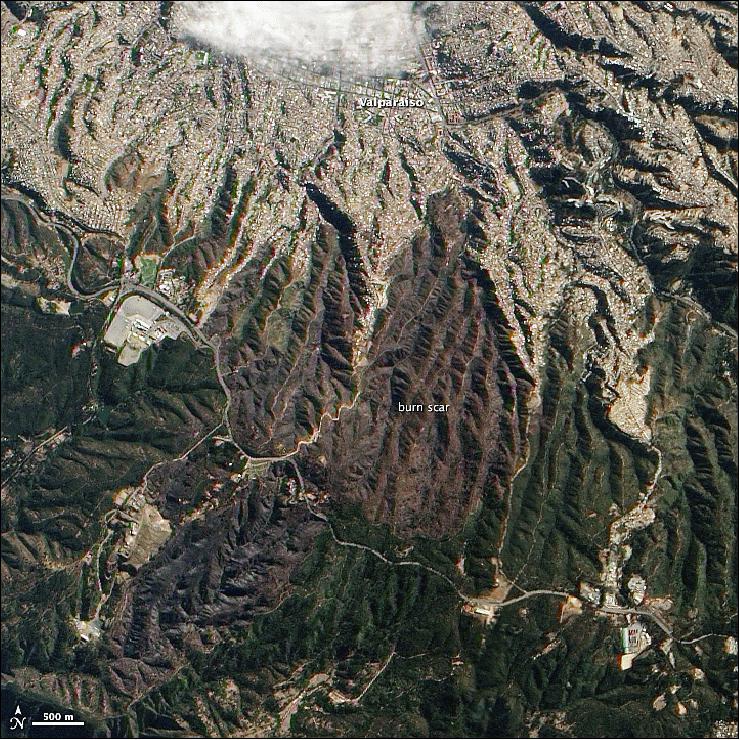
• April/May 2014: The city of Valparaiso rises from Chile's Pacific coastal plain along steep mountains that surround the port like an amphitheater. The setting that makes it picturesque also put the city at risk in April 2014. On April 12, 2014, a wildfire broke out in the hills south of the city and quickly moved into densely packed neighborhoods of wooden houses. Steep, narrow roads—or no roads at all—challenged firefighters trying to control the fire. By the time the fire was extinguished, 3,309 homes had been destroyed and 15 people had died. 60) Figure 44 is a false-color large-area image that incorporates infrared light to make a clear distinction between newly burned land and the surrounding landscape. The fire scar is dark red; plant-covered land is bright green; sparsely vegetated land is tan; and the city is gray and purple. The fire burned 965 hectares, extending down several hills and ravines toward the center of the city.
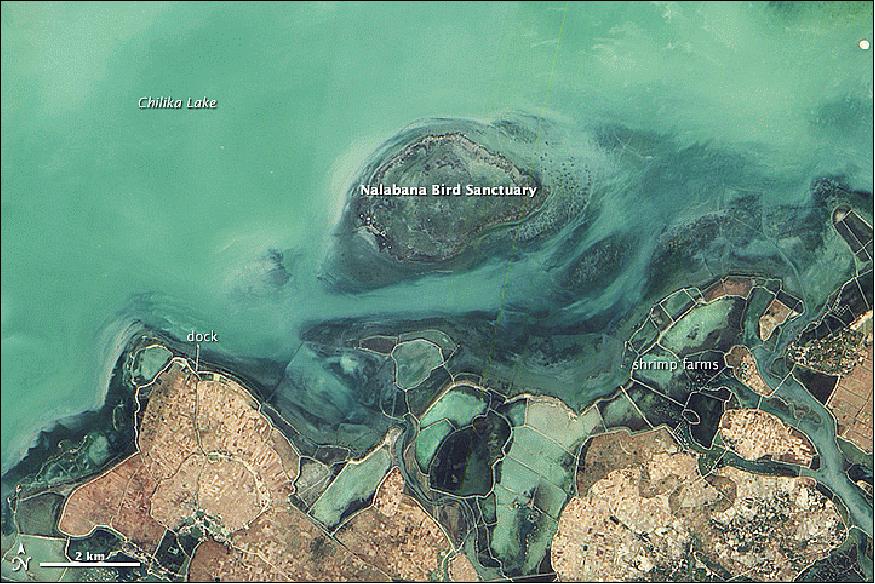
• March 29, 2014: Chilika Lake is the largest lagoon in India and one of the largest in the world. The interplay between fresh water—draining into the shallow lake from rivers to the north and west—and salty tidal water—encroaching from the Bay of Bengal to the south—gives Chilika's waters a brackish quality, with salinity varying significantly throughout the lake. These variations open up a range of ecological niches and promote a rich diversity of species. 61)
- Located in southeastern India, Chilika is best known as a mecca for birds, which are attracted by the hundreds of species of fish and other aquatic life. During the peak migratory season, the lake hosts more than one million birds from more than 200 species. About half of the birds are migratory species that arrive from distant parts of Asia, including the Caspian Sea, Lake Baikal, and Siberia. In 1987, Indian authorities declared Nalabana Island a bird sanctuary. During and just after the rainy season, lake levels increase enough to completely inundate the low-lying island. During other seasons, the falling water levels expose extensive mudflats that are an ideal habit for wading birds such as flamingoes, herons, spoonbills, storks, and pelicans.
- While parts of the island are visible, much of it was underwater. The brown areas in the lower part of the image are farms and villages. A dock, used for fishing boats and tourist ferries, is also visible. - To the south of Nalabana, a series of pools are arrayed along the coast for shrimp farming. The number of shrimp farms around Chilika has increased dramatically in recent decades. One satellite-based study found that the percentage of land being used for shrimp farming had increased from about 4 percent in 1999 to 13 percent in 2013. The expansion of aquaculture has created conflicts with traditional fishing communities, who claim that shrimp ponds disrupt the natural flow and ecosystem of the lake.
• Mid 2014: The EO-1 mission is operational in 2014, in its 14th year on orbit. The EO-1 mission was extended for the next two years as baselined at the very low requested support level and then closed out in FY16-17 (Ref. 65).
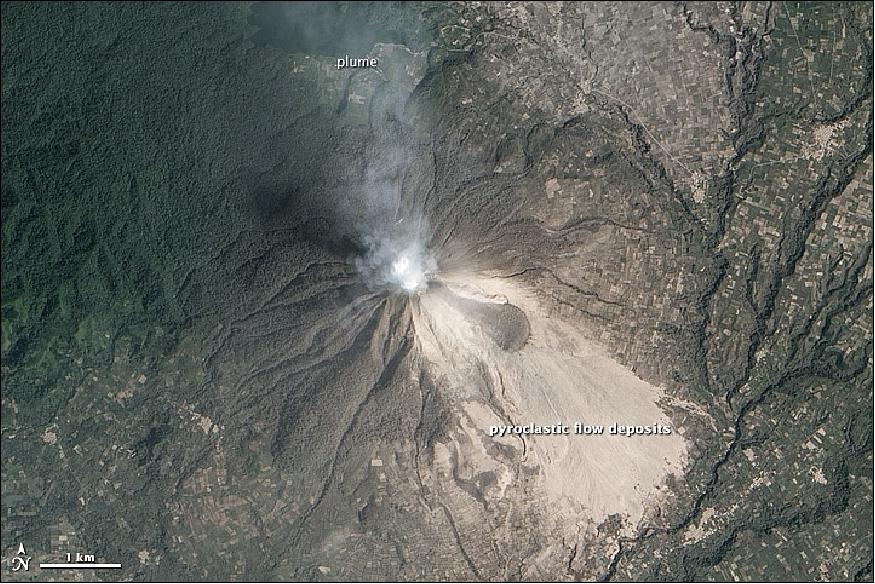
• February 1, 2014: Frequent collapses from the unstable lava dome near Sinabung's summit created pyroclastic flows that have swept at least 4.5 km down the slopes so far. The flow deposits are visible southeast of Sinabung's summit and appear light gray. The eruption has coated much of the surrounding landscape with ash, causing green dark green forests to appear tan. On February 1, 2014, the volcano killed 15 people when hot debris engulfed the village of Sukameriah. 62)
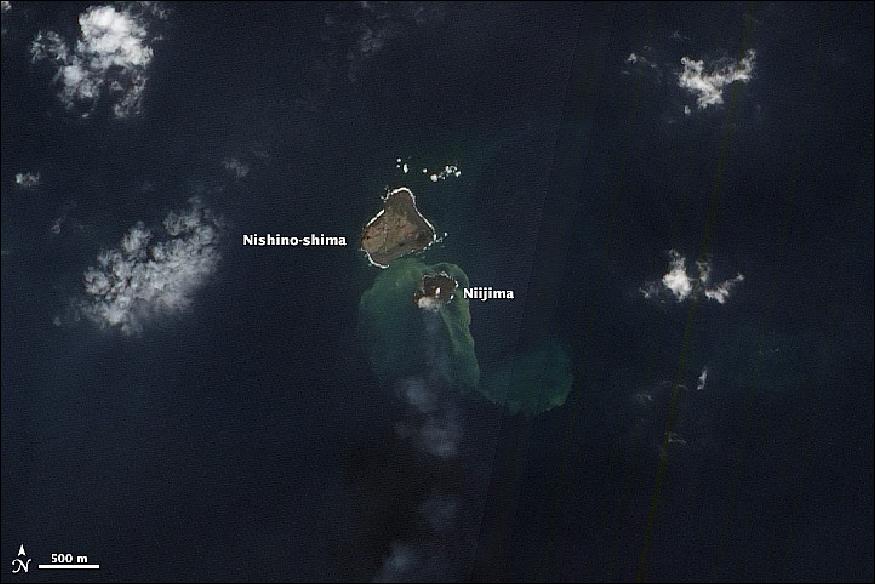
• December 2013: Volcanic activity along the western edge of the Pacific "Ring of Fire" gave rise to a tiny island in late November 2013 (Figure 48). Located in the Ogasawara Islands, part of the Volcano Islands arc, the new islet sits about 1,000 km south of Tokyo in waters considered part of Japanese territory. 63) The new island, named Niijima, rose up out of the sea during a volcanic eruption first reported on November 20, 2013. Niijima sits about 500 m from Nishino-shima, another volcanic island that last erupted and expanded in 1973–74. The two islands are located at approximately 27°14' North latitude and 140°52' East longitude, about 130 km from the nearest inhabited island.
- In the first few days after the eruption, scientists speculated that Niijima might not last. New islets like those recently formed off the coast of Pakistan (Figure 49) and in the Red Sea can naturally sink back below the water line as they are eroded by wave action that carries away loose sediment, mud, and tephra (volcanic rock fragments). Some subsidence can also occur from the simple weight of gravity and the cooling of the hot rock. But according to news reports, Niijima is still erupting and growing. Scientists from the Japan Meteorological Agency (JMA) think the island is large enough to survive for at least several years, if not permanently. By early December, Niijima had grown to 56,000 m2 (5.6 hectar), about three times its initial size. It stands 20 to 25 m above the sea level (Ref. 63)
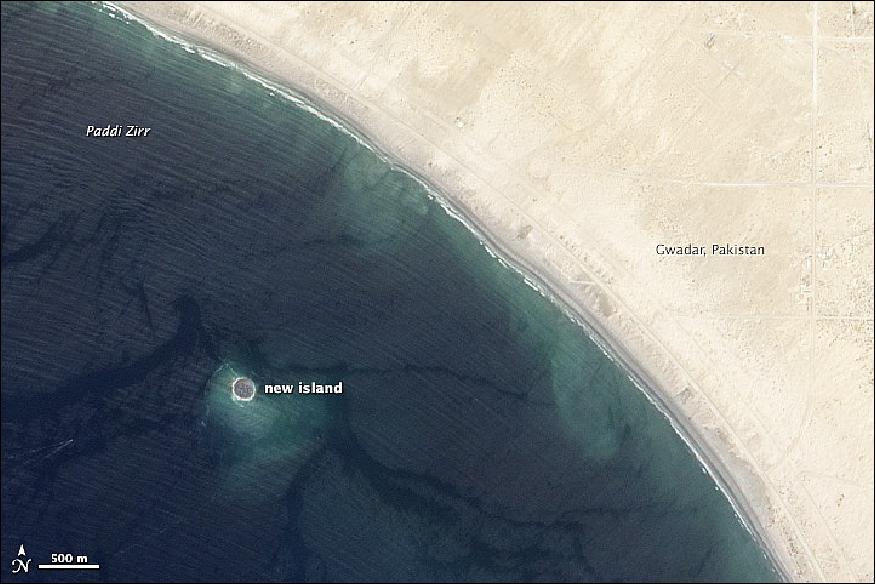
• September 26, 2013, ALI (Advanced Land Imager) on NASA's EO-1 (Earth Observing-1) satellite captured the image of that new island, which sits roughly 1 km offshore. Likely a "mud volcano," the island rose from the seafloor near Gwadar on September 24, shortly after the earthquake struck about 380 km inland. 64)
• September 24, 2013: A major strike-slip earthquake rattled western Pakistan, killing at least 350 people and leaving more than 100,000 homeless. The 7.7 magnitude quake struck the Baluchistan province of northwestern Pakistan. Amidst the destruction, a new island was created offshore in the Paddi Zirr (West Bay) near Gwadar, Pakistan. In the satellite image, lighter shades of green and tan in the water reveal shallow seafloor or suspended sediment. The water depth around the new island is roughly 15 - 20 m, according to marine geologist Asif Inam of Pakistan's National Institute of Oceanography. The image from ALI is also precise enough to show the parallel ripples of waves marching toward the shore.
• June 2013: The 2013 Senior Review evaluated 13 NASA satellite missions in extended operations: ACRIMSAT, Aqua, Aura, CALIPSO, CloudSat, EO-1, GRACE, Jason-1, OSTM, QuikSCAT, SORCE, Terra, and TRMM. The Senior Review was tasked with reviewing proposals submitted by each mission team for extended operations and funding for FY14-FY15, and FY16-FY17. Since CloudSat, GRACE, QuikSCAT and SORCE have shown evidence of aging issues, they received baseline funding for extension through 2015. 65) The two instruments onboard EO-1, the Advanced Land Imager (ALI) and Hyperion, are high spatial resolution sensors capable of imaging any spot on earth up to 5 times every 16 days (plus 5 nighttime images over the same period).
- The EO-1 mission is central to NASA's strategic Earth Science plan: to advance Earth system science related to climate and environmental change, and to characterize, understand, and predict how the Earth is changing, with consequences for life on Earth. Despite the small team size (<10 part-time) in the Mission Science Office and Missions Operations, the EO-1 mission supports an impressive array of activities. Over the past 2 years, significant progress has been made in improving communication with the broader community regarding how data should be tasked and acquired, and improving the Level 2 products, as well as on other fronts. The EO-1 mission was extended for the next two years as baselined at the very low requested support level and then closed out in FY16-17 (Ref. 65).
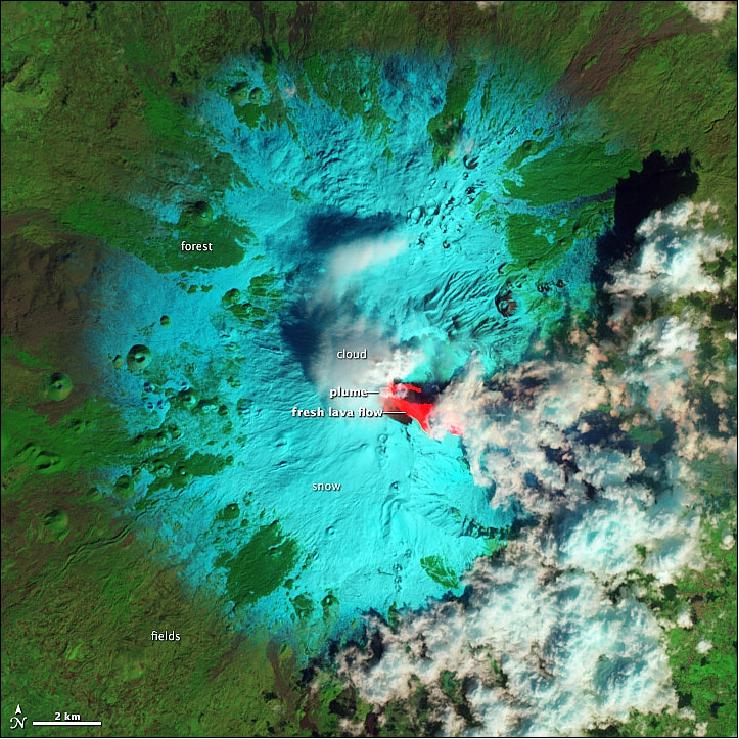
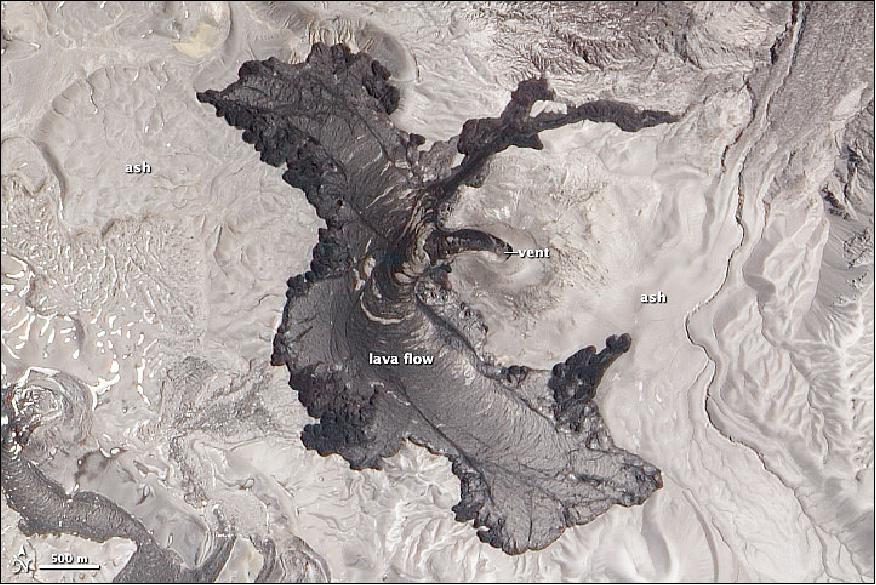
• May 2013: IEEE JSTARS (Journal of Selected Topics in Applied Earth Observations and Remote Sensing) EO-1 Special Issue published, containing 20 papers 66) The Tolbachik Volcano is not a single peak, but a complex of volcanic features superimposed on one another. The varied shapes result from differences in the chemistry, gas content, and temperature of lava. Over time the composition of magma feeding a volcano may change, generating volcanoes with complex shapes. The EO-1 mission is operational in 2013, in its 13th year on orbit. 67)The eruption that started in late 2012, is on Tolbachinsky Dol, a lava plateau marked by small volcanic cones that formed during earlier eruptions. These cones stretch southwest from the summit of Plosky Tolbachick, a gently sloping shield volcano formed from layers of fluid lavas. Just to the west of Plosky Tolbachik lies Ostry Tolbachik, a steep-sided stratovolcano composed of layers of thick lava, ash, tephra, and other volcanic debris.
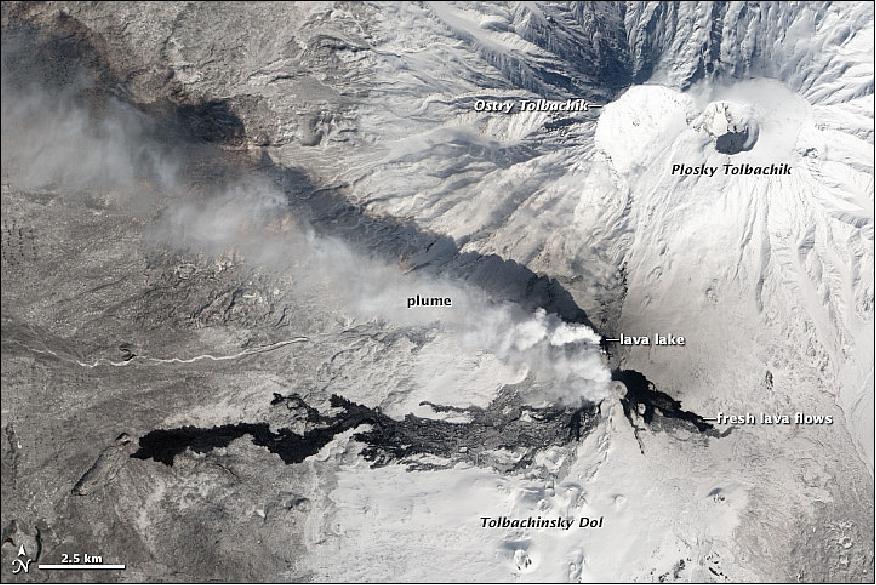
- The false-color image combines shortwave infrared, near-infrared, and green light in the red, green, and blue channels of an RGB picture. In the image, fresh lava is bright red, as the hot surface emits enough energy to saturate the instrument's shortwave infrared detectors but is dark in near-infrared and green light. Snow is blue-green because it absorbs shortwave infrared light, but reflects near-infrared and green light.
• January 2013: From June 2011 until April 2012, Puyehue Cordón Caulle, a Chilean volcano, erupted a massive obsidian lava flow. The flow covered roughly 16 km2 of land in lava about 30 m thick. This natural-color satellite image shows the flow on January 13, 2013. It was collected by ALI (Advanced Land Imager) on EO-1(Earth Observing-1). The dark gray lava stands out against the light gray ash and lava bombs that cover surrounding areas. 69) A team of geologists visiting Puyehue in January 2013 discovered that the lava was still in motion even though the eruption had stopped. Unlike a crystalline rock, obsidian is not completely rigid: it can flow, even when solid. The higher the temperature, the faster a glass will deform, especially near its melting point. The hot interior of the lava flow, insulated by a shell of solidified rock, allowed it to continue to ooze downhill (Ref. 69).
• November 21, 2011: The EO-1 mission is operational in 2012. On November. 21, 2011, EO-1 celebrated its eleventh anniversary on orbit. Since 2009, EO-1 has expanded its science role in disaster monitoring by taking advantage of its platform pointing capability, SensorWeb network, and the ability for user-level tasking. ALI provides NASA with the capacity to gap-fill between Landsat-7 and LDCM (Landsat-8), gap-fill for ASTER SWIR bands, and provide spaceborne prototyping for HyspIRI. - All components of EO-1 are predicted to function through 2015, although the orbit degradation will shift the equatorial crossing-time earlier by one hour.
• June 2011, the NASA Earth Science Senior Review recommended an extension of the EO-1 mission up to 2013 as a baseline and a further baseline to 2015. 70)
• June 24, 2011: Detailed Views of Erupting Nabro Volcano in Eritrea taken by ALI (Advanced Land Imager). The Nabro volcano has been erupting since June 12, 2011. It sits in an isolated region on the border between Eritrea and Ethiopia and satellite remote sensing is currently the only reliable way to monitor the ongoing eruption. 71). Since it began erupting on June 12, 2011, emissions from Eritrea's Nabro Volcano have drifted over much of East Africa and the Middle East. Ash has displaced residents living near the volcano and disrupted flights in the region. Despite the volcano's widespread effects, little is known about the eruption. Nabro is located in an isolated region along the border between Eritrea and Ethiopia, and few English-language reports have been published. Satellite remote sensing is currently the only reliable way to monitor the ongoing eruption.
- The bright red portions of the false-color image (Figure 53) indicate hot surfaces. Hot volcanic ash glows above the vent, located in the center of Nabro's caldera. To the west of the vent, portions of an active lava flow (particularly the front of the flow) are also hot. The speckled pattern on upstream portions of the flow is likely due to the cool, hardened crust splitting and exposing fluid lava as the flow advances. The bulbous blue-white cloud near the vent is likely composed largely of escaping water vapor that condensed as the plume rose and cooled. The whispy, cyan clouds above the lava flow are evidence of degassing from the lava.
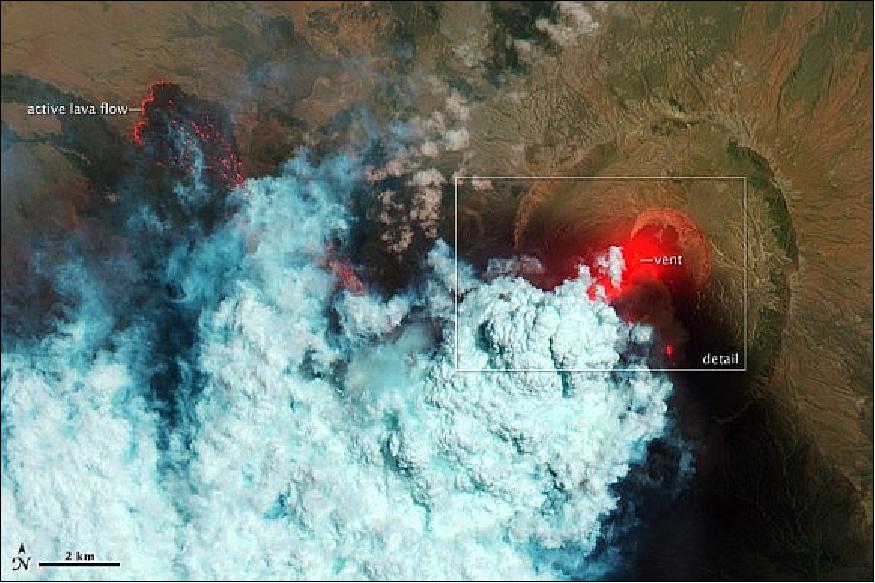
- The natural-color image (Figure 54) shows a close-up view of the volcanic plume and eruption site. A dark ash plume rises directly above the vent, and a short, inactive (cool) lava flow partially fills the crater to the north. A gas plume, rich in water and sulfur dioxide (which contributes a blue tint to the edges of the plume) obscures the upper reaches of the active lava flow. Black ash covers the landscape south and west of Nabro.
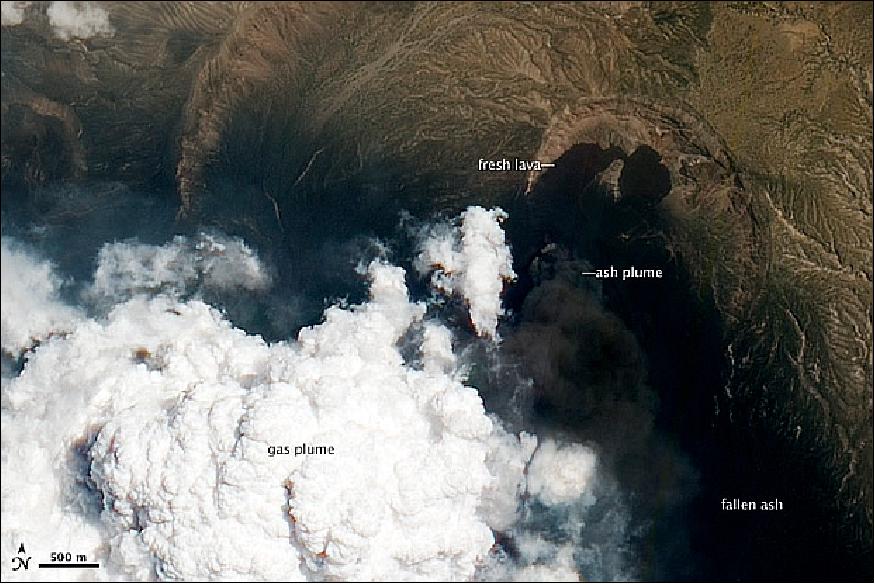
• March 18, 2011: A swath of agricultural fields lies between the Japanese city of Sendai and Sendai Bay, and the area was one of the hardest hit by the tsunami on March 11, 2011. The ALI (Advanced Land Imager) on NASA's EO-1 (Earth Observing-1) satellite captured this natural-color image of the area on March 18, 2011. 72). One week after the magnitude 9.0 earthquake and resulting tsunami, the fields nearest the ocean were still covered with standing water. It is possible that some areas could remain that way, as the ground level sank along the east coast of Japan during the earthquake. The same tectonic forces that lifted up the seafloor to create the tsunami also caused land to subside on the mainland. Liquefaction of soil and sediments may also have caused settling.

• February 14, 2011. The EO-1 spacecraft and its payload are operating nominally in 2011. The image (Figure 57) was acquired on Feb. 14, 2011. Ostrov Shikotan is a volcanic island at the southern end of the Kuril chain. At about 43º North—more than halfway to the Equator—Shikotan lies along the extreme southern edge of winter sea ice in the Northern Hemisphere. The island is surrounded by sea ice — swirling shapes of ghostly blue - gray. Although sea ice often forms around Shikotan, the extent varies widely from year to year, and even day to day.
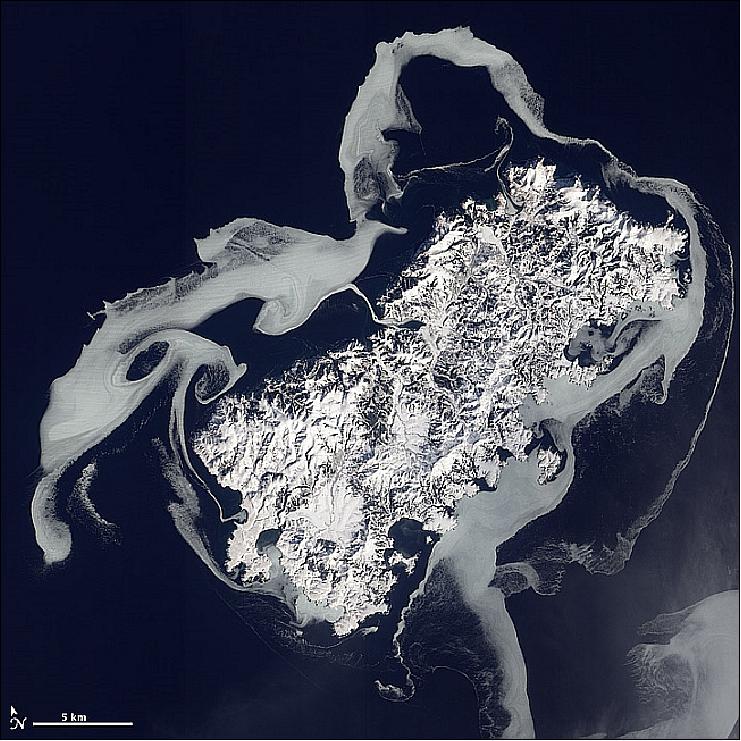
• November 21, 2010: Scheduled to fly for a year, designed to last a year and a half, EO-1 celebrated its tenth anniversary During its decade in space, the satellite has accomplished far more than anyone dreamed of. 74)The EO-1 at the time was the only satellite that simultaneously acquired high spatial resolution (30 m) data for terrestrial and aquatic monitoring with two unique spectral instruments - the Hyperion and the ALI. It also has a 10 m pan-sharpening capability. As the only civilian satellite sensor now acquiring continuous spectrum hyperspectral imagery, Hyperion is greatly assisting investigators with the identification of ecosystem components and enabling the separation of various vegetated land covers. 75).
- Because of this range of capabilities, the Hyperion has become the primary data source for numerous investigations which have demonstrated the utility of imaging spectroscopy for a broad range of ecological and geophysical studies around the world. In addition, EO-1 has provided sensor information to support characterization for a number of instruments on existing orbital platforms (e.g., MODIS on Terra and Aqua, Landsat-5 & -7), and on future platforms (e.g., LDCM for Landsat-8) (Ref. 75).
• 2010: The spacecraft and its payload were operating nominally in 2010. NASA granted a mission extension to the end of 2011. In 2009 the Senior Review Panel recommended to NASA that an extended mission status will lead to providing important data for the LDCM (Landsat Data Continuity Mission), national operations in response to critical events, preparation for Decadal Survey mission(s), and science questions articulated in the NASA Science Plan. 76) 77)
- It now collects data for special event imagery at high spectral and spatial resolution, contributes to long-term data sets and interoperability and contributes images and new techniques for coordinated synergistic data collections, especially for natural disasters and coastal monitoring efforts. The ALI sensor has proven useful as a first look resource to assist in assessing disasters and events of a critical nature. This has been justified through the use of several thousands of images processed for disaster/weather monitoring and in the development of automated first response systems which automate data collection such as the innovative SensorWeb 2.0 development.
• 2009: The EO-1 spacecraft was operational - with the ALI and Hyperion instruments fully functional as of 2009 - more than seven years after its original retirement date. NASA/HQ has approved funding for operational services for the years 2008-2009. Toward the end of year 2009, the EO-1 mission will be re-evaluated and considered for an additional two years of operational funding. Aside from funding, it is projected that it would be necessary to terminate the mission at the end of year 2011 due to the onboard propellant having been exhausted.
• Late 2005: The EO-1 satellite orbit was changed and taken out of the constellation flying with Landsat 7. The new orbit parameters of EO-1 are: inclination = 98.2º, apogee = 710 km, perigee = 694 km. SMA (Semi Major Axis) = 7063 km, MLT = 9.996. The remaining fuel is being used to perform periodic inclination burns to achieve and maintain a descending node mean local time of slightly above 10:00 hours. 78)
• Early 2005, ASE is the primary mission planning and control system onboard EO-1. The use of automated planning onboard EO-1 has enabled a new system-of-systems capability - thus creating a sensor-web.
• January 2004: The software package ASE (Autonomous Sciencecraft Experiment) has been flying on EO-1 since January 2004 (some initial onboard testing was conducted in late 2003). ASE started as a technology experiment. The technology was declared fully validated in May 2004 after all 20 onboard autonomy experiments were fully tested. The overall system performed as expected and was considered a success. 79)
• May 7, 2004: the EO-1 satellite had first demonstrated its abilities by detecting and self-directing observations of an eruption of remote Erebus Volcano in Antarctica and delivering data to scientists within hours. EO-1 detected heat emission from the Erebus Volcano lava lake, alerted scientists on the ground, and automatically rescheduled the satellite to obtain more observations. After the technology validation, ASE has been running on EO-1 in support of over 4000 autonomous data acquisitions. In addition, over 400 closed-loop executions have been run where ASE autonomously analyzed science data onboard and triggered subsequent observations.
Extended Mission Phases of EO-1
Following the first year of operations (having more than achieved its original technology validation goals), the EO-1 mission entered its extended mission phase, flying in an on-orbit testbed mode, in which additional validations were being performed which centered on the theme of enabling Sensor Webs. The EO-1 Sensor Web Enablement (SWE) experiment is implemented on OGC (Open Geospatial Consortium) architecture standards. 80) 81) 82) 83)
SWE is divided into a number of components, each of which contains models, services or XML encodings of various aspects of the Sensor Web. For example, the SensorML (Sensor Model Language) contains models and encodings for sensors, and the Observations and Measurements component contains the same for sensor observations and measurements.
ASE (Autonomous Sciencecraft Experiment)
In the fall of 2003, the ASE software package of JPL and GSFC was uplinked and installed on EO-1 (as a testbed). [Note: Initially, the ASE package was planned to be flown on the ST-6 (Space Technology-6) mission of NASA, but this was changed when a flight opportunity on EO-1 arose]. The ASE onboard flight software package architecture includes three autonomy software components: 84) 85)
1) CASPER (Continuous Activity Scheduling Planning Execution and Replanning). The CASPER software replan activities, including downlink, based on science observations in the previous orbit cycles.
2) SCL (Spacecraft Command Language) package to enable event-driven processing and low-level autonomy. SCL acts as a robust middleware execution engine.
3) Onboard science processing algorithms that analyze the image data to detect trigger conditions such as science events, "interesting" features, changes relative to previous observations, and cloud detection for onboard image masking
There is also a complementary ground piece of software called ASPEN (Automated Scheduling and Planning Environment), which works collaboratively with CASPER to process triggers and imaging requests for use by CASPER. In particular, triggers and requests are automatically sorted and prioritized and then converted into a list of high-level goals that can be worked on by CASPER.
The overall ASE objective is to demonstrate several integrated autonomy technologies to enable autonomous onboard science applications. Several science algorithms including: onboard event detection, feature detection, change detection, and unusualness detection are being used to analyze science data, in particular those of Hyperion. The instrument images a 7.5 km by 42 km target area per image and provides detailed spectral mapping across all 220 channels with high radiometric accuracy. The first autonomy experiment on EO-1 used data from Hyperion, to demonstrate the ability to automatically discriminate between clouds, ice/snow, and other high reflection land features onboard the satellite. 86) 87) 88)
These capabilities were also linked to other satellites and ground instruments to form various ad hoc sensor webs enabling various operations concepts that would be useful for future NASA missions. The sensor web and autonomy capabilities developed thus far have been retained and used operationally on EO-1 and have served to reduce the cost of operations by over 50%.
ASE on EO-1 is demonstrating an integrated autonomous mission using onboard science analysis, replanning, and robust execution. The ASE performs intelligent science data selection that leads to a reduction in data downlink. In addition, the ASE increases the science return through autonomous retargeting.
The Livingstone software package version 2 (LV2) is being used in EO-1 on-orbit testbed demonstrations. The AI (Artificial Intelligence) software package "Livingstone" was developed by a team at NASA/Ames Research Center (S. Hayden) and uplinked to EO-1 in the summer of 2004. The LV2 automatically detects and diagnoses simulated failures in the EO-1 payload instruments. The software package has the ability to find and analyze errors in the spacecraft's systems. A key feature of the software is its "reasoner" function, which enables it to compare the predicted performance of a system based on readings from onboard monitors. Contradictions between the predicted and actual performance are used to identify the failures. The autonomous diagnostic tool of LV2 can help controllers in identifying and detecting a potential problem in sufficient time to make repairs or to find a work-around solution. 89) 90) 91)
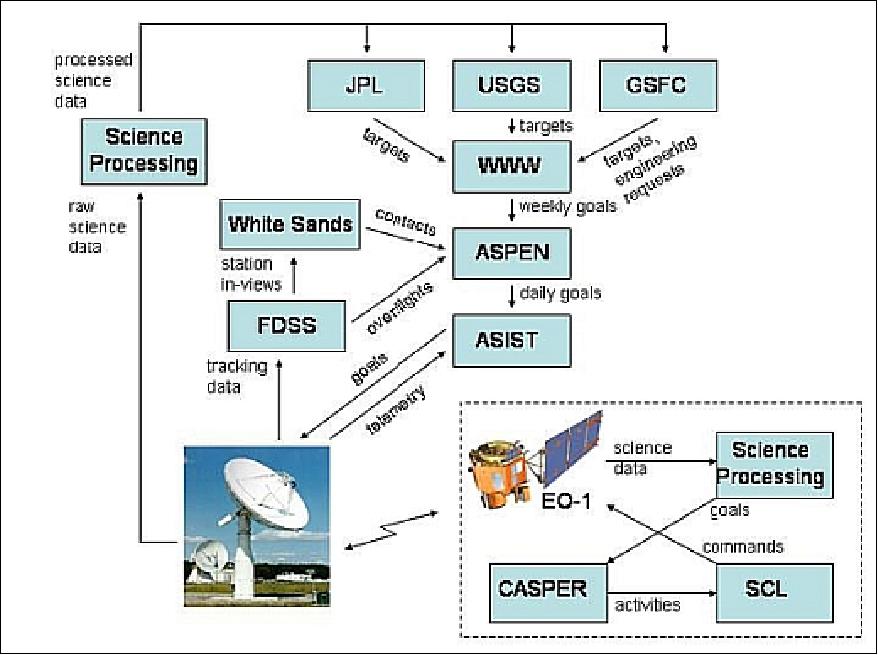
ASE on EO-1 demonstrates an integrated autonomous mission using onboard science analysis, replanning, and robust execution. The ASE performs intelligent science data selection that will lead to a reduction in data downlink. In addition, the ASE will increase science return through autonomous retargeting. Demonstration of these capabilities onboard EO-1 will enable radically different missions with significant onboard decision-making leading to novel science opportunities. The paradigm shift toward highly autonomous spacecraft will enable future NASA missions to achieve significantly greater science returns with reduced risk and reduced operations cost.
EO-1 Demonstrations in Sensor Web Applications
In 1999, ESTO (Earth Science Technology Office) of NASA initiated its AIST (Advanced Information Systems Technology) program with the objective to identify, develop and (where appropriate) demonstrate advanced information system technologies. The goal of NASA's Sensor Web approach is to employ new data acquisition strategies and systems for integrated Earth sensing that are responsive to environmental events for both application and scientific purposes. Sensor Webs can achieve science objectives beyond the abilities of a single platform by:
1) Reducing response time (where events unfold rapidly or where time is otherwise constrained)
2) Increasing the scientific value, quantity, or quality of the observation (where unique science criteria are met, or when co-incident observations are possible) by enabling collaboration among sensing and analysis assets.
The EO-1 spacecraft has been used and continues to be used as the core satellite to demonstrate various mission autonomy technology. In this context, a "Sensor Web" is defined as a coherent collection of spaceborne and/or ground-based sensors and computation nodes linked by a communication fabric that collectively act as a single, dynamically adaptive, observing system. An example sensor web might be one satellite observing a target event and triggering another satellite autonomously. 92) 93) 94)
The key elements of the sensor web include autonomous detection of events, autonomous monitoring of detection notifications, autonomous generation of observation requests, and autonomous rescheduling of observations to acquire data of higher temporal, spatial, and spectral resolution.
The sensor web architecture has the following design objectives:
• Enable autonomous tasking of the EO-1 spacecraft in response to ground-based science events
• Support a diverse number of sensor sources and science event types
• Enable reaction observations to be serviced and uploaded promptly in order to maximize the responsiveness of the sensor web
• Provide autonomous detection algorithms onboard the satellite
• Deliver detection notifications from the onboard algorithms to the ground
• Allow for detailed tracking of changes made by the sensor web to the mission operations schedule
• Minimize the impact on the EO-1 operations staff and procedures.
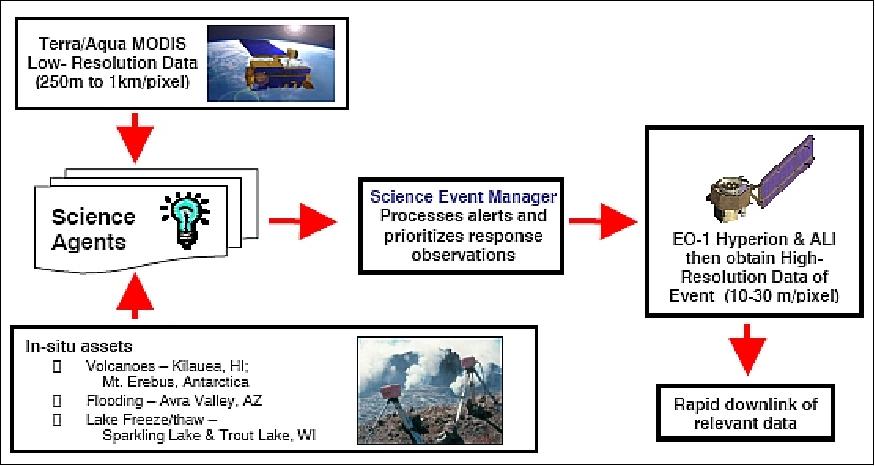
The EO-1 sensor-web architecture consists of a number of components which operate in the following sequence of steps: 95) 96)
1) Asset1 acquires data (usually global coverage at low resolution)
2) Data from Asset1 is downlinked
3) This data is automatically processed to detect science events
4) Science event detections are forwarded to a re-tasking system. This system generates an observation request which is forwarded to an automated planning system.
5) The automated planning system then generates a command sequence to acquire the new observation.
6) This new command sequence is uplinked to Asset2 (EO-1) which then acquires the high resolution data.
7) The data is then downlinked, processed, and forwarded to the interested science team.
In this operational setup, Asset2 functions as the EO-1 spacecraft. The automated re-tasking element of the sensor-web consists of several components working together as follows:
• Science tracking systems for each of the science disciplines automatically acquire and process satellite and ground network data to track science phenomena of interest. These science tracking systems publish their data automatically to the internet each in their own format. In some cases this is via the http or ftp protocol, in some other cases via email subscription and alert protocols.
• Science agents either poll these sites (http or ftp) to pull science data or simply receive emails to receive notifications of ongoing science events. These science agents then produce « science event notifications » in a standard XML (eXtensible Markup Language) format which are then logged into a « science event » database.
• The science event manager processes these science event notifications and matches them up with « science campaigns ». When a match occurs, an observation request is generated.
• The observation requests are processed by the ASPEN (Automated Scheduling and Planning ENvironment) automated mission planning system. ASPEN integrates these requests and schedules observations according to priorities and mission constraints.
• For observations that are feasible, an observation request is uplinked to the spacecraft.
• Onboard EO-1 the ASE software will accommodate the observation request if feasible. In some cases onboard software may have additional knowledge of spacecraft resources or may have triggered additional observations so some uplinked requests may not be feasible.
• Later, the science data is downlinked, processed, and delivered to the requesting scientist.
The EO-1 spacecraft has been networked with other satellites and ground sensors. This network is linked by software and the Internet to an autonomous satellite observation response capability. The system is designed with a flexible, modular, architecture to facilitate expansion in sensors, customization of trigger conditions, and customization of responses.
The EO-1 sensor-web has been used to implement a global surveillance program of science phenomena including: volcanoes, flooding, cryosphere events, and atmospheric phenomena.
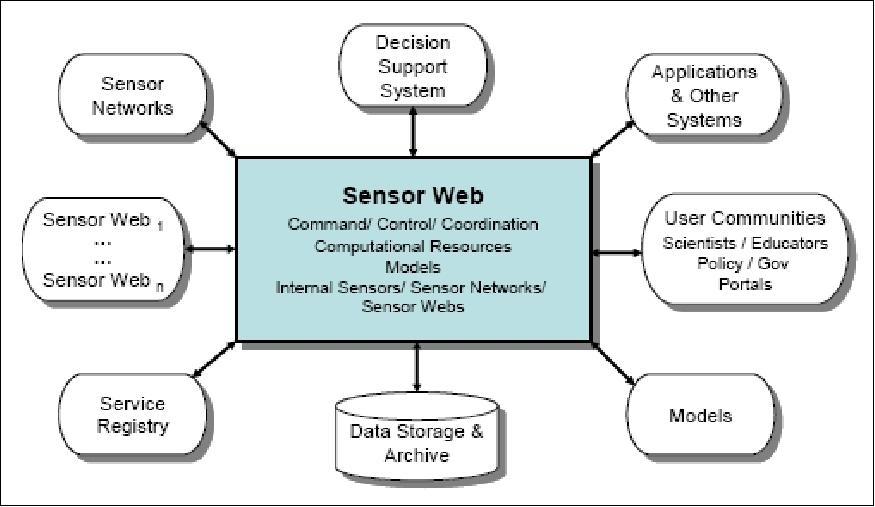
VSW (Volcano Sensor Web)
In the timeframe 2004/5, JPL implemented VSW (Volcano Sensor Web) for a period of 18 months in which data from ground-based and space-based sensors, that detect current volcanic activity, are used to automatically trigger the EO-1 spacecraft, to make high spatial-resolution observations of these volcanoes.
The fully-automated process allows for rapid acquisition and transmission - typically within 48 hours, though theoretically possible within 2-3 hours - of data products containing the most useful data content, namely the numbers, locations, and spectra of hot pixels. This information allows scientists to evaluate the instantaneous eruption extent and intensity. Prior to VSW, this process took weeks. In the future, the sensor web could become an integrated network of ground, airborne, and orbiting sensors that will enable seamless, rapid, autonomous reactions to the detection of volcanic activity. 97)
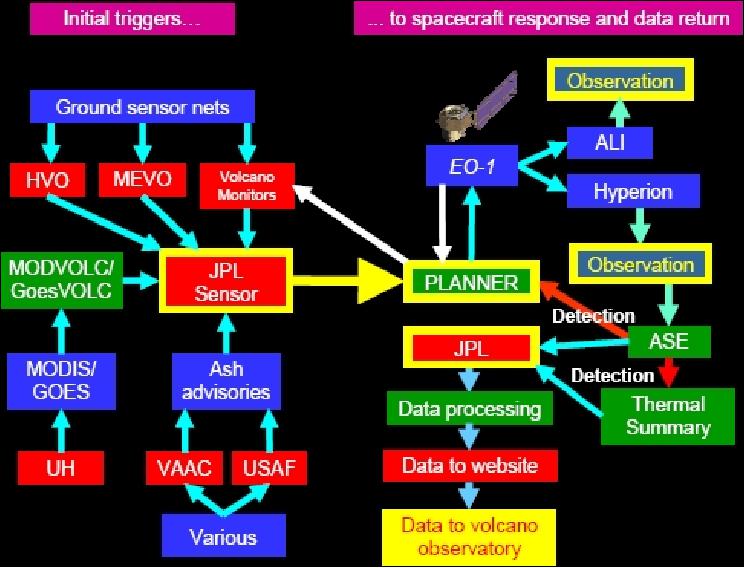
MSW (Model-based Volcano Sensor Web). The MSW represents an advance beyond the simple detection-response operation mode, where an alert of activity generates a request for a spacecraft observation with, generally, no deeper understanding of the magnitude or extent of the eruption that was taking place. 98) 99)
The goal of the MSW is to have asset operations based on determining what additional information and data are needed to understand the state of a volcanic eruption. The required information flow between sensor web assets is performed through web services. The web service interfaces are defined by the Open Geospatial Consortium (OGC) Sensor Web Enablement (SWE) and allow for describing a process flow, enabling extraction of higher-level information from datasets, exchanging of metadata, determining the quality of data, acquiring instrument and data information, communicating between sensors, and discovery of assets, data, and data products and observation requests.
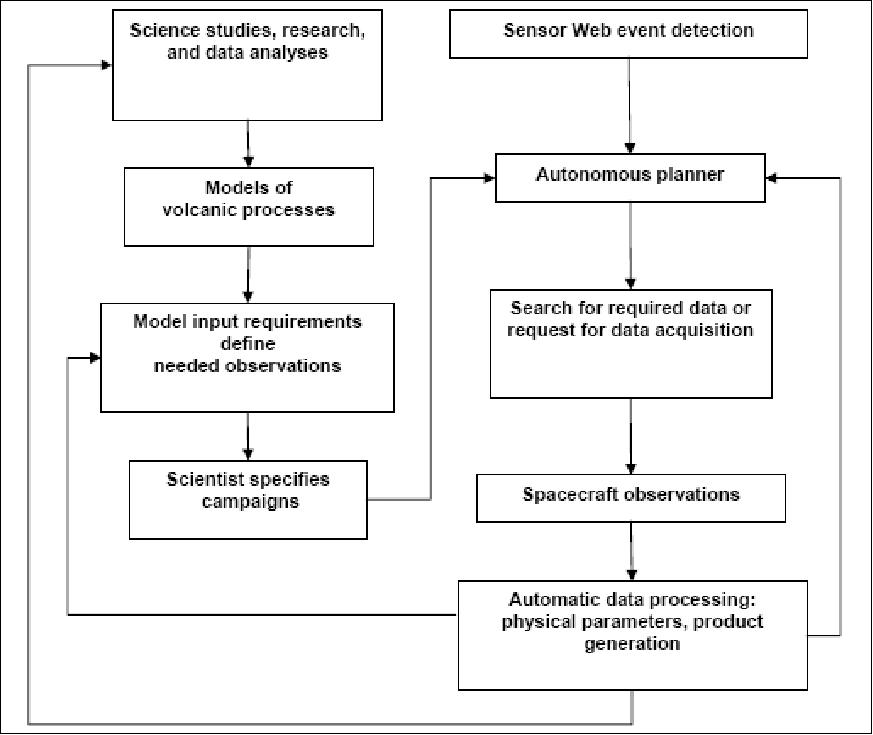
The Sensor Web Project uses a network of sensors linked by software and the internet to an autonomous satellite observation response capability. This system of systems is designed with a flexible, modular, architecture to facilitate expansion in sensors, customization of trigger conditions, and customization of responses. 100)
This system has been used to implement a global surveillance program to study volcanos. Sensorweb tests have also been run to study flooding, cryosphere events, and atmospheric phenomena.
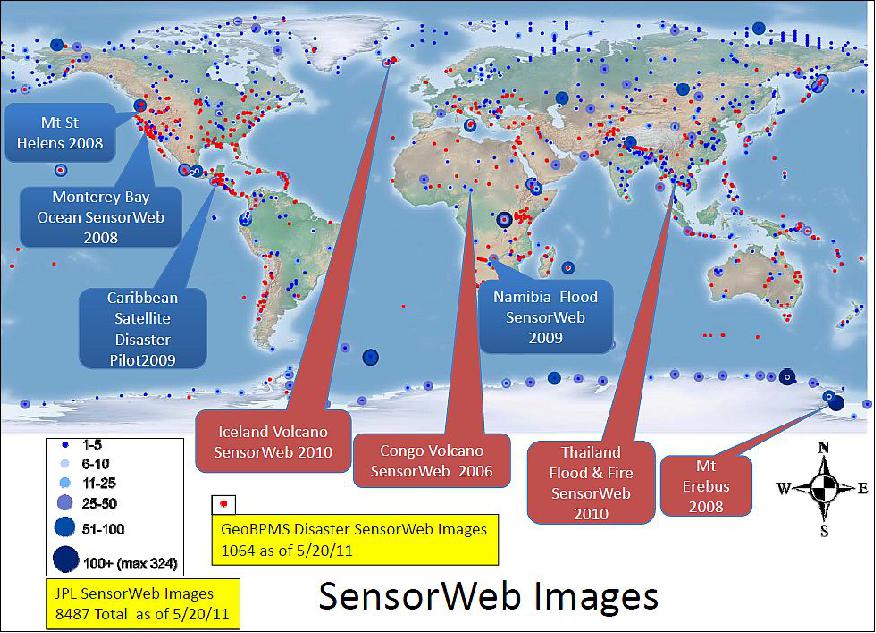
References
1) S. G. Ungar, "Technologies for Future Landsat Missions," PE&RS, Vol. LXII, No. 7, July 1997, pp. 901-905
2) M. Mecham, "EO-1 Takes Landsat Era One Step Smaller," Aviation Week & Space Technology, Vol. 153, No 20, Nov. 13, 2000, pp. 97-99
3) S. G. Ungar, "Overview of EO-1, the First 120 Days," Proceedings of IGARSS, July 9-13, 2001, Sydney, Australia
5) M. J. Cully, C. Gay, J. Thurber, "Small Spacecraft Bus Development in the New Millennium," Proceedings of the AIAA/USU Small Satellite Conference, Logan ,UT, USA, Aug. 31 - Sept. 3, 1998, SSC98-X-6
6) M. E. Perry, P. Alea, M. J. Cully, et al., "Earth Observing-1 Spacecraft Bus," AIAA/USU Conference on Small Satellites, Logan UT, Aug. 13-16, 2001, SSC01-V-6
7) P. Sanneman, "Fault Detection Design and Experience for NMP Earth Observing 1," AAS Guidance and Control Conference 2002, Breckenridge, CO, Feb. 6-10, 2002
8) David R. Hearn, "A Gallery of Images from the Advanced Land Imager," Lincoln Laboratory Journal, Vol. 15, No 2, 2005, pp. 251-270, URL: https://archive.ll.mit.edu/publications/journal/pdf/vol15_no2/15_2-07.pdf
9) C. J. Digenis, "The EO-1 Mission and the Advanced Land Imager," Lincoln Laboratory Journal, Vol. 15, No 2, 2005, pp. 161-164, URL: https://archive.ll.mit.edu/publications/journal/pdf/vol15_no2/15_2-01.pdf
10) D. E. Lencioni, D. R. Hern, C. J. Digenis, J. A. Mendenhall, W. E. Bicknell, "The EO-1 Advanced Land Imager: An Overview," Lincoln Laboratory Journal, Vol. 15, No 2, 2005, pp. 165-180, URL: https://archive.ll.mit.edu/publications/journal/pdf/vol15_no2/15_2-02.pdf
11) D. E. Lencioni, "ALI Technology Overview," ALI Technology Transfer Forum, Oct. 17-18, 2001, URL: http://eo1.gsfc.nasa.gov/new/general/Disk2/ALI%20Technology%20Forum_Overview.pdf
12) D. R. Hearn, C. J. Digenis, D. E. Lencioni, J. A. Mendenhall, J. B. Evans, "EO-1 Advanced Land Imager Overview and Spatial Performance," IGARSS, Sydney, Australia, July 9-13, 2001
13) J. A. Mendenhall, D. E. Lencioni, "EO-1 Advanced Land Imager On-Orbit Radiometric Calibration," Proceedings of IGARSS'2002, Toronto, Canada, June 24-28, 2002
14) J. A. Mendenhall, D. E. Lencioni, D. R. Hearn, C. J. Digenis, "Flight Test Results of the Earth Observing-1 Advanced Land Imager," Proceedings of SPIE, Vol 4814, SPIE Annual Meeting 2002: Remote Sensing and Space Technology, July 7-11, 2002, Seattle, WA
15) S. E. Forman, "Advanced Land Imager: Mechanical Design, Integration, and Testing," Lincoln Laboratory Journal, Vol. 15, No 2, 2005, pp. 181-196, URL: https://archive.ll.mit.edu/publications/journal/pdf/vol15_no2/15_2-03.pdf
16) J. A. Mendenhall, D. E. Lencioni, J. B. Evans, "Spectral and Radiometric Calibration of the Advanced Land Imager," Lincoln Laboratory Journal, Vol. 15, No 2, 2005, pp. 207-224, URL: https://archive.ll.mit.edu/publications/journal/pdf/vol15_no2/15_2-05.pdf
17) D. R. Hearn, "Spatial Calibration and Imaging Performance Assessment of the Advanced Land Imager," Lincoln Laboratory Journal, Vol. 15, No 2, 2005, pp. 225-250, URL: https://archive.ll.mit.edu/publications/journal/pdf/vol15_no2/15_2-06.pdf
18) J. Pearlman, C. Segal, L. Liao, S. Carman, M. Folkman, B. Browne, L. Ong, S. Ungar, "Development and Operations of the EO-1 Hyperion Imaging Spectrometer," August 2000
19) P. Barry, C. Segal, J. Pearlman, et al., "Hyperion Data Collection: Performance Assessment and Science Application," Proceedings of the IEEE Aerospace Conference, Big Sky, MT, March 9-16, 2002
20) J. Pearlman, C. Segal, "Hyperion Instrument Overview," URL: http://www.eoc.csiro.au/hswww/oz_pi/SCE0AA1.PDF
21) S. G. Ungar, E. M. Middleton, L. Ong, P. K. E. Campbell, "EO-1 Hyperion onboard performance over eight years: Hyperion Calibration," URL: http://www.earsel6th.tau.ac.il/~earsel6/CD/PDF/earsel-PROCEEDINGS/3076%20Middleton.pdf
22) D. C. Reuter, G. H. McCabe, R. Dimitrov, S. M. Graham, D. E. Jennings, M. M. Matsumura, D. A. Rapchun, J. W. Travis, "The LEISA/ Atmospheric Corrector (LAC) on EO-1.," Proceedings of IGARSS/IEEE 2001, Sydney, Australia, July 9-13, 2001
23) G. McCabe, D. C. Reuter, "The LEISA/ Atmospheric Corrector (LAC) on EO-1.," URL: http://hdfeos.org/workshops/ws05/presentations/McCabe/15c-LAC-on_EO1.pdf
24) EO-1 Mission Technology Forum, TRW, August 15-16, 2001, URL: http://www.eoc.csiro.au/hswww/oz_pi/techforum/mtf.htm
25) K. Perko, T. Dod, R. Huggins, P. Heisen, G. Miller, D. McMeen, J. Staren, V. Sank, X. Nguyen, "X-Band Phased Array Antenna (XPAA) Summary," EO-1 Mission Technology Forum, TRW, August 15-16, 2001, URL: http://eo1.gsfc.nasa.gov/new/validationReport/Technology/Documents/Summaries/04-XPAA_Rev-0.pdf
26) Kenneth Perko, Raymond Huggins, Peter Heisen, Gary Miller, Donald McMeen, Tom Dod, John Staren, Victor Sank, Xuan Nguyen, "X-Band Phased Array Antenna Validation Report," March 1, 2002, URL: http://eo1.gsfc.nasa.gov/new/validationReport/Technology/Documents-Reports/XPAA.pdf
27) K. L. Perko, R. W. Huggins, P. T. Heisen, G. E. Miller, D. J. McMeen, T. Dod, J. Staren, V. Sank. X. Nguyen, "EO-1 Technology Validation Report, X-Band Phased Array Antenna," August 1, 2001, URL: http://www.eoc.csiro.au/hswww/oz_pi/techforum/Validation_Reports/XPAA.pdf
28) N. M. Teti, "EO-1 Technology Validation Report for the Carbon/Carbon Radiator," EO-1 Mission Technology Forum, TRW, August 15-16, 2001,, URL: http://www.eoc.csiro.au/hswww/oz_pi/techforum/Validation_Reports/CCR.pdf
29) B. Carpenter, J. Lyons, "EO-1 Technology Validation Report - Lightweight Flexible Solar Array Experiment," EO-1 Mission Technology Forum, TRW, August 15-16, 2001, URL: http://www.eoc.csiro.au/hswww/oz_pi/techforum/Validation_Reports/LFSA.pdf
30) T. Smith, "Wideband Advanced Recorder Processor (WARP)," EO-1 Mission Technology Forum, TRW, August 15-16, 2001, URL: http://www.eoc.csiro.au/hswww/oz_pi/techforum/Presentations/24-WARP.pdf
31) T. Smith, "Wideband Advanced Recorder and Processor (WARP) Summary," URL: http://eo1.gsfc.nasa.gov/new/validationReport/Technology/Documents-Summaries/05-WARP_Rev-0.pdf
32) E. Webb, M. Cunningham, T. T. Leath, "The WARP: wideband advanced recorder processor for the New Millennium Program E0-1;" Proceedings of the IEEE Aerospace Conference, Snowmass, CO, Feb. 1-8, 1997, Vol. 4, pp. 471-478
33) T. Smith, J. Kessler, "Earth Orbiter 1 - Wideband Advanced Recorder and Processor (WARP)," URL: http://ntrs.nasa.gov/archive/nasa/casi.ntrs.nasa.gov/19990024890_1999024437.pdf
34) Information provided by W. Andrew Hoskins of General Dynamics OTS, Redmond, WA, USA
35) S. W. Benson, I. A. Arrington, W. A. Hoskins, N. J. Meckel, "Development of a PPT for the EO-1 Spacecraft," AIAA-99-2276, June 1999.
36) C. Zakrzwski, P. Sanneman, T. Hunt, K. Blackman, "Design of the EO-1 Pulsed Plasma Thruster Attitude Control Experiment.," AIAA/ASME/SAE/ASEE Joint Propulsion Conference and Exhibit, 37th, Salt Lake City, UT, July 8-11, 2001, paper: AIAA-2001-3637
37) C. Zakrzwski, S. Benson, "Pulsed Plasma Thruster (PPT)," EO-1 Mission Technology Forum, TRW, August 15-16, 2001, URL: http://www.eoc.csiro.au/hswww/oz_pi/techforum/Presentations/25-PPT.pdf
38) C. Zakrzwski, S. Benson, P. Sanneman, A. Hoskins, "On-Orbit Testing of the EO-1 Pulsed Plasma Thruster," 38th AIAA/ASME/SAE/ASEE Joint Propulsion Conference & Exhibit, July 7-10, 2002, Indianapolis, Indiana, paper 2002-3979
39) Chuck Zakrzwski, Joe Cassady, Scott Benson, Paul Sanneman, "Pulsed Plasma Thruster (PPT) Summary," URL: http://eo1.gsfc.nasa.gov/new/validationReport/Technology/Documents/Summaries/08-PPT_Rev-0.pdf
40) J. W. Bretthauer, C. H. Chalfant, F. J. Orlando, E. Rezek, M. Sawyer, "Spaceborne Fiber Optic Data Bus (SFODB)," URL: http://www.spacephotonics.com/SPIResources/1393-NASA-Paper-J-Bretthauer.pdf
41) D. Folta, J. Bistrow, A. Hawkins, G. Dell, "NASA's Autonomous Formation Flying Technology Demonstration, Earth Observing-1 (EO-1)," Proceedings of International Symposium Formation Flying, Oct. 29-31, 2002, Toulouse, France
42) D. Folta, J. Bistrow, A. Hawkins, G. Dell, "EO-1 Technology Validation Report - Enhanced Formation Flying," March 15, 2002, URL: http://eo1.gsfc.nasa.gov/new/validationreport/Technology/Documents-Reports/GSFC_EFF.pdf
43) F. Bauer, J. Bristow, D. Folta, K. Hartman, D. Quinn, J. How, "Satellite Formation Flying Using an Innovative Autonomous Control System (AutoCon) Environment," Proceedings of the AIAA/AAS Astrodynamics Specialist Conference, AIAA Aug. 1997, pp. 97-3821
44) D. Folta, J. Bistrow, A. Hawkins, G. Dell, "Validation of NASA's First Autonomous Formation Flying Experiment," EO-1 Mission Technology Forum, Greenbelt, MD, USA, Aug. 14-17, 2001
45) S. G. Ungar, "Overview of The Earth Observing One (EO-1) Mission," Proceedings of IGARSS'2002, Toronto, Canada, June 24-28, 2002
46) B. Cramer, D. Mandl, S. Frye, "EO-1 Mission Status for NRO/NGA," Jan. 13, 2005, URL: http://eo1.gsfc.nasa.gov/new/extended/extended/EO-1_NRO-NGA%20HQ%20Pitch%201-13-05%20ver%202.ppt
47) Kasha Patel, "NASA Says Goodbye to a Pathfinder Earth Satellite After 17 Years,"
48) "The Zones of Kilimanjaro," NASA Earth Observatory, Feb. 8, 2017, URL: http://earthobservatory.nasa.gov/IOTD/view.php?id=89605
49) "EO-1 End of Mission," USGS, Jan. 6, 2017, URL: https://eo1.usgs.gov/
50) "EO-1 Mission Operations Phase F Summary," NASA, June 2016, URL: https://eo1.gsfc.nasa.gov/EO-1%20Phase-F%20Report%2020160617%20Final.docx
51) Kathryn Hansen, "Kilauea's Lava Pours Into the Pacific," NASA Earth Observatory, Nov. 20, 2016, URL: http://earthobservatory.nasa.gov/IOTD/view.php?id=89127
52) Alan Buis, "A First: NASA Spots Single Methane Leak from Space," NASA/JPL, June 14, 2016, URL: http://www.jpl.nasa.gov/news/news.php?release=2016-152
53) D. R. Thompson, A. K. Thorpe, C. Frankenberg, R. O. Green, R. Duren, L. Guanter, A. Hollstein, E. Middelton, L. Ong, S. Ungar, "Space-based Remote Imaging Spectroscopy of the Aliso Canyon CH4 Super-emitter," Geophysical Research Letters, Vol. 43, Accepted manuscript online: 28 May 2016, doi: 10.1002/2016GL069079
54) David R. Landis, Elizabeth M. Middleton, Stephen G. Ungar, Stuart W. Frye, Daniel J. Mandl, K. Fred Huemmrich, Petya K. Campbell, Mitchell K. Hobish, "EO-1: 15 Years After the Start of Its "One-Year Mission"," The Earth Observer, January-February 2016, pp: 4-14, URL: http://eospso.nasa.gov/sites/default/files/eo_pdfs/Jan_Feb_2016_508_col.pdf
55) "A Fresh Plume from Copahue," NASA Earth Observatory, Jan. 20. 2016, URL: http://earthobservatory.nasa.gov/IOTD/view.php?id=87338
56) Steve Platnick, "Editor's Corner," NASA, The Earth Observer, November - December 2015. Volume 27, Issue 6, p. 2, URL: http://eospso.nasa.gov/sites/default/files/eo_pdfs/Nov%20Dec%202015_508_col.pdf
57) "NASA Earth Science Senior Review 2015," submitted to Michael Freilich, Director, Earth Science Division Science Mission Directorate, NASA, June 22, 2015, URL: http://science.nasa.gov/media/medialibrary/2015/07/15/2015_ESDSenior-ReviewReport_FINAL.pdf
58) Elizabeth M. Middleton, Daniel Mandl, Stuart W. Frye, Lawrence Ong, Stephen G. Ungar, PetyaE. Campbell, K. Fred Huemmrich, David R. Landis, "EO-1: Request for Mission Extension," NASA, August 22, 2015, URL: https://hyspiri.jpl.nasa.gov/downloads/2015_Symposium/day1/5_EO-1HyperionStatus_Middleton.pdf
59) Elizabeth M. Middleton, Daniel J. Mandl, Stuart W. Frye, Lawrence Ong, Stephen Ungar, Petya E. Campbell, K. Fred Huemmrich, David R. Landis, Robert O. Green, "EO-1/Hyperion: Nearing Fourteen Years of Successful Mission Science Operation and End of Mission Plans," Proceedings of IGARSS (IEEE Geoscience and Remote Sensing Society) 2014, Québec, Canada, July 13-18, 2014, URL of presentation: : http://www.grss-ieee.org/wp-content/uploads/2014/12/2014_07_ISIS_Session1_Mission/Middleton-EO-1_IGARSS_2014_presentation_716.pdf
60) "Wildfire Scars Valparaiso, Chile," NASA Earth Observatory, May 7, 2014, URL: http://earthobservatory.nasa.gov/IOTD/view.php?id=83620
61) "Chilika Lake and Nalabana Bird Sanctuary," NASA Earth Observatory series, NASA, March 29, 2014, URL: http://earthobservatory.nasa.gov/IOTD/view.php?id=83431
62) "Changed Landscape Around Sinabung," NASA Earth Observatory, Feb. 12, 2014, URL: http://earthobservatory.nasa.gov/IOTD/view.php?id=83080
63) "New Island in the Ring of Fire," NASA Earth Observatory, Dec. 18, 2013, URL: http://earthobservatory.nasa.gov/IOTD/view.php?id=82607
64) "Earthquake Births New Island off Pakistan," NASA Earth Observatory, Sept. 28, 2013, URL: http://earthobservatory.nasa.gov/NaturalHazards/view.php?id=82146
65) Elizabeth Ritchie (Chair), Ana Barros, Robin Bell, Alexander Braun, Richard Houghton, B. Carol Johnson, Guosheng Liu, Johnny Luo, Jeff Morrill, Derek Posselt, Scott Powell, William Randel, Ted Strub, Douglas Vandemark, "NASA Earth Science Senior Review 2013," June 14, 2013, URL: http://science.nasa.gov/media/medialibrary/2013/07/16/2013-NASA-ESSR-FINAL.pdf
66) IEEE JSTARS, Vol. 6, No 2, April 2013, ISSN-1939-1404
67) "Italy's Mount Etna boils over: new infrared image from our EO-1 satellite." NASA, Feb. 20, 2013, URL: http://earthobservatory.nasa.gov/NaturalHazards-view.php?id=80479
68) "Activity at Tolbachik Volcano," NASA, April 14, 2013, URL: http://earthobservatory.nasa.gov/IOTD/view.php?id=80861
69) Jesse Allen, Robert Simmon, "Moving Rock at Puyehue-Cordón Caulle," NASA Earth Observatory, Feb. 6, 2013, URL: http://earthobservatory.nasa.gov/IOTD/view.php?id=80330
70) George Hurtt (Chair), Ana Barros, Richard Bevilacqua, Mark Bourassa, Jennifer Comstock, Peter Cornillon, Andrew Dessler, Gary Egbert, Hans-Peter Marshall, Richard Miller, Liz Ritchie, Phil Townsend, Susan Ustin,"NASA Earth Science Senior Review 2011," June 30, 2011, URL: http://science.nasa.gov/media/medialibrary/2011/07/22/2011-NASA-ESSR-v3-CY-CleanCopy_3x.pdf
71) Robert Simmon, "Detailed Views of Erupting Nabro Volcano: Image of the Day," NASA, June 28, 2011, URL: http://earthobservatory.nasa.gov/IOTD/view.php?id=51216
72) "Earthquake and Tsunami near Sendai, Japan," NASA Earth Observatory, March 18, 2011, URL: http://earthobservatory.nasa.gov/NaturalHazards/view.php?id=49756
73) NASA, Feb. 20, 2011, URL: http://www.universetoday.com/83465/as-seen-from-space-ghostly-ethereal-island/
74) "Earth Observing-1: Ten Years of Innovation," NASA, Nov. 23, 2010, URL: http://www.nasa.gov/topics/earth/features/eo1-10th.html
75) Elizabeth M. Middleton, Petya K. E. Campbell, Stephen G. Ungar, Lawrence Ong, Qingyuan Zhang, K. Fred Huemmrich, Daniel J. Mandl, Stuart W. Frye, "Using EO-1 Hyperion images to prototype environmental products for HYSPIRI," Proceedings of IGARSS (IEEE International Geoscience and Remote Sensing Symposium) 2010, Honolulu, HI, USA, July 25-30, 2010
76) Steven A. Ackerman (chair), Richard Bevilacqua, Bill Brune, Bill Gail, Dennis Hartmann, George Hurtt, Linwood Jones, Barry Gross, John Kimball, Liz Ritchie, CK Shum, Beata Csatho, William Rose, Carlos Del Castillo, Cheryl Yuhas, "NASA Earth Science Senior Review 2009," URL: http://nasascience.nasa.gov/about-us/science-strategy/senior-reviews/2009SeniorReviewSciencePanelReportFINAL.pdf
77) Debra Werner, "NASA Budget fpr Earth Science Lags Behind Rising Expectations," Space News, January 4, 2010, p. 1 & 4
78) Information provided by Joseph P. Young of NASA/GSFC, Greenbelt, MD, USA
79) G. Rabideau, D. Tran, S. Chien, B. Cichy, R. Sherwood, D. Mandl, S. Frye, S. Shulman, J. Szwaczkowski, D. Boyer, J. van Gaasbeck, "Mission Operations of Earth Observing-1 with Onboard Autonomy," 2nd IEEE International Conference on Space Mission Challenges for Information Technology (SMC-IT'06), Pasadena, CA, USA, July 17-21, 2006, pp. 367-373, URL: http://ase.jpl.nasa.gov/public/papers/rabideau_ieeesmcit06_eo1.pdf
80) D. Mandl, S. Frye, "Earth Observing 1: A Pathfinder to Future Sensor Webs," The Earth Observer, Vol. 18, Issue 1, January-February 2006, pp. 6-9
81) http://eo1.gsfc.nasa.gov/new/extended/
82) D. Mandl, R. Solberg, S. Freye, P. Cappelaere/Vightel, S. Ungar, T. Ames, S. Chien, "A Service Oriented Architecture to Enable Sensor Webs," AGU Fall Meeting, 2006, URL: http://eo1.gsfc.nasa.gov/new/extended/sensorWeb/AGU%20Presentation-20on%20EO-1%20OGC%20Experiments%20as%20of%2012-8-06%5B1%5D.ppt
83) http://www.opengeospatial.org/ogc/markets-technologies/swe
85) R. Sherwood, S. Chien, D. Tran, B. Cichy, R. Castano, A. Davies, G. Rabideau, "The EO-1 Autonomous Sciencecraft," Proceedings of the 21st Annual Conference on Small Satellites, Logan, Utah, USA, Aug. 13-16, 2007, SSC07-X11-1, URL: http://ase.jpl.nasa.gov/public/papers/sherwood_smallsat07_eo1.pdf
86) R. Sherwood, S. Chien, D. Tran, B. Cichy, R. Castano, A. Davies, G. Rabideau, "Preliminary Results of the Autonomous Sciencecraft Experiment," Proceedings of the IEEE Aerospace Conference, Big, Sky, MT, Mar. 6-13, 2004
87) S. Chien, R. Sherwood, D. Tran, B. Cichy, et al., "The EO-1 Autonomous Science Agent," Proceedings of NASA ESTC (Earth Science Technology Conference) 2004, Palo Alto, CA, June 22-24, 2004
88) R. Sherwood, "Space Technology 6 Autonomous Sciencecraft Experiment Validation & EO-1 Sensorweb Demonstrations,", Proceedings of the Sixth Annual NASA Earth Science Technology Conference (ESTC 2006), College Park, MD, USA, June 27-29, 2006, URL: http://ase.jpl.nasa.gov/public/papers/chien_aamas2005_lessons.pdf
89) J. Bluck, "NASA Software Enables Satellite Self-Service in Space," Oct. 7, 2004, URL: http://www.nasa.gov/home/hqnews/2004/oct/HQ_04339_self_service.html
90) B. Iannotta, "Diagnostic Software Shows Promise in Testing Aboard EO-1," Space News, Oct. 18, 2004, p. 20
91) S. Chien, R. Sherwood, D. Tran, B. Cichy, G. Rabideau, R. Castaño, A. Davies, D. Mandl, S. Frye, B. Trout, J. D'Agostino, S. Shulman, D. Boyer, S. Hayden, A. Sweet, S. Christa, "Lessons Learned from Autonomous Sciencecraft Experiment," 4th International Conference on Autonomous Agents and Multi Agent Systems (AAMAS'05), July 25-29, 2005, Utrecht, The Netherlands, URL: http://ase.jpl.nasa.gov/public/papers/chien_aamas2005_lessons.pdf
92) R. Sherwood, S. Chien, "SensorWebs for Science: New Directions for the Future," IEEE Infotech@Aerospace Conference, Rohnert Park, CA, May 2007, URL: http://sensorwebs.jpl.nasa.gov/public/papers/sherwood_ieeeinfoaero07_sensorweb.pdf
93) K. A. Delin, "The Sensor Web: A Macro-Instrument for Coordinated Sensing," First IEEE International Conference on Sensors 2002, Vol. 2, pp. 270-285, Orlando, FLA, USA, June 12-14, 2002, URL: http://www.mdpi.org/sensors/papers/s20700270.pdf
94) R. Sherwood, S. Chien, "Sensor Web Technologies: A New Paradigm for Operations," 7th International Symposium Reducing the Costs of Spacecraft Ground Systems and Operations (RCSGSO 2007), Moscow, Russia, June 11-15, 2007, URL: http://sensorwebs.jpl.nasa.gov/public/papers/sherwood_rcsgso07_sensorweb.pdf
95) R. Sherwood, S. Chien, D. Tran, B. Cichy, R. Castano, A. Davies, G. Rabideau, "Autonomous Science Agents and Sensor Webs: EO-1 and Beyond," 2006 IEEE Aerospace Conference, Big Sky, MT, USA, March 4-11, 2006, URL: http://ase.jpl.nasa.gov/public/papers/sherwood_ieeeaero06_beyond.pdf
96) A. G. Davies, S. Chien, R. Wright, A. Mikilius, P. R. Kyle, M. Welsh, J. B. Johnson, D. Tran, S. R. Schaffer, R. Sherwood, "Sensor Web Enables Rapid Response to Volcanic Activity," AGU EOS, Vol. 87, No. 1, Jan. 3, 2006, pp. 1-5
97) A. G. Davies, S. Chien, R. Wright, A. Miklius, P. R. Kyle, M. Welsh, J. B. Johnson, D. Tran, S. R. Schaffer, R. Sherwood, "Sensor Web Enables Rapid Response to Volcanic Activity," EOS (AGU), Vol. 87, No. 1, 3, January 2006, pp.1, 5, URL: http://eo1.gsfc.nasa.gov/new/sensorWebExp/Sensor%20Web%20Enables-20Rapid%20Response_Eos.pdf
98) A. G. Davies, R. Castaño, S. Chien, D. Tran, L. Mandrake, R. Wright, P. Kyle, J.-C. Komorowski, D. Mandl, S. Freye, "Rapid Response to Volcanic Eruptions with an Autonomous Sensor Web: The Nyamulagira Eruption of 2006," Proceedings of the 2008 IEEE Aerospace Conference, Big Sky, MT, USA, March 1-8, 2008
99) K. Moe, S. Smith, G. Prescott, R. Sherwood, "Sensor Web Technologies for NASA Earth Science," Proceedings of the 2008 IEEE Aerospace Conference, Big Sky, MT, USA, March 1-8, 2008
100) "Volcano Sensorweb," NASA/JPL, URL: http://sensorwebs.jpl.nasa.gov/
101) "SensorWeb Vision," NASA/GSFC, URL: http://eo1.gsfc.nasa.gov/new/sensorWebExp/index.html
Spacecraft Launch Sensor Complement Demonstration of new technologies Mission Status References Back to Top