GAIA 2019-2013
Gaia status and imagery for the period 2019-2013
• December 11, 2019: A new study on the kinematics and chemical composition of a sample of stars in the vicinity of the sun, led by Dr. Daniela Carollo, researcher of the Italian National Institute for Astrophysics (INAF) of Turin, Italy, has revealed that the stars that make up the thick disk of the Milky Way belong to two distinct stellar populations with different characteristics and not to a single one, as has been thought for more than two decades. 1)
- The new thick disk component, called the metal-weak thick disk (MWTD) or metal-poor thick disk, differs from the canonical one in the speed of rotation around the galactic center and its chemical composition. Indeed, stars that make up the TD have a rotational speed of about 180 km per second, while those of the MWTD rotate more slowly, at about 150 km per second. Stars belonging to the MWTD are also two times more metal-poor than those of the TD and have higher energy, a property that allows them to reach greater heights from the galactic plane.
- "It was almost 30 years that astronomers tried to solve this puzzle," said Dr. Carollo, scientist at the Astrophysical Observatory of Turin the first author of the article reporting the discovery, just published in The Astrophysical Journal. "In fact, it was thought that the MWTD was nothing but an extension of the thick disk and not an independent population with different astrophysical origins." 2)
- The accurate parameters provided by the ESA Gaia mission (positions, distances and intrinsic motion of the stars), and the chemical information on a sample of 40,000 stars of the Sloan Digital Sky Survey (SDSS), allowed the team to distinguish the MWTD in a diagram showing the angular momenta combined with the chemistry.
- "The angular momenta are quantities that are conserved during the formation and subsequent evolution of a physical a system like our galaxy," explains Dr. Carollo. "Thus, in an accurate diagram of the angular momenta, the stars brought into the galaxy by the same progenitor, as for example from a previous fusion of a satellite galaxy, will have similar angular momenta and will tend to cluster in the diagram."
- The TD and MWTD form two distinct groups in the diagram, as well as in their chemistry. In astronomy, the chemical elements heavier than hydrogen and helium, which were formed during the Big Bang, are defined as metals. These heavier chemical elements were produced during the nucleosynthesis of massive stars that exploded as supernovae.
- A particular group of light elements such as magnesium and titanium, when compared to heavier elements, such as iron, provide a fundamental parameter that allows scientists to distinguish populations of old stars from those of younger stars. The MWTD not only possesses stars poorer in iron, but those stars are also richer in elements of the magnesium and titanium group (alpha elements) that suggests an antecedent formation to the TD.
- These important differences between the TD and the MWTD, namely the kinematics and the chemistry of their stars, suggest that the two disks had a different origin during the galaxy formation process.
- But how did a second thick disk form in the Milky Way? The hypotheses are manifold: the MWTD could be older than the TD and its stars could have been energized by a merger of a dwarf satellite galaxy with the Milky Way, during its initial formation stage. Subsequently, the fusion of a second satellite galaxy would have given rise to the TD.
- Another possibility is that the MWTD stars had originally formed in an area closer to the center of the primordial galaxy and subsequently been transported to larger distances, closer to where the sun is located now, by internal phenomena such as instabilities of the central bar or the galaxy's spiral arms formation. Or an ancient satellite galaxy of mass similar to the Small Magellanic Cloud merged with the primordial galaxy and its stars began to spin around the galactic center due to the mutual gravitational interaction.
- All these hypotheses can be tested through theoretical models and simulations of Milky Way-like galaxy formation.
• October 24, 2019: The Gaia Data Release 2 catalog has been used extensively by astronomers across the world. About 3 to 4 papers appear per day based on the Gaia DR2 catalog, touching many different topics. 3)
• August 28, 2019: Rather than leaving home young, as expected, stellar ‘siblings' prefer to stick together in long-lasting, string-like groups, finds a new study of data from ESA's Gaia spacecraft. 4)
- Exploring the distribution and past history of the starry residents of our galaxy is especially challenging as it requires astronomers to determine the ages of stars. This is not at all trivial, as ‘average' stars of a similar mass but different ages look very much alike.
- To figure out when a star formed, astronomers must instead look at populations of stars thought to have formed at the same time – but knowing which stars are siblings poses a further challenge, since stars do not necessarily hang out long in the stellar cradles where they formed.
- "To identify which stars formed together, we look for stars moving similarly, as all of the stars that formed within the same cloud or cluster would move in a similar way," says Marina Kounkel of Western Washington University, USA, and lead author of the new study. The study uses data from Gaia's second release (DR2), provided in April 2018. 5)
- "We knew of a few such ‘co-moving' star groups near the Solar System, but Gaia enabled us to explore the Milky Way in great detail out to far greater distances, revealing many more of these groups."
- Marina used data from Gaia's second release to trace the structure and star formation activity of a large patch of space surrounding the Solar System, and to explore how this changed over time. This data release, provided in April 2018, lists the motions and positions of over one billion stars with unprecedented precision.
- The analysis of the Gaia data, relying on a machine learning algorithm, uncovered nearly 2000 previously unidentified clusters and co-moving groups of stars up to about 3000 light years from us – roughly 750 times the distance to Proxima Centauri, the nearest star to the Sun. The study also determined the ages for hundreds of thousands of stars, making it possible to track stellar ‘families' and uncover their surprising arrangements.
![Figure 4: This image shows a view of stellar ‘families' – clusters and co-moving groups of stars in the Milky Way – identified using data from the second data release of ESA's Gaia mission. Families younger than 30 million years are highlighted in orange, on top of an all-sky view based on Gaia observations [image credit: ESA/Gaia/DPAC; Data: M. Kounkel & K. Covey (2019)]](/api/cms/documents/163813/5389966/Gaia2019_Auto50.jpeg)
- "Around half of these stars are found in long, string-like configurations that mirror features present within their giant birth clouds," adds Marina.
- "We generally thought young stars would leave their birth sites just a few million years after they form, completely losing ties with their original family – but it seems that stars can stay close to their siblings for as long as a few billion years."
- The strings also appear to be oriented in particular ways with respect to our galaxy's spiral arms – something that depends upon the ages of the stars within a string. This is especially evident for the youngest strings, comprising stars younger than 100 million years, which tend to be oriented at right angles to the spiral arm nearest to our Solar System.
- The astronomers suspect that the older strings of stars must have been perpendicular to the spiral arms that existed when these stars formed, which have now been reshuffled over the past billion years.
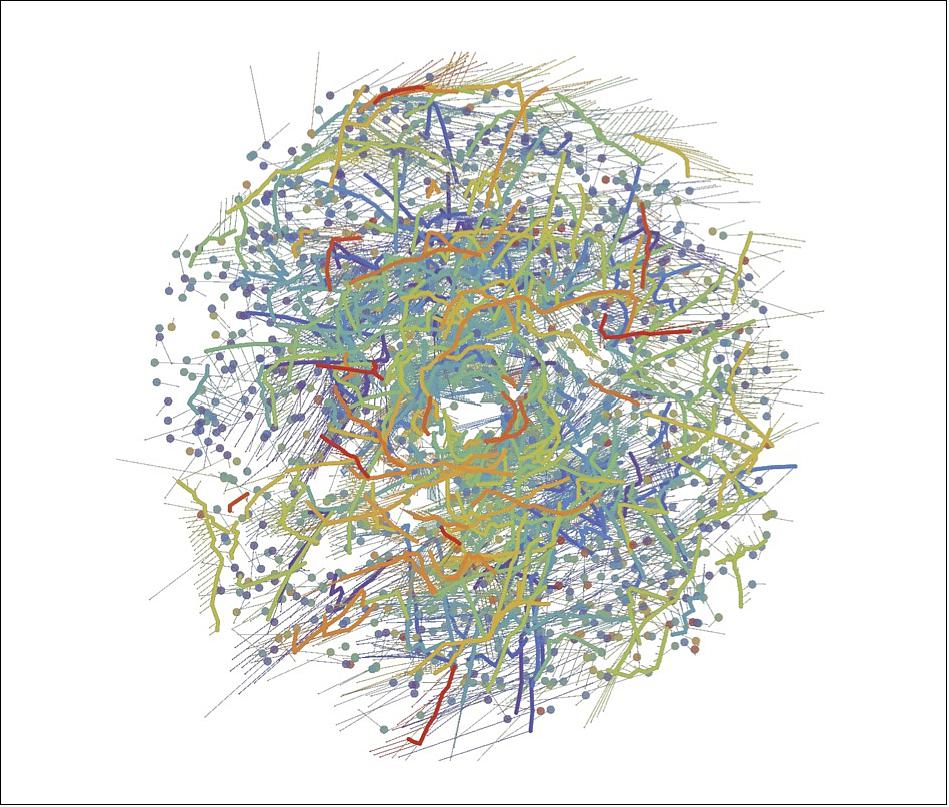
![Figure 5: This diagram shows an edge-on view of stellar ‘families' – clusters (dots) and co-moving groups (thick lines) of stars – within about 3000 light-years from the Sun, which is located at the center of the image. The diagram is based on data from the second data release of ESA's Gaia mission [image credit: M. Kounkel & K. Covey (2019)]](/api/cms/documents/163813/5389966/Gaia2019_Auto4F.jpeg)
- "The proximity and orientation of the youngest strings to the Milky Way's present-day spiral arms shows that older strings are an important ‘fossil record' of our galaxy's spiral structure," says co-author Kevin Covey, also of Western Washington University, USA.
- "The nature of spiral arms is still debated, with the verdict on them being stable or dynamic structures not settled yet. Studying these older strings will help us understand if the arms are mostly static, or if they move or dissipate and re-form over the course of a few hundred million years – roughly the time it takes for the Sun to orbit around the galactic center a couple of times."
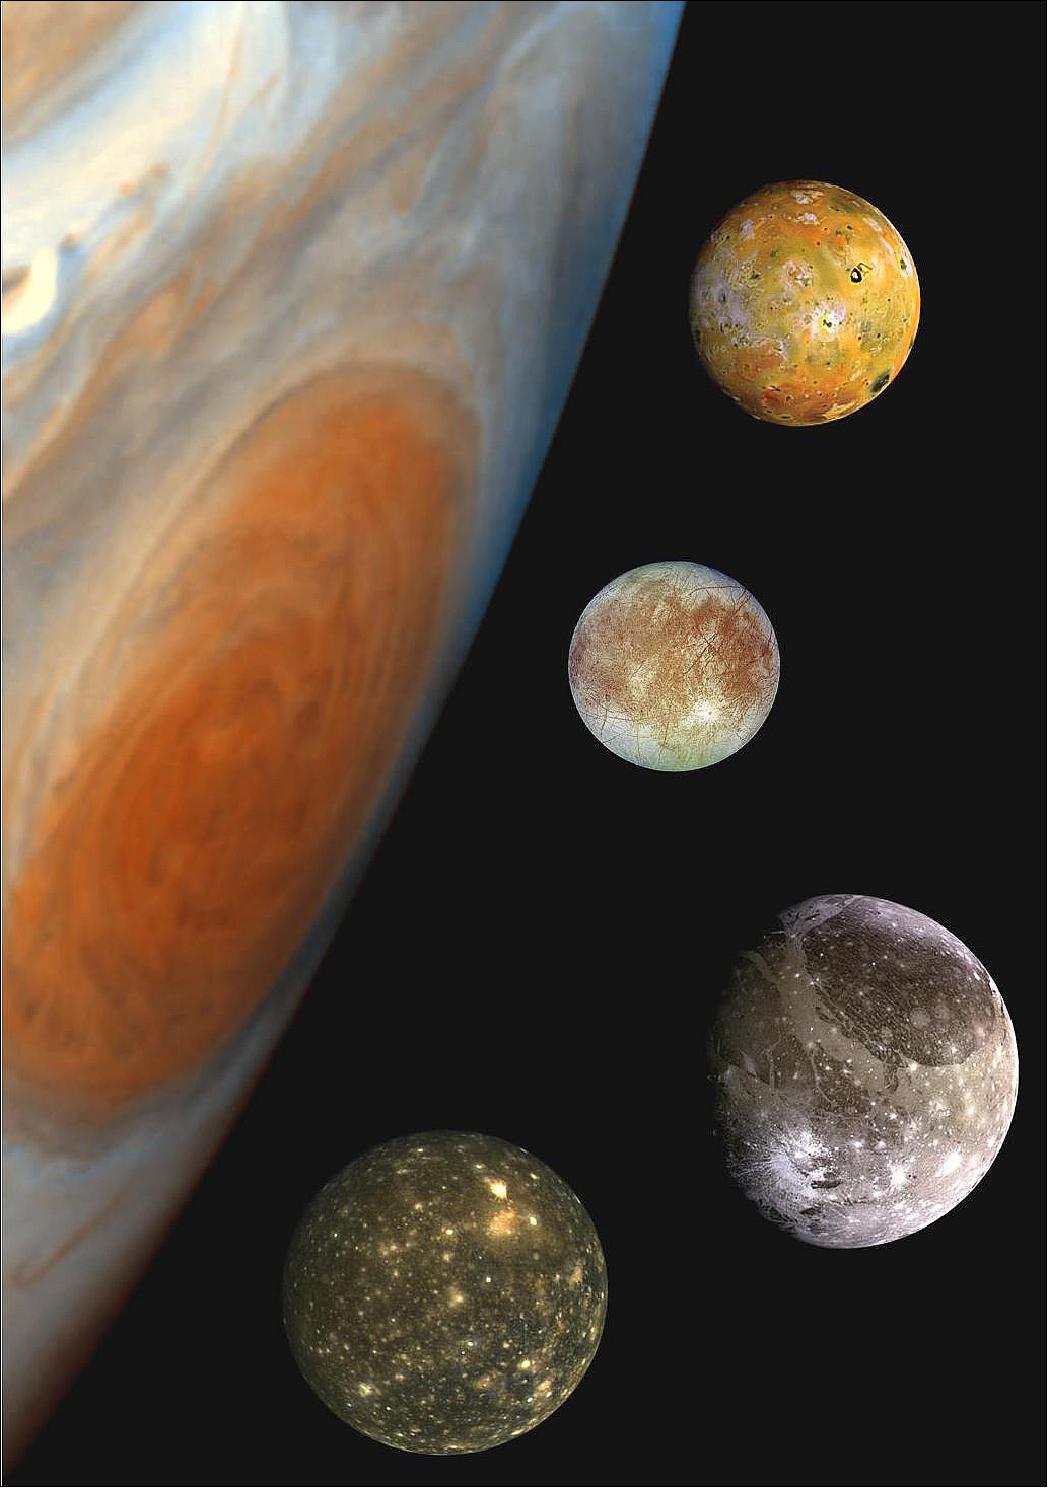
• July 25, 2019: On 31 March 2017, Jupiter's moon Europa passed in front of a background star – a rare event that was captured for the first time by ground-based telescopes thanks to data provided by ESA's Gaia spacecraft. 6)
- Previously, observatories had only managed to watch two of Jupiter's other moons – Io and Ganymede – during such an event.
- Gaia has been operating in space since late 2013. The mission aims to produce a three-dimensional map of our Galaxy, and characterize the myriad stars that call the Milky Way home. It has been immensely successful so far, revealing the locations and motions of over one billion stars.
- Knowing the precise locations of the stars we see in the sky allows scientists to predict when various bodies in the Solar System will appear to pass in front of a background star from a given vantage point: an event known as a stellar occultation.
- Gaia is no stranger to such events – the spacecraft helped astronomers make unique observations of Neptune's moon Triton as it passed in front of a distant star in 2017, revealing more about the moon's atmosphere and properties.
- Occultations are hugely valuable; they enable measurements of the characteristics of the foreground body (size, shape, position, and more), and can reveal structures like rings, jets, and atmospheres. Such measurements can be made from the ground – something that Bruno Morgado of the Brazilian National Observatory and LIneA, Brazil, and colleagues took advantage of to explore Jupiter's moon Europa.
- "We used data from Gaia's first data release to forecast that, from our viewpoint in South America, Europa would pass in front of a bright background star in March 2017 – and to predict the best location from which to observe this occultation," said Bruno, lead researcher of a new paper reporting the findings from the 2017 occultation. Gaia's first data release was provided in September 2016. 7)
- "This gave us a wonderful opportunity to explore Europa, as the technique offers an accuracy comparable to that of images obtained by space probes."
- The Gaia data showed that the event would be visible from a thick band slicing from north-west to south-east across South America. Three observatories located in Brazil and Chile were able to capture data – a total of eight sites attempted, but many experienced poor weather conditions.
- In-keeping with previous measurements, the observations refined Europa's radius to 1561.2 km, precisely determined Europa's position in space and in relation to its host planet, Jupiter, and characterized the moon's shape. Rather than being exactly spherical, Europa is known to be an ellipsoid. The observations show the moon to measure 1562 km when measured across in one direction (the so-called apparent ‘semi-major' axis), and 1560.4 km when measured across the other (the apparent ‘semi-minor' axis).
- "It's likely that we'll be able to observe far more occultations like this by Jupiter's moons in 2019 and 2020," adds Bruno. "Jupiter is passing through a patch of sky that has the galactic center in the background, making it drastically more likely that its moons will pass in front of bright background stars. This would really help us to pin down their three-dimensional shapes and positions – not only for Jupiter's four largest moons, but for smaller, more irregularly-shaped ones, too."
- Using Gaia's second data release, provided in April 2018, the scientists predict the dates of further occultations of bright stars by Europa, Io, Ganymede and Callisto in coming years, and list a total of 10 events through 2019 and 2021. Future events comprise stellar occultations by Europa (22 June 2020), Callisto (20 June 2020, 4 May 2021), Io (9 and 21 September 2019, 2 April 2021), and Ganymede (25 April 2021).
- Three have already taken place in 2019, two of which – stellar occultations by Europa (4 June) and Callisto (5 June) – were also observed by the researchers, and for which the data are still under analysis.
- The upcoming occultations will be observable even with amateur telescopes as small as 20 cm from various regions around the world. The favorable position of Jupiter, with the galactic plane in the background, will only occur again in 2031.
![Figure 7: Upcoming stellar occultations by Jupiter's four largest moons. Astronomers can learn a great deal about a celestial body by observing it as it moves in front of a bright background star: an alignment known as a stellar occultation. Such events are unusual for Jupiter's moons. In fact, until recently, only two of the gas giant's moons – Io and Ganymede – had been observed during stellar occultations. Now, a study presents observations of another of Jupiter's moons, Europa, as it obscured a bright star on 31 March 2017. This event allowed the astronomers to better characterize Europa's size, position in space and in relation to Jupiter, and three-dimensional shape; they used precise data from Gaia's first data release, provided in September 2016, on stellar positions to determine the best location from which to observe the event, and subsequently gathered data from three observatories in Brazil and Chile [image credit: ESA/Gaia/DPAC; Bruno Morgado (Brazilian National Observatory/LIneA, Brazil) et al (2019)]](/api/cms/documents/163813/5389966/Gaia2019_Auto4D.jpeg)
- "Stellar occultation studies allow us to learn about moons in the Solar System from afar, and are also relevant for future missions that will visit these worlds," says Timo Prusti, ESA Gaia Project Scientist. "As this result shows, Gaia is a hugely versatile mission: it not only advances our knowledge of stars, but also of the Solar System more widely."
- An accurate knowledge of Europa's orbit will help to prepare space missions targeting the Jovian system such as ESA's JUICE (JUpiter ICy moons Explorer) and NASA's Europa Clipper, both of which are scheduled for launch in the next decade.
- "These kinds of observations are hugely exciting," says Olivier Witasse, ESA's Juice Project Scientist. "Juice will reach Jupiter in 2029; having the best possible knowledge of the positions of the system's moons will help us to prepare for the mission navigation and future data analysis, and plan all of the science we intend to do.
- "This science depends upon us knowing things such as accurate moon trajectories and understanding how close a spacecraft will come to a given body, so the better our knowledge, the better this planning – and the subsequent data analysis – will be."
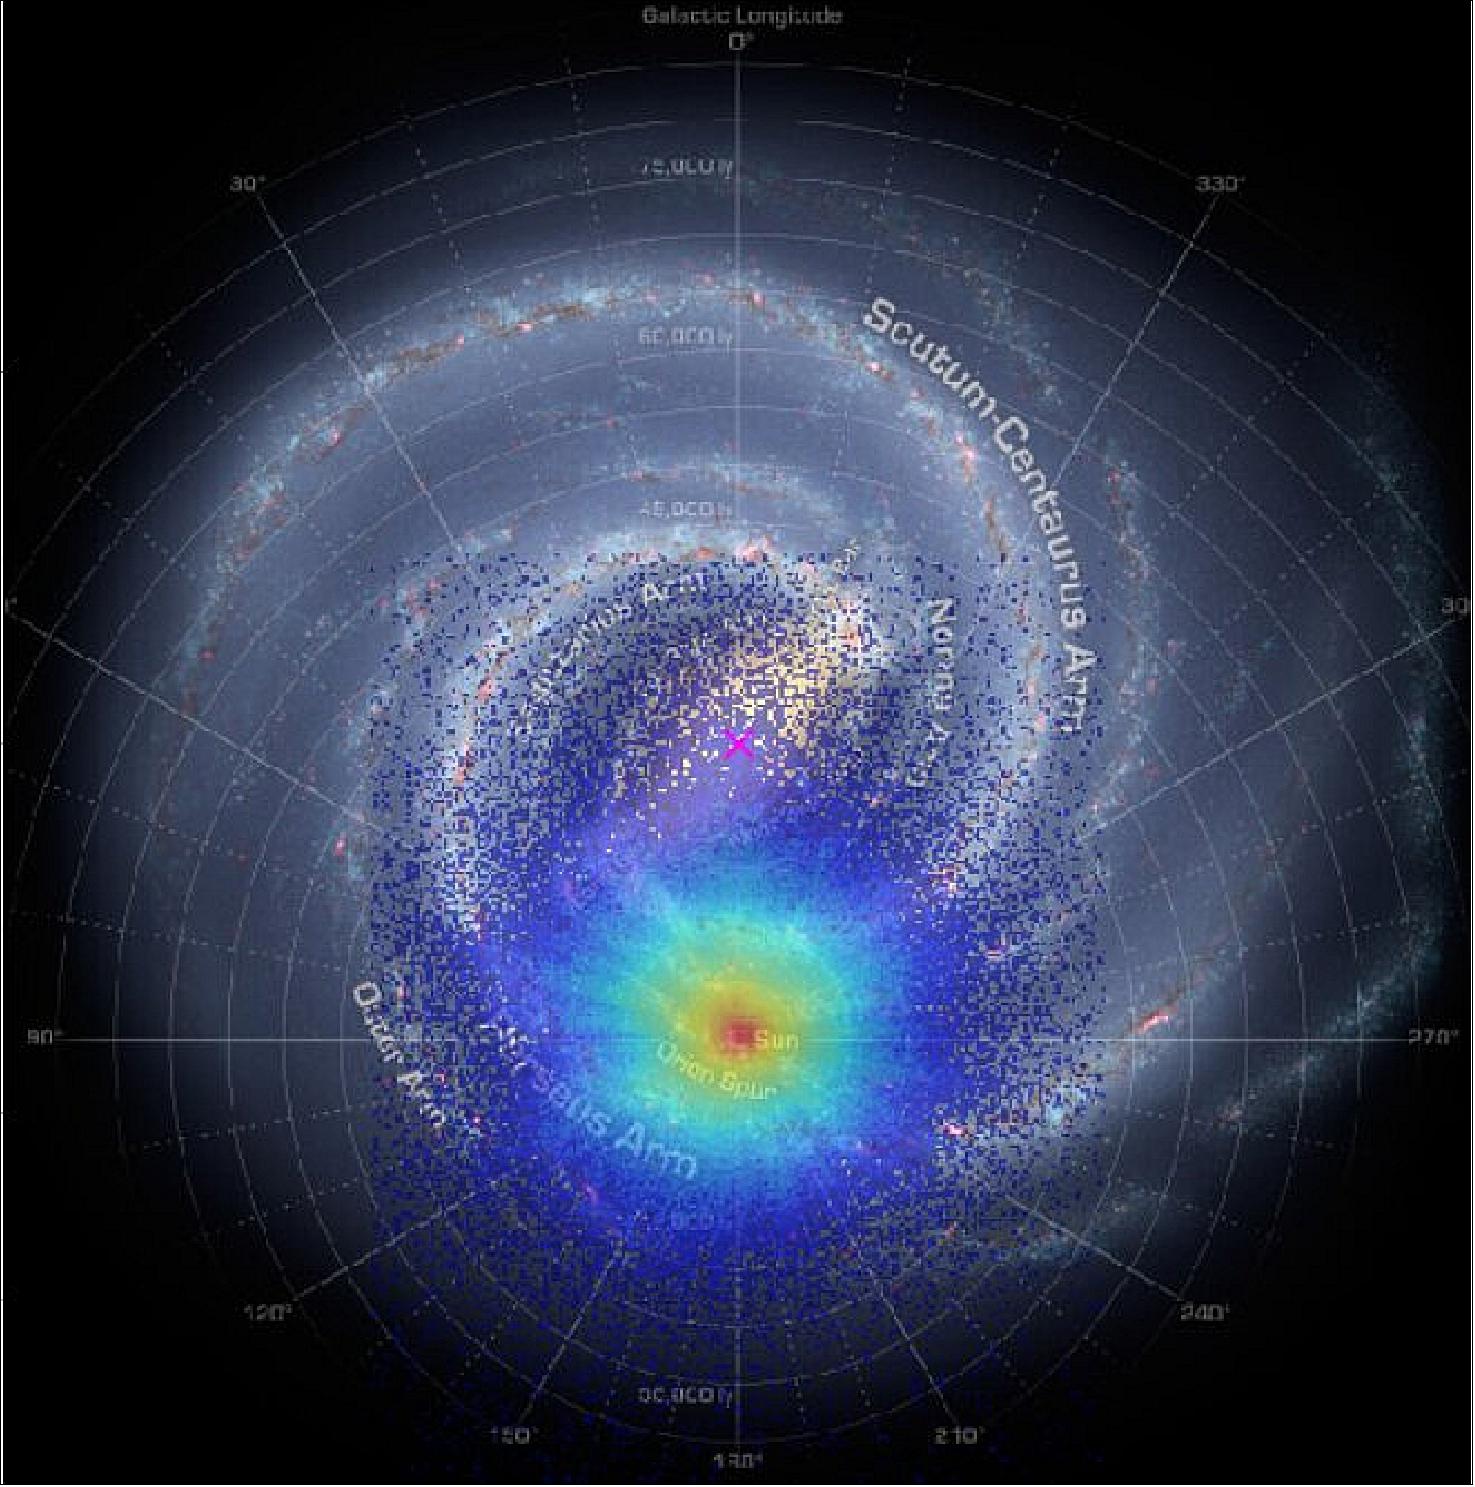
• July 16, 2019: The first direct measurement of the bar-shaped collection of stars at the center of our Milky Way galaxy has been made by combining data from ESA's Gaia mission with complementary observations from ground- and space-based telescopes. 8)
- The second release of data from ESA's Gaia star-mapping satellite, published in 2018, has been revolutionizing many fields of astronomy. The unprecedented catalog contains the brightnesses, positions, distance indicators and motions across the sky for more than one billion stars in our Milky Way galaxy, along with information about other celestial bodies.
- As impressive as this dataset sounds, this is really just the beginning. While the second release is based on the first 22 months of Gaia's surveys, the satellite has been scanning the sky for five years and has many years ahead. New data releases planned in the coming years will steadily improve measurements as well as provide extra information that will enable us to chart our home galaxy and delve into its history like never before.
- Meanwhile, a team of astronomers have combined the latest Gaia data with infrared and optical observations performed from ground and space to provide a preview of what future releases of ESA's stellar surveyor will reveal.
- "We looked in particular at two of the stellar parameters contained in the Gaia data: the surface temperature of stars and the ‘extinction', which is basically a measure of how much dust there is between us and the stars, obscuring their light and making it appear redder," says Friedrich Anders from University of Barcelona, Spain, lead author of the new study. "These two parameters are interconnected, but we can estimate them independently by adding extra information obtained by peering through the dust with infrared observations."
- The team combined the second Gaia data release with several infrared surveys using a computer code called StarHorse, developed by co-author Anna Queiroz and collaborators. The code compares the observations with stellar models to determine the surface temperature of stars, the extinction and an improved estimate of the distance to the stars.
- As a result, the astronomers obtained a much better determination of the distances to about 150 million stars – in some cases, the improvement is up to 20% or more. This enabled them to trace the distribution of stars across the Milky Way to much greater distances than possible with the original Gaia data alone.
- "With the second Gaia data release, we could probe a radius around the Sun of about 6500 light years, but with our new catalog, we can extend this ‘Gaia sphere' by three or four times, reaching out to the center of the Milky Way," explains co-author Cristina Chiappini from Leibniz Institute for Astrophysics Potsdam, Germany, where the project was coordinated.
- There, at the center of our galaxy, the data clearly reveals a large, elongated feature in the three-dimensional distribution of stars: the galactic bar.
- "We know the Milky Way has a bar, like other barred spiral galaxies, but so far we only had indirect indications from the motions of stars and gas, or from star counts in infrared surveys. This is the first time that we see the galactic bar in 3D space, based on geometric measurements of stellar distances," says Friedrich.
- "Ultimately, we are interested in galactic archeology: we want to reconstruct how the Milky Way formed and evolved, and to do so we have to understand the history of each and every one of its components," adds Cristina.
- "It is still unclear how the bar – a large amount of stars and gas rotating rigidly around the center of the galaxy – formed, but with Gaia and other upcoming surveys in the next years we are certainly on the right path to figure it out."
- The team is looking forward to the next data release from the Apache Point Observatory Galaxy Evolution Experiment (APOGEE-2), as well as upcoming facilities such as the 4-meter Multi-Object Survey Telescope (4MOST) at the European Southern Observatory in Chile and the WEAVE (WHT Enhanced Area Velocity Explorer) survey at the William Herschel Telescope (WHT) in La Palma, Canary Islands.
- The third Gaia data release, currently planned for 2021, will include greatly improved distance determinations for a much larger number of stars, and is expected to enable progress in our understanding of the complex region at the center of the Milky Way.
![Figure 10: Revealing the galactic bar. This color chart shows the distribution of 150 million stars in the Milky Way probed using data from the second release of ESA's Gaia mission in combination with infrared and optical surveys, with orange/yellow hues indicating a greater density of stars. Most of these stars are red giants. The distribution is superimposed on an artistic top view of our galaxy. - While the majority of charted stars are located closer to the Sun (the larger orange/yellow blob in the lower part of the image), a large and elongated feature populated by many stars is also visible in the central region of the galaxy: this is the first geometric indication of the galactic bar. - The distances to the stars shown in this chart, along with their surface temperature and extinction – a measure of how much dust there is between us and the stars – were estimated using the StarHorse computer code [image credit: Data: ESA/Gaia/DPAC, A. Khalatyan (AIP) & StarHorse team; Galaxy map: NASA/JPL-Caltech/R. Hurt (SSC/Caltech)]](/api/cms/documents/163813/5389966/Gaia2019_Auto4C.jpeg)
- "With this study, we can enjoy a taster of the improvements in our knowledge of the Milky Way that can be expected from Gaia measurements in the third data release," explains co-author Anthony Brown of Leiden University, The Netherlands, and chair of the Gaia Data Processing and Analysis Consortium Executive.
- "We are revealing features in the Milky Way that we could not see otherwise: this is the power of Gaia, which is enhanced even further in combination with complementary surveys," concludes Timo Prusti, Gaia project scientist at ESA.
- "Photo-astrometric distances, extinctions, and astrophysical parameters for Gaia DR2 stars brighter than G=18" by F. Anders et al. is published in Astronomy & Astrophysics. 9)
- The study combines data from Gaia's second release with the Pan-STARRS1 survey conducted with the first Pan-STARRS telescope in Hawaii, US; the Two Micron All Sky Survey (2MASS) conducted with telescopes in the US and Chile; the AllWISE survey from NASA's Wide-field Infrared Survey Explorer (WISE).
- The computations were conducted at the cluster facility of the Leibniz Institute for Astrophysics Potsdam, Germany.
The new catalogue is available here: https://data.aip.de/projects/starhorse2019.html
• July 15, 2019: On Tuesday 16 July, teams at ESA's mission control will perform an ‘orbit change maneuver' on the Gaia space observatory – the biggest operation since the spacecraft was launched in 2013. 10)
- Gaia is on a mission to survey more than a billion stars, charting the largest three-dimensional map of our galaxy, the Milky Way. In so doing, the spacecraft is revealing the composition, formation and evolution of our galaxy, and a whole lot more.
- For the last five and a half years, the spacecraft has travelled in an orbit designed to keep it out of Earth's shadow, the second Lagrange point.
- At 1.5 million km from Earth – four times further than the Moon – the ‘L2' is a fabulous place from which to do science. As the Sun, Earth and Moon are all in one direction relative to the spacecraft, the rest of the sky is free to observe.
- Placing Gaia in L2 has also ensured the star-catcher's stability, because to this day it has never passed into Earth's shadow. This has kept the spacecraft undisturbed by any change in temperature or varying infrared radiation that would result from an Earth eclipse.
- Although at the end of its planned lifetime, Gaia still has fuel in the tank and a lot more science to do, and so its mission continues. However, its eclipse-dodging path will not. In August and November of this year, without measures to change its orbit, the billion-star hunter will become partially shrouded by Earth's shadow.

Eclipse avoidance
- To keep Gaia safe from these shady possibilities, operators at ESA's mission control are planning the ‘Whitehead eclipse avoidance maneuver'.
- On 16 July, Gaia will use a combination of its onboard thrusters to push it in a diagonal direction, away from the shadow, in a special technique known as 'thrust vectoring'.
- "We've named this operation after a great colleague of ours, Gary Whitehead, who sadly passed away last month after serving on the Flight Control Team for more than 11 years," says David Milligan, Spacecraft Operations Manager for the mission.
- "The maneuver will allow us to change Gaia's orbit without having to turn the spacecraft body, keeping sunlight safely away from its extremely sensitive telescope."
The world's most stable space observatory
- Gaia is an incredibly stable spacecraft. In fact, it is many, many times more stable – and therefore precise – than any other spacecraft in operation today.
- "In space, stability takes time to establish," explains David. "Because any temperature change or unusual movement could take weeks to diminish or dampen, we always limit the time where special activities are performed that disturb scientific observations."
- "As well as the Whitehead maneuver, we will perform some maintenance and calibration activities on the spacecraft's complex subsystems, which would otherwise have disturbed Gaia's science."
- Because of its position and unparalleled precision, Gaia is one of the most productive spacecraft out there. Last year alone, more than 800 scientific papers were published based on its observations.
• June 28, 2019: Each year on 30 June, the worldwide UN-sanctioned Asteroid Day takes place to raise awareness about asteroids and what can be done to protect Earth from possible impact. The day falls on the anniversary of the Tunguska event that took place on 30 June 1908, the most harmful known asteroid related event in recent history. 11)
- While Gaia's main scientific goal is to chart a billion stars in our Milky Way galaxy, the satellite is also sensitive to celestial bodies closer to home, regularly observing known asteroids and occasionally discovering new ones.
- Three of the newly discovered asteroids, temporarily designated as 2018 YK4, 2018 YL4 and 2018 YM4, were first spotted by Gaia in December 2018, and later confirmed by follow-up observations performed with the Haute-Provence Observatory in France, which enabled scientists to determine their orbits. Comparing these informations with existing observations indicated the objects had not been detected earlier.
- The fourth discovery, an asteroid with temporary designation 2019 CZ10, was first detected by Gaia in February, and was recently confirmed by ground-based observations by the Mount Lemmon Survey and the Pan-STARRS 1 project in the US.
- These four asteroids, while part of the ‘main belt' between the orbits of Mars and Jupiter, move around the Sun on orbits that have a greater tilt (15 degrees or more) with respect to the orbital plane of planets than most main-belt asteroids.
- The population of such high-inclination asteroids is not as well studied as those with less tilted orbits, since most surveys tend to focus on the plane where the majority of asteroids reside. But Gaia can readily observe them as it scans the entire sky from its vantage point in space, so it is possible that the satellite will find more such objects in the future and contribute new information to study their properties.
- Alongside the extensive processing and analysis of Gaia's data in preparation for subsequent data releases, preliminary information about Gaia's asteroid detections are regularly shared via an online alert system so that astronomers across the world can perform follow-up observations.
- This animation starts showing the position of planets, asteroids and stars on Asteroid Day, 30 June 2019; time has been speeded up by 5 million.
- Acknowledgement: Gaia Data Processing and Analysis Consortium (DPAC); Gaia Coordinating Unit 4; B. Carry, F. Spoto, P. Tanga (Observatoire de la Côte d'Azur, France) & W. Thuillot (IMCCE, Observatoire de Paris, France); Gaia Data Processing Center at CNES, Toulouse, France; Animation: Gaia Sky; S. Jordan / T. Sagristà, Astronomisches Rechen-Institut, Zentrum für Astronomie der Universität Heidelberg, Germany.
• May 9, 2019: A team led by researchers of the Institute of Cosmos Sciences of the University of Barcelona (ICCUB, UB-IEEC) and the Besançon Astronomical Observatory have analyzed data from the Gaia satellite and found that a heavy star formation burst occurred in the Milky Way about 3,000 million years ago. During this process, more than 50 percent of the stars that created the galactic disc may have been born. These results are derived from the combination of the distances, colors and magnitude of the stars that were measured by Gaia with models that predict their distribution in our galaxy. The study has been published in the journal Astronomy & Astrophysics. 12) 13)
- Like a flame fades when there is no gas in the cylinder, the rhythm of the stellar formation in the Milky Way, fueled by deposited gas, is predicted to decrease slowly and in a continuous way as the existing gas is extinguished. The results of the study show that although this process took place over the first 4,000 million years of Milky Way disc formation, a severe star formation burst, or "stellar baby boom," inverted this trend. A gas-rich satellite galaxy merged with the Milky Way, and could have introduced new fuel and reactivated the process of stellar formation. This mechanism would explain the distribution of distances, ages and masses that are estimated from the data taken from the European Space Agency Gaia satellite.
- "The time scale of this star formation burst, together with the great stellar mass involved in the process—thousands of millions of solar masses—suggests the disc of our galaxy did not have a steady and paused evolution. It may have suffered an external perturbation that began about 5 billion years ago," said Roger Mor, ICCUB researcher and first signer of the article.
- "We have been able to find this out by analyzing the precise distances for more than 3 million stars in the solar environment," says Roger Mor. "Thanks to these data, we could discover the mechanisms that controlled the evolution more than 8 to 10 billion years ago in the disc of our galaxy, which is not more than the bright band we see in the sky on a dark night and with no light pollution." Like in many research fields these days, these findings are possible thanks to the availability of the combination of a great amount of unprecedented precision data, and many hours of computing.
- Cosmologic models predict our galaxy would have been growing due the merging with other galaxies, a fact that has been stated by other studies using Gaia data. One of these merges could be the cause of the severe star formation burst that was detected in this study.
- "Actually, the peak of star formation is so clear, unlike predictions from before Gaia data availability, that we thought it necessary to treat its interpretation together with experts on cosmological evolution of external galaxies," notes Francesca Figuerars, lecturer at the Department of Quantum Physics and Astrophysics of the UB, ICCUB member and signer of the article.
- Santi Roca-Fàbrega from the Complutense University of Madrid, an expert in stellar modeling and co-author, said, "The obtained results match with what the current cosmological models predict, and what is more, our galaxy seen from Gaia's eyes is an excellent cosmological laboratory where we can test and confront models at a bigger scale in the universe."
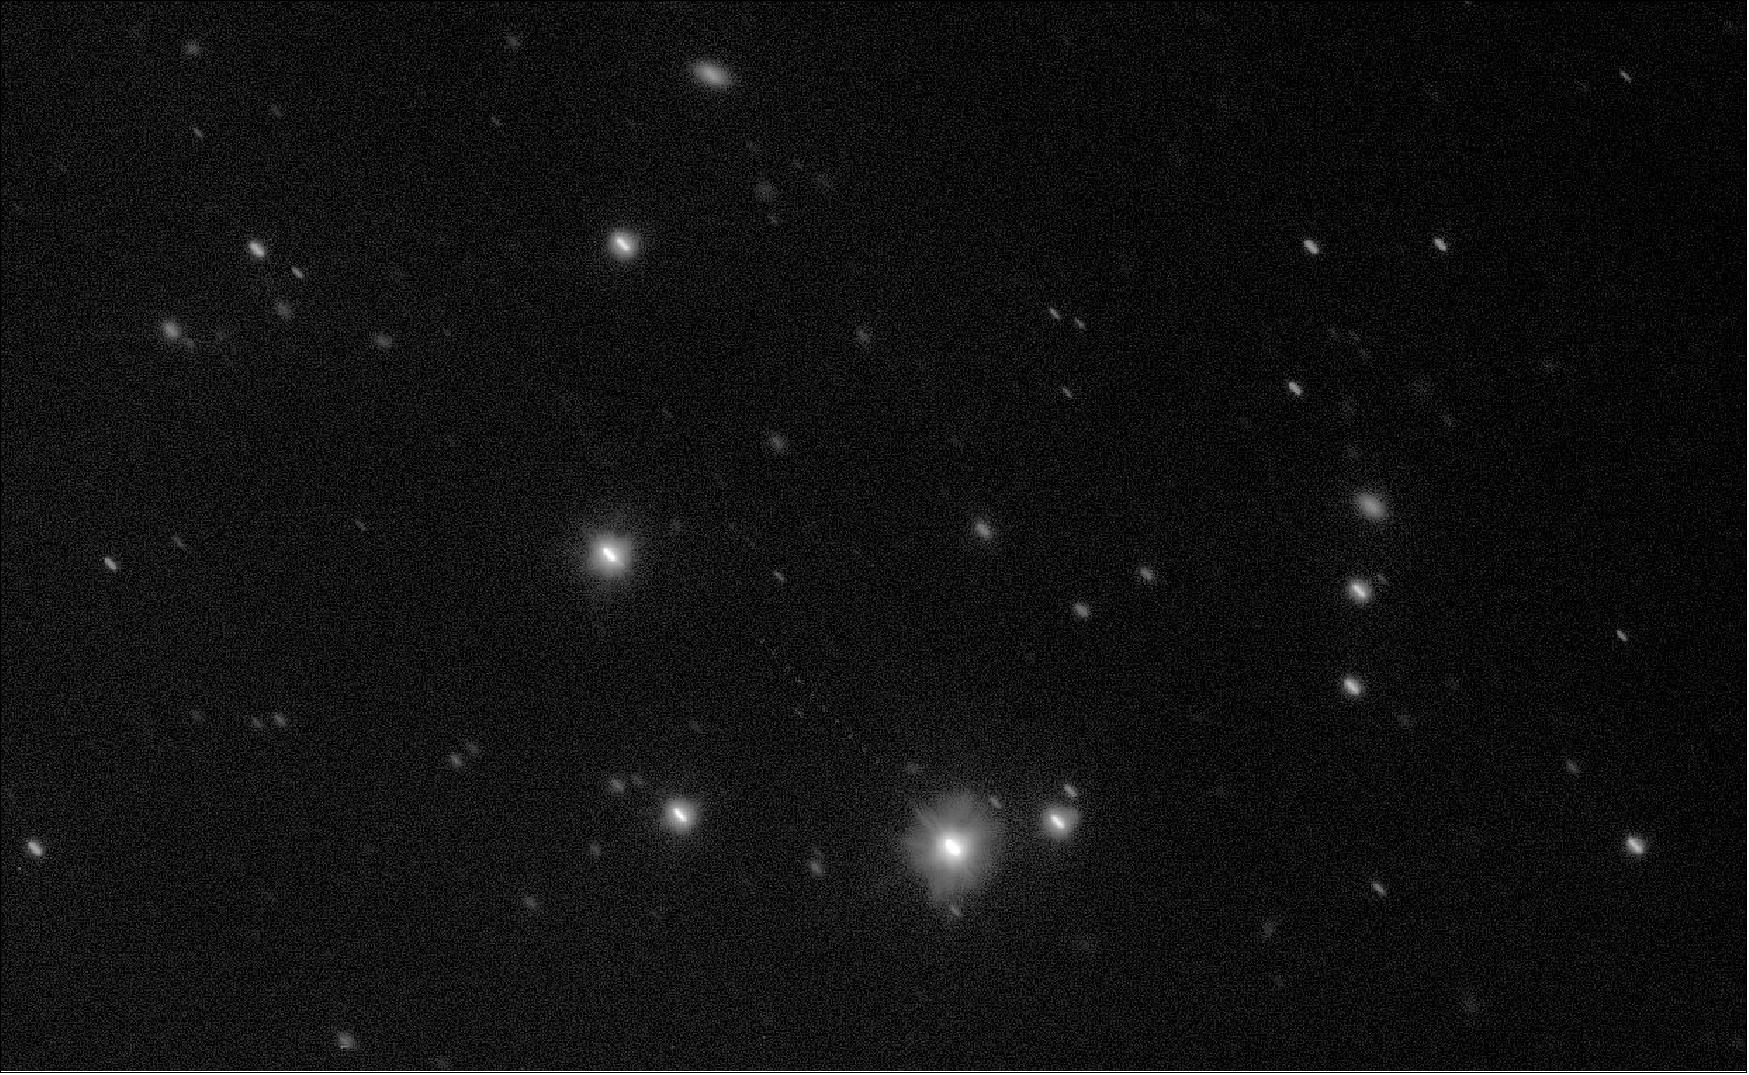
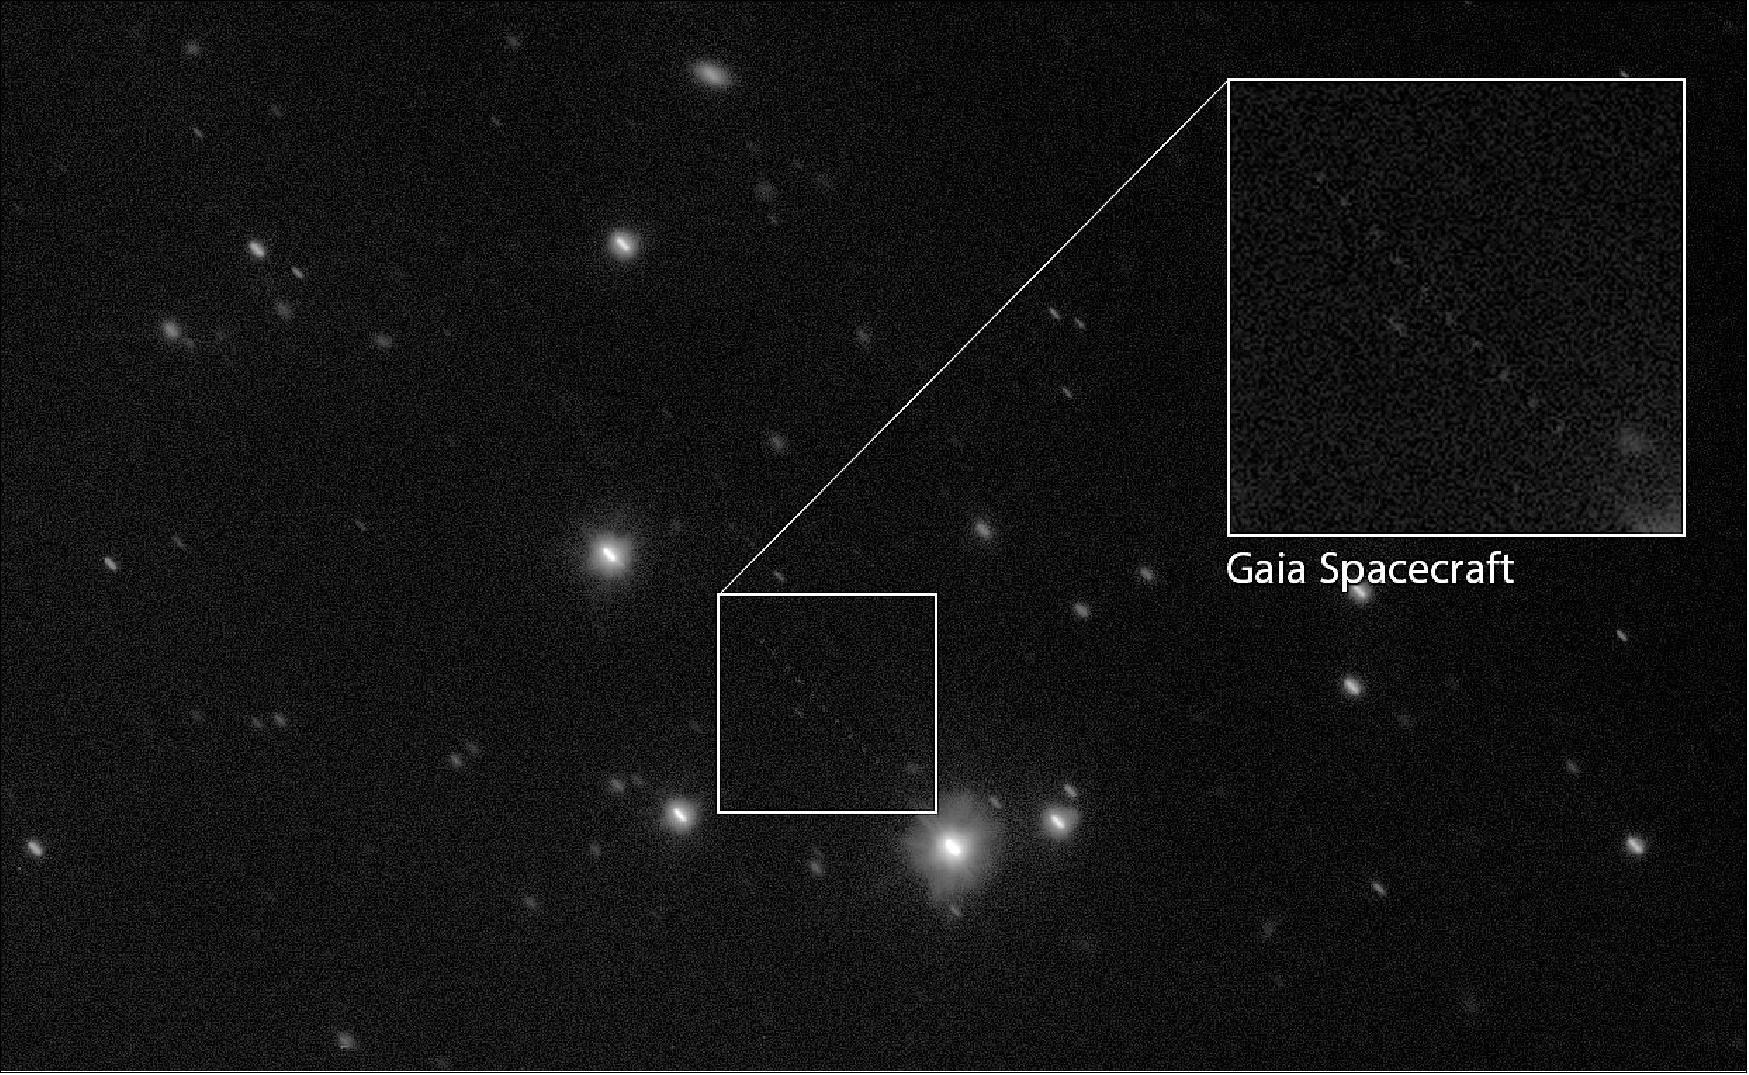
• May 2, 2019: While ESA's Gaia mission has been surveying more than one billion stars from space, astronomers have been regularly monitoring the satellite's position in the sky with telescopes across the world, including the European Southern Observatory in Chile, to further refine Gaia's orbit and ultimately improve the accuracy of its stellar census. 14) 15)
- One year ago, the Gaia mission released its much-awaited second set of data, which included high-precision measurements – positions, distance indicators and proper motions – of more than one billion stars in our Milky Way galaxy.
- The catalog, based on less than two years of observations and almost four years of data processing and analysis by a collaboration of about 450 scientists and software engineers, has enabled transformational studies in many fields of astronomy, generating more than 1000 scientific publications in the past twelve months.
- Meanwhile in space, Gaia keeps scanning the sky and gathering data that is being crunched for future releases to achieve even higher precision on the position and motion of stars and enable ever deeper and more detailed studies into our place in the cosmos. But to reach the accuracy expected for Gaia's final catalogue, it is crucial to pinpoint the position and motion of the satellite from Earth.
- To this aim, the flight dynamics experts at ESA's operations center make use of a combination of techniques, from traditional radio tracking and ranging to simultaneous observing using two radio antennas – the so-called delta-DOR method.
Legend to Figure 17: Gaia's telescopes point at two different portions of the sky, separated by a constant 106.5°. Therefore, objects arrive in the second field of view 106.5 minutes after they are observed in the first. Meanwhile its spin axis precesses around the Sun with a period of about 63 days, allowing different parts of the sky to be scanned. This scanning strategy builds up an interlocking grid of positions, providing absolute – rather than relative – values of the stellar positions and motions. The spacecraft spin axis makes an angle of 45° with the Sun direction, ensuring that the payload is shaded from the Sun, but that the solar arrays can still produce electricity efficiently.
- In a unique and novel approach for ESA, the ground-based tracking of Gaia also includes optical observations provided by a network of medium-size telescopes across the planet.
- The European Southern Observatory's (ESO) 2.6 m VLT Survey Telescope (VST) in Chile records Gaia's position in the sky for about 180 nights every year.
- "This is an exciting ground-space collaboration, using one of ESO's world-class telescopes to anchor the trailblazing observations of ESA's billion star surveyor," says Timo Prusti, Gaia project scientist at ESA.
- "The VST is the perfect tool for picking out the motion of Gaia," adds Ferdinando Patat, head of the ESO's Observing Programs Office. "Using one of ESO's first-rate ground-based facilities to bolster cutting-edge space observations is a fine example of scientific cooperation."
- In addition, the 2 m Liverpool telescope located on La Palma, Canary Islands, Spain, and the Las Cumbres Optical Global Telescope Network, which operates 2 m telescopes in Australia and the US, have also been observing Gaia over the past five years as part of the Ground Based Optical Tracking (GBOT) campaign.
- "Gaia observations require a special observing procedure," explains Monika Petr-Gotzens, who has coordinated the execution of ESO's observations of Gaia since 2013. "The spacecraft is what we call a ‘moving target', as it is moving quickly relative to background stars – tracking Gaia is quite the challenge!"
- In these images Gaia is a mere dot of light among the many stars that the satellite itself has been measuring, so painstaking calibration is needed to transform this body of observations into meaningful data that can be included in the determination of the satellite's orbit.
- This required using data from Gaia's second release to identify the stars in each of the images collected over the past five years and calculate the satellite's position in the sky with a precision of 20 mas or better (one arcsecond is equivalent to the size of a Euro coin seen from a distance of about 4 km).
- The ground-based observations also provide key information to improve the determination of Gaia's velocity through space, which must be known to the precision of a few mm/s. This is necessary to correct for a phenomenon known as aberration of light – an apparent distortion in the direction of incoming light due to the relative motion between the source and an observer – in a way similar to tilting one's umbrella while walking through the rain.
- "After careful and lengthy data processing, we have now achieved the accuracy required for the ground-based observations of Gaia to be implemented as part of the orbit determination," says Martin Altmann, lead of the GBOT campaign from the Astronomisches Rechen-Institut, Center for Astronomy of Heidelberg University, Germany, who works in close collaboration with colleagues from the Paris Observatory in France.
- The GBOT information will be used to improve our knowledge of Gaia's orbit not only in observations to come, but also for all the data that have been gathered from Earth in the previous years, leading to improvements in the data products that will be included in future releases.
• April 29, 2019: While scanning the sky to chart a billion stars in our Milky Way galaxy, ESA's Gaia satellite is also sensitive to celestial bodies closer to home, and regularly observes asteroids 16) in our Solar System. 17)
- Most asteroids that Gaia detects are already known, but every now and then, the asteroids seen by ESA's Milky Way surveyor do not match any existing observations. This is the case for the three orbits shown in grey in this view: these are Gaia's first asteroid discoveries.
- The three new asteroids were first spotted by Gaia in December 2018, and later confirmed by follow-up observations performed with the Haute-Provence Observatory in France, which enabled scientists to determine their orbits. Comparing these informations with existing observations indicated the objects had not been detected earlier.
- While they are part of the main belt of asteroids, all three move around the Sun on orbits that have a greater tilt (15 degrees or more) with respect to the orbital plane of planets than most main-belt asteroids.
- The population of such high-inclination asteroids is not as well studied as those with less tilted orbits, since most surveys tend to focus on the plane where the majority of asteroids reside. But Gaia can readily observe them as it scans the entire sky from its vantage point in space, so it is possible that the satellite will find more such objects in the future and contribute new information to study their properties.
- Alongside the extensive processing and analysis of Gaia's data in preparation for subsequent data releases, preliminary information about Gaia's asteroid detections are regularly shared via an online alert system so that astronomers across the world can perform follow-up observations. To observe these asteroids, a 1-m or larger telescope is needed.
- Once an asteroid detected by Gaia has been identified also in ground-based observations, the scientists in charge of the alert system analyze the data to determine the object's orbit. In case the ground observations match the orbit based on Gaia's data, they provide the information to the Minor Planet Center, which is the official worldwide organization collecting observational data for small Solar System bodies like asteroids and comets.
- This process may lead to new discoveries, like the three asteroids with orbits depicted in this image, or to improvements in the determination of the orbits of known asteroids, which are sometimes very poorly known. So far, several tens of asteroids detected by Gaia have been observed from the ground in response to the alert system, all of them belonging to the main belt, but it is possible that also near-Earth asteroids will be spotted in the future.
- A number of observatories across the world are already involved in these activities, including the Haute-Provence Observatory, Kyiv Comet station, Odessa-Mayaki, Terskol, C2PU at Observatoire de la Côte d'Azur and Las Cumbres Observatory Global Telescope Network. The more that join, the more we will learn about asteroids – known and new ones alike.
- Acknowledgement: Gaia Data Processing and Analysis Consortium (DPAC); Gaia Coordinating Unit 4; B. Carry, F. Spoto, P. Tanga (Observatoire de la Côte d'Azur, France) & W. Thuillot (IMCCE, Observatoire de Paris, France); Gaia Data Processing Center at CNES, Toulouse, France.
• March 7, 2019: In a striking example of multi-mission astronomy, measurements from the NASA/ESA Hubble Space Telescope and the ESA Gaia mission have been combined to improve the estimate of the mass of our home galaxy the Milky Way: 1.5 trillion (1.5 x 10¹²) solar masses. 18)
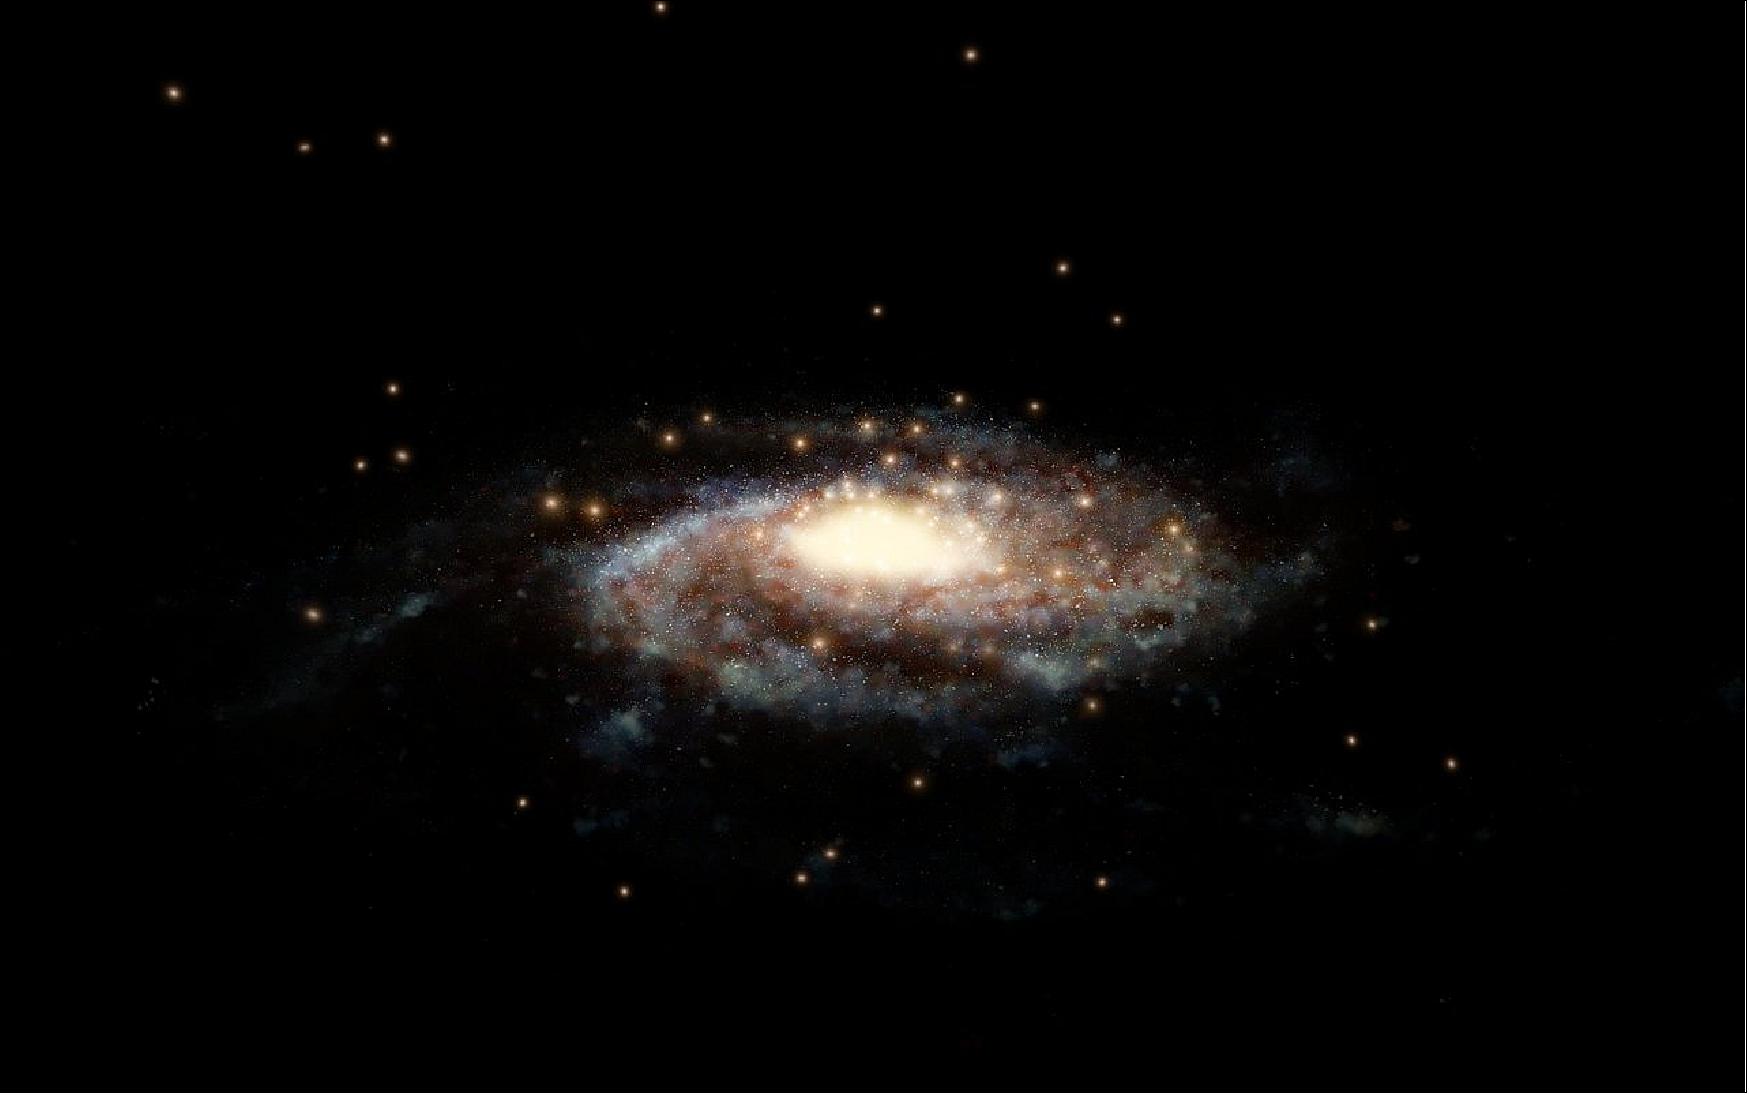
- The mass of the Milky Way is one of the most fundamental measurements astronomers can make about our galactic home. However, despite decades of intense effort, even the best available estimates of the Milky Way's mass disagree wildly. Now, by combining new data from the European Space Agency (ESA) Gaia mission with observations made with the NASA/ESA Hubble Space Telescope, astronomers have found that the Milky Way weighs in at about 1.5 trillion solar masses within a radius of 129,000 light-years from the galactic center.
- Previous estimates of the mass of the Milky way ranged from 500 billion (500 x 109) to 3 trillion (3 x 10¹²) times the mass of the Sun. This huge uncertainty arose primarily from the different methods used for measuring the distribution of dark matter – which makes up about 90% of the mass of the galaxy.
- "We just can't detect dark matter directly," explains Laura Watkins (European Southern Observatory, Germany), who led the team performing the analysis. "That's what leads to the present uncertainty in the Milky Way's mass – you can't measure accurately what you can't see!"
- Given the elusive nature of the dark matter, the team had to use a clever method to weigh the Milky Way, which relied on measuring the velocities of globular clusters – dense star clusters that orbit the spiral disc of the galaxy at great distances.
Note: Globular clusters formed prior to the construction of the Milky Way's spiral disk, where our Sun and the Solar System later formed. Because of their great distances, globular star clusters allow astronomers to trace the mass of the vast envelope of dark matter surrounding our galaxy far beyond the spiral disk.
- "The more massive a galaxy, the faster its clusters move under the pull of its gravity" explains N. Wyn Evans (University of Cambridge, UK). "Most previous measurements have found the speed at which a cluster is approaching or receding from Earth, that is the velocity along our line of sight. However, we were able to also measure the sideways motion of the clusters, from which the total velocity, and consequently the galactic mass, can be calculated."
Note: The total velocity of an object is made up of three motions – a radial motion plus two defining the sideway motions. However, in astronomy most often only line-of-sight velocities are available. With only one component of the velocity available, the estimated masses depend very strongly on the assumptions for the sideway motions. Therefore measuring the sideway motions directly significantly reduces the size of the error bars for the mass.
- The group used Gaia's second data release as a basis for their study. Gaia was designed to create a precise three-dimensional map of astronomical objects throughout the Milky Way and to track their motions. Its second data release includes measurements of globular clusters as far as 65,000 light-years from Earth.
- "Global clusters extend out to a great distance, so they are considered the best tracers astronomers use to measure the mass of our galaxy" said Tony Sohn of STScI (Space Telescope Science Institute), Baltimore, MD, USA, who led the Hubble measurements.
- The team combined these data with Hubble's unparalleled sensitivity and observational legacy. Observations from Hubble allowed faint and distant globular clusters, as far as 130,000 light-years from Earth, to be added to the study. As Hubble has been observing some of these objects for a decade, it was possible to accurately track the velocities of these clusters as well.
- "We were lucky to have such a great combination of data," explained Roeland P. van der Marel of STScI. "By combining Gaia's measurements of 34 globular clusters with measurements of 12 more distant clusters from Hubble, we could pin down the Milky Way's mass in a way that would be impossible without these two space telescopes."
- Until now, not knowing the precise mass of the Milky Way has presented a problem for attempts to answer a lot of cosmological questions. The dark matter content of a galaxy and its distribution are intrinsically linked to the formation and growth of structures in the Universe. Accurately determining the mass for the Milky Way gives us a clearer understanding of where our galaxy sits in a cosmological context. 19)
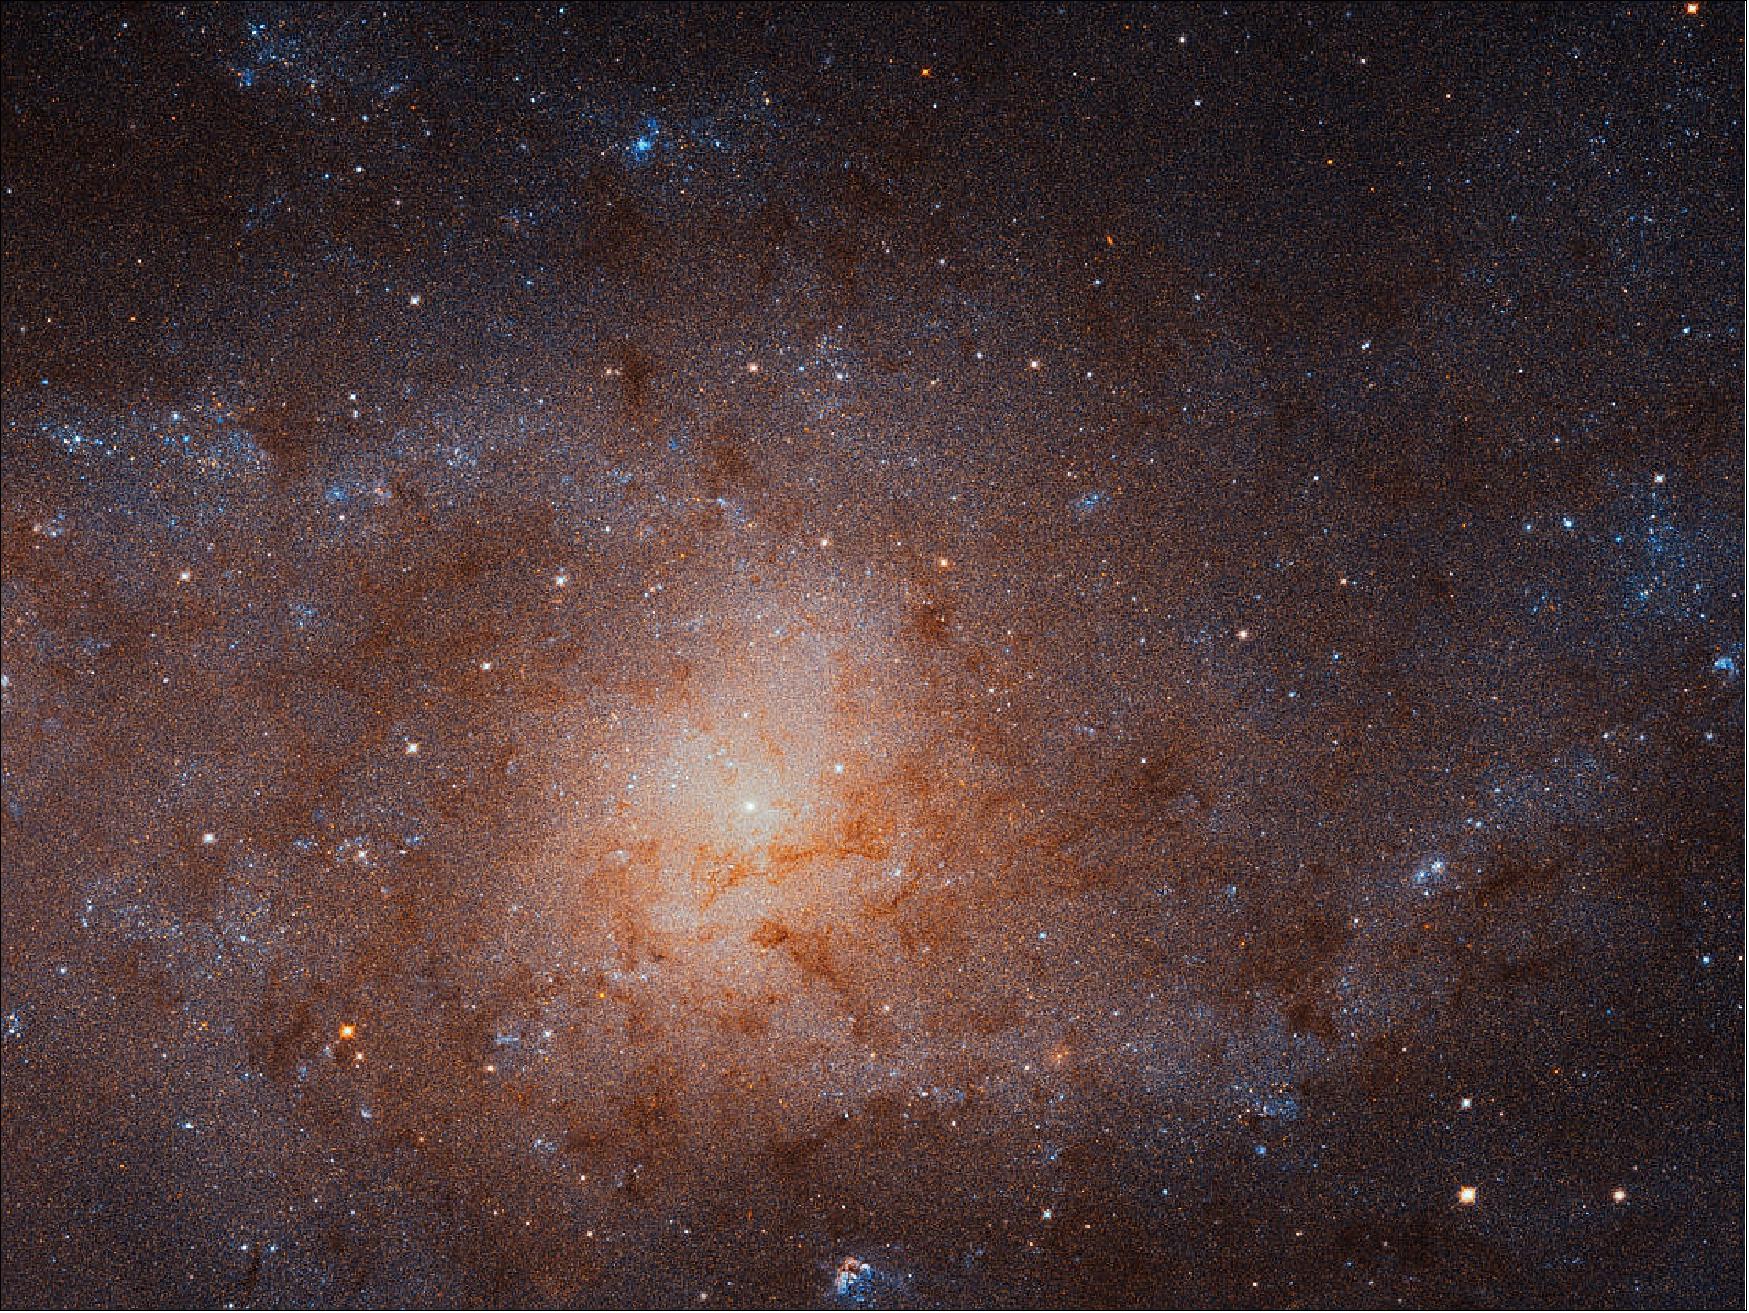
• February 26, 2019: ESA's Gaia satellite is on a mission: to map and characterize more than one billion of the stars in the Milky Way. Many of these stars reside in complex, eye-catching clusters scattered throughout our Galaxy and, by studying these stellar groupings, Gaia is revealing much about the formation and evolution of stars in our cosmic home and surroundings. 20)
- The Milky Way is full of stars. Our Galaxy contains over a hundred billion of them, from dwarf to giant, populating its crowded center and its spiralling disc.
- Many of these stars are thought to have formed in the same way: from huge clouds of cool, condensing molecular gas, which collapse under the influence of gravity and fragment to form groups of hundreds to thousands of stars, known as star clusters. Some of these clusters last thousands of millions of years, while others disperse rapidly, releasing their stellar residents into the Milky Way's disc.
- It is likely that also our Sun formed in a cluster some 4.5 billion years ago, and the quest for solar siblings – stars that were born in the same cluster as the Sun and then went on different paths – will provide important information on the birth of our parent star.
- Despite our growing knowledge, many open questions remain. For instance, how many clusters exist, how many are currently being formed, how many are falling apart – and at what pace? The incredible diversity of stars and their birth clusters is currently being explored by ESA's Gaia satellite.
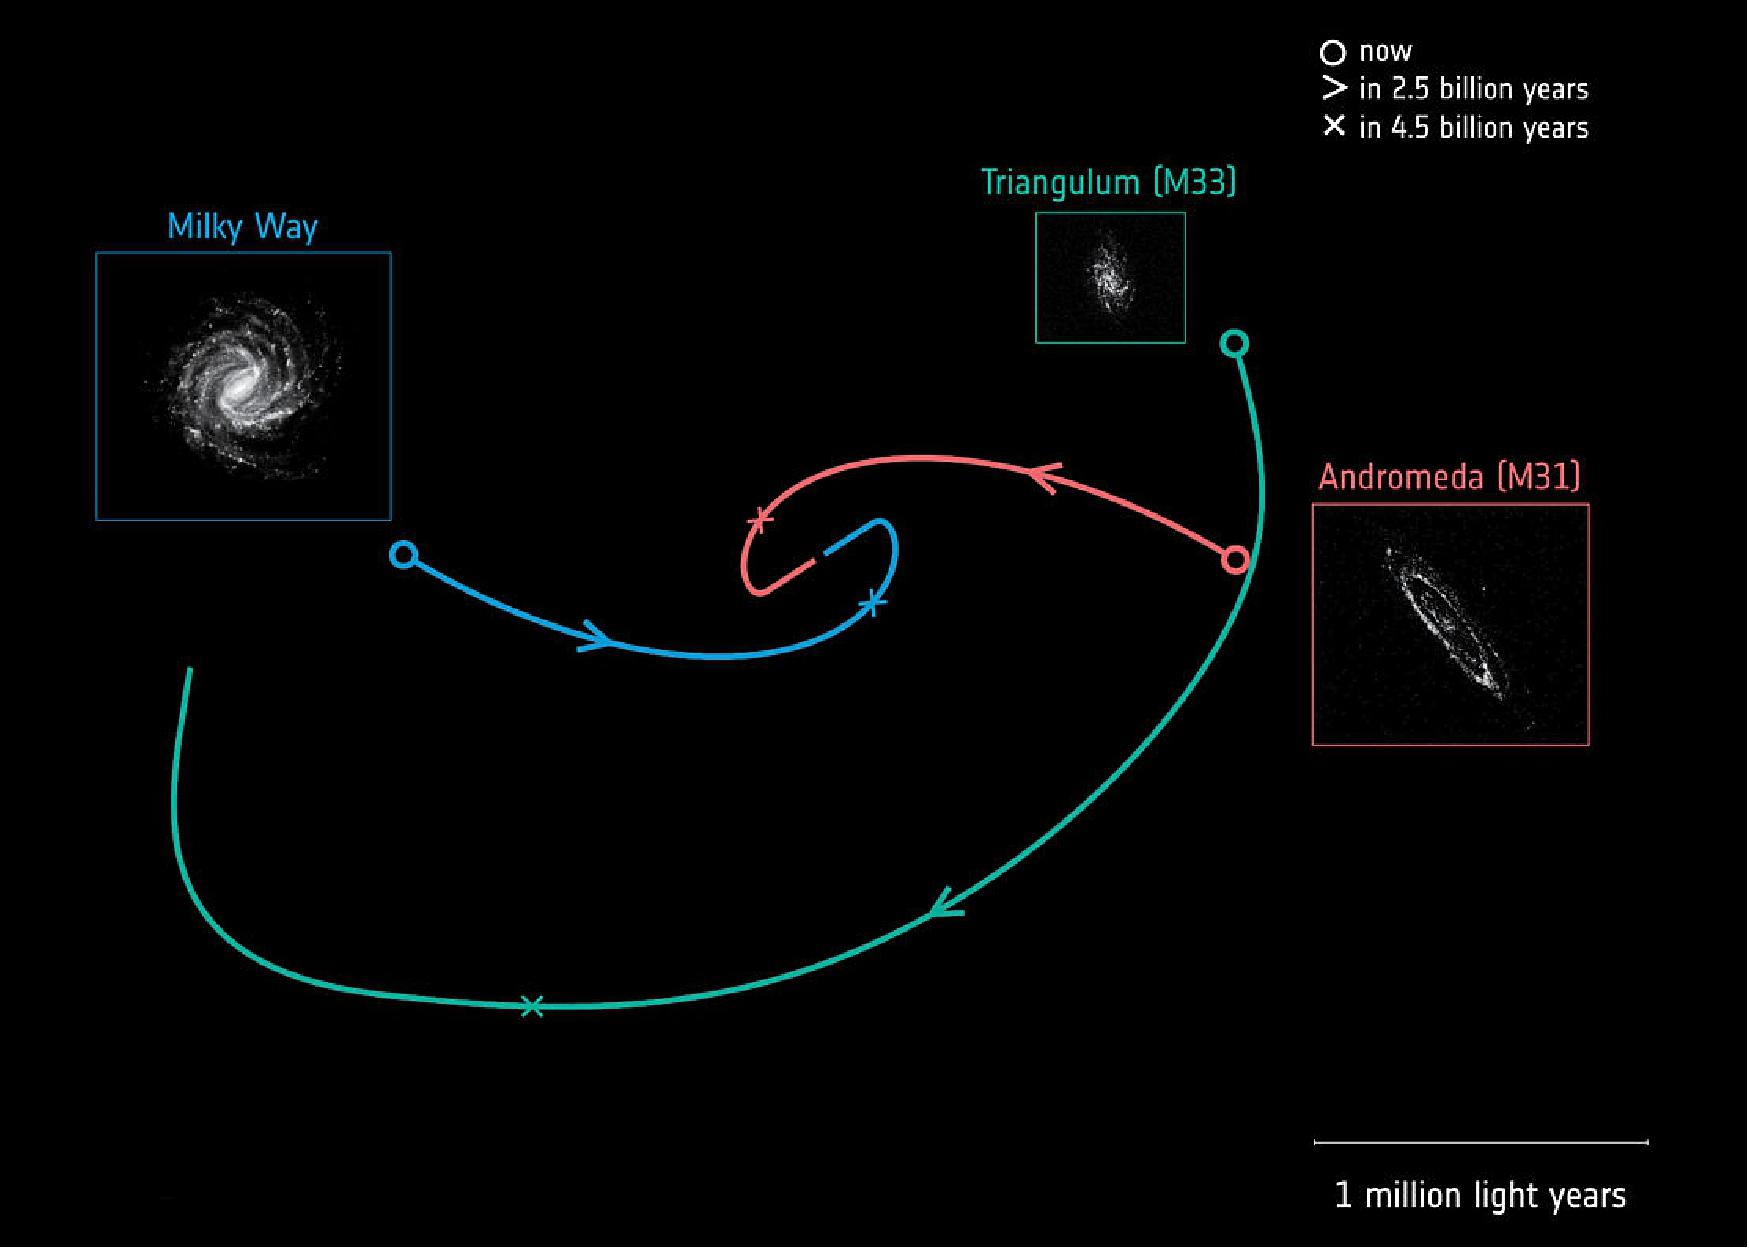
• February 7, 2019: ESA's Gaia satellite has looked beyond our Galaxy and explored two nearby galaxies to reveal the stellar motions within them and how they will one day interact and collide with the Milky Way – with surprising results. 21)
- Our Milky Way belongs to a large gathering of galaxies known as the Local Group and, along with the Andromeda and Triangulum galaxies – also referred to as M31 and M33, respectively – makes up the majority of the group's mass.
- Astronomers have long suspected that Andromeda will one day collide with the Milky Way, completely reshaping our cosmic neighborhood. However, the three-dimensional movements of the Local Group galaxies remained unclear, painting an uncertain picture of the Milky Way's future.
- "We needed to explore the galaxies' motions in 3D to uncover how they have grown and evolved, and what creates and influences their features and behavior," says lead author Roeland van der Marel of the STScI (Space Telescope Science Institute) in Baltimore, USA. "We were able to do this using the second package of high-quality data released by Gaia." 22)
- Gaia is currently building the most precise 3D map of the stars in the nearby Universe, and is releasing its data in stages. The data from the second release, made in April 2018, was used in this research.
- Previous studies of the Local Group have combined observations from telescopes including the NASA/ESA Hubble Space Telescope and the ground-based Very Long Baseline Array to figure out how the orbits of Andromeda and Triangulum have changed over time. The two disc-shaped spiral galaxies are located between 2.5 and 3 million light-years from us, and are close enough to one another that they may be interacting.
- Two possibilities emerged: either Triangulum is on an incredibly long six-billion-year orbit around Andromeda but has already fallen into it in the past, or it is currently on its very first infall. Each scenario reflects a different orbital path, and thus a different formation history and future for each galaxy.
- While Hubble has obtained the sharpest view ever of both Andromeda and Triangulum, Gaia measures the individual position and motion of many of their stars with unprecedented accuracy.
- "We combed through the Gaia data to identify thousands of individual stars in both galaxies, and studied how these stars moved within their galactic homes," adds co-author Mark Fardal, also of Space Telescope Science Institute.
- "While Gaia primarily aims to study the Milky Way, it's powerful enough to spot especially massive and bright stars within nearby star-forming regions – even in galaxies beyond our own."
- The stellar motions measured by Gaia not only reveal how each of the galaxies moves through space, but also how each rotates around its own spin axis.
- A century ago, when astronomers were first trying to understand the nature of galaxies, these spin measurements were much sought-after, but could not be successfully completed with the telescopes available at the time.
- "It took an observatory as advanced as Gaia to finally do so," says Roeland.
- "For the first time, we've measured how M31 and M33 rotate on the sky. Astronomers used to see galaxies as clustered worlds that couldn't possibly be separate ‘islands', but we now know otherwise.
- "It has taken 100 years and Gaia to finally measure the true, tiny, rotation rate of our nearest large galactic neighbor, M31. This will help us to understand more about the nature of galaxies."
- By combining existing observations with the new data release from Gaia, the researchers determined how Andromeda and Triangulum are each moving across the sky, and calculated the orbital path for each galaxy both backwards and forwards in time for billions of years.
- "The velocities we found show that M33 cannot be on a long orbit around M31," says co-author Ekta Patel of the University of Arizona, USA. "Our models unanimously imply that M33 must be on its first infall into M31."
- While the Milky Way and Andromeda are still destined to collide and merge, both the timing and destructiveness of the interaction are also likely to be different than expected.
- As Andromeda's motion differs somewhat from previous estimates, the galaxy is likely to deliver more of a glancing blow to the Milky Way than a head-on collision. This will take place not in 3.9 billion years' time, but in 4.5 billion – some 600 million years later than anticipated.
- "This finding is crucial to our understanding of how galaxies evolve and interact," says Timo Prusti, ESA Gaia Project Scientist.
- "We see unusual features in both M31 and M33, such as warped streams and tails of gas and stars. If the galaxies haven't come together before, these can't have been created by the forces felt during a merger. Perhaps they formed via interactions with other galaxies, or by gas dynamics within the galaxies themselves."
- "Gaia was designed primarily for mapping stars within the Milky Way — but this new study shows that the satellite is exceeding expectations, and can provide unique insights into the structure and dynamics of galaxies beyond the realm of our own. The longer Gaia watches the tiny movements of these galaxies across the sky, the more precise our measurements will become."
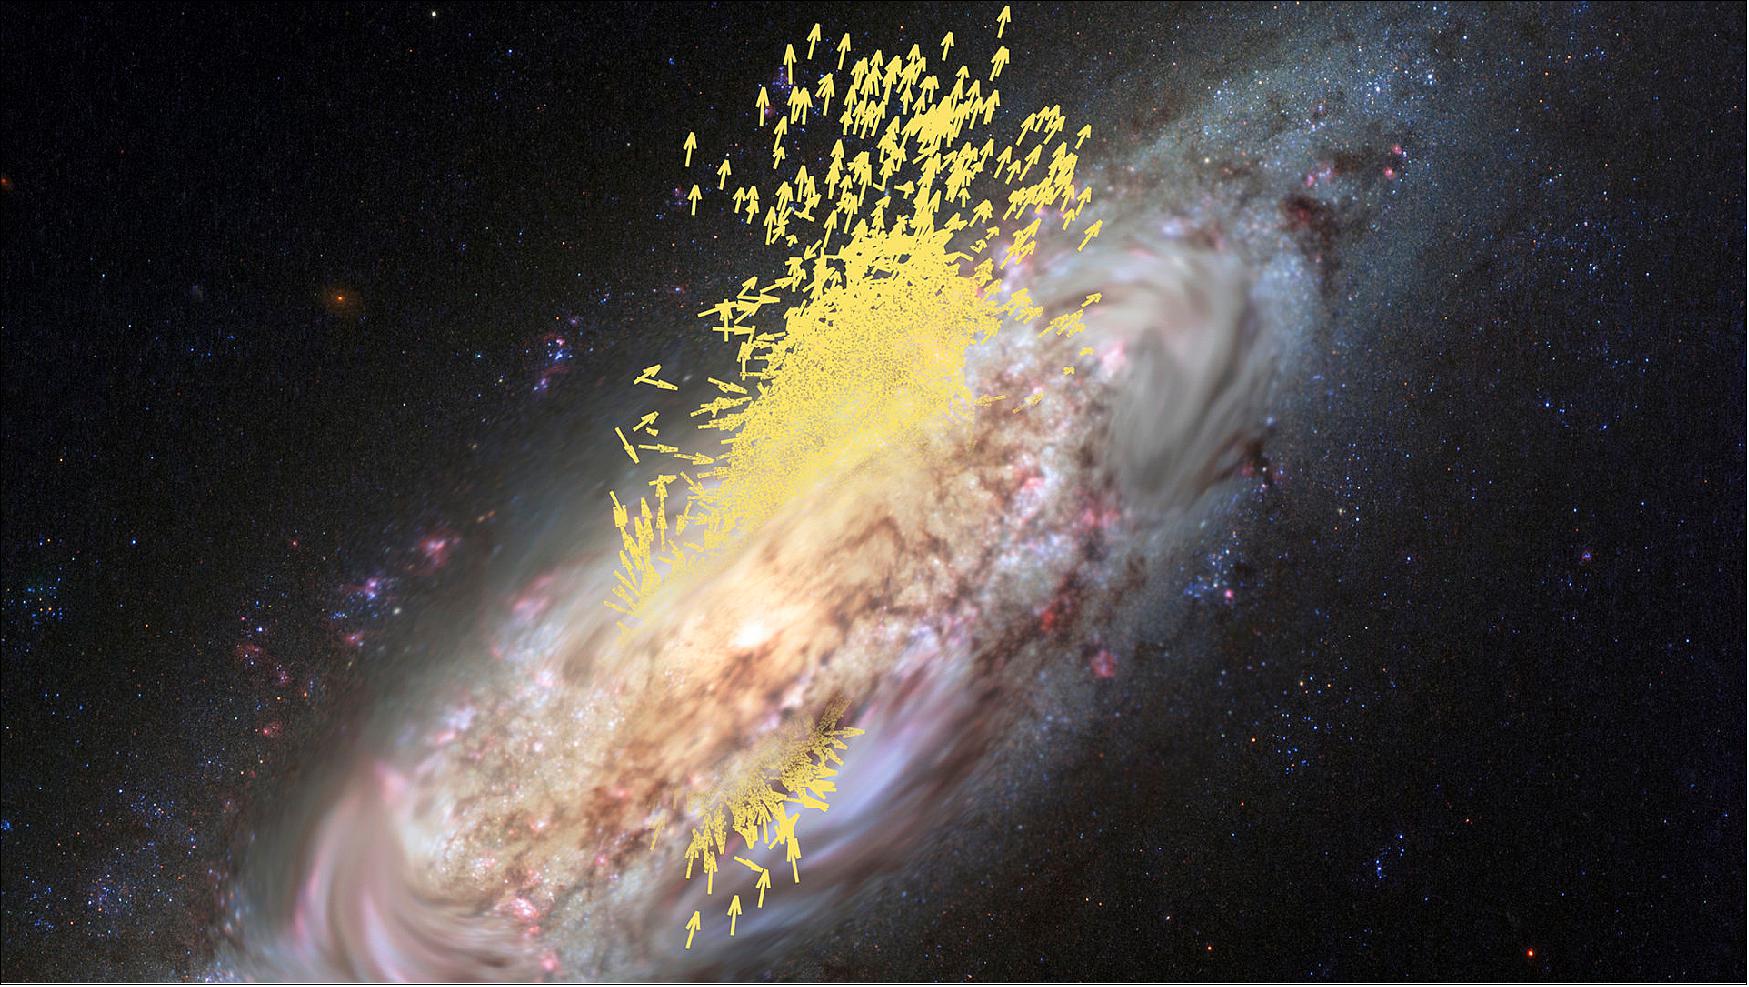
![Figure 25: A view of the Andromeda galaxy, also known as M31, with measurements of the motions of stars within the galaxy. This spiral galaxy is the nearest large neighbor of our Milky Way. The background image, obtained with NASA's Galex satellite at near-ultraviolet wavelengths, highlights regions within the galaxy where stars are forming. Blue symbols mark the locations of bright young stars that were used to measure the motion of the galaxy, and yellow arrows indicate the average stellar motions at various locations, based on data from the second release of ESA's Gaia satellite. A counter-clockwise rotation of the spiral galaxy's disc is evident. The precision of these measurements is expected to improve with the future Gaia data releases [image credit: ESA/Gaia (star motions); NASA/Galex (background image); R. van der Marel, M. Fardal, J. Sahlmann (STScI)]](/api/cms/documents/163813/5389966/Gaia2019_Auto42.jpeg)
![Figure 26: Sharpest ever view of the Andromeda Galaxy [image credit: NASA, ESA, J. Dalcanton (University of Washington, USA), B. F. Williams (University of Washington, USA), L. C. Johnson (University of Washington, USA), the PHAT team, and R. Gendler]](/api/cms/documents/163813/5389966/Gaia2019_Auto41.jpeg)
Legend to Figure 26: This image, captured with the NASA/ESA Hubble Space Telescope, is the largest and sharpest image ever taken of the Andromeda galaxy – otherwise known as M31. This is a cropped version of the full image and has 1.5 billion pixels. You would need more than 600 HD television screens to display the whole image. It is the biggest Hubble image ever released and shows over 100 million stars and thousands of star clusters embedded in a section of the galaxy's pancake-shaped disc stretching across over 40,000 light-years.
• January 10, 2019: How old are each of the stars in our roughly 13-billion-year-old galaxy? A new technique for understanding the star-forming history of the Milky Way in unprecedented detail makes it possible to determine the ages of stars at least two times more precisely than conventional methods, Embry-Riddle Aeronautical University (ERAU, Daytona Beach, USA) researchers reported 10 January at the American Astronomical Society (AAS) meeting in Seattle, WA. 23)
- Current star-dating techniques, based on assessments of stars in the prime or main sequence of their lives that have begun to die after exhausting their hydrogen, offer a 20%, or at best a 10% margin of error, explained Embry-Riddle Physics and Astronomy Professor Dr. Ted von Hippel. Embry-Riddle's approach, leveraging burnt-out remnants called white dwarf stars, reduces the margin of error to 5% or even 3%, he said.
- For this method to work, von Hippel and his team must measure the star's surface temperature, whether it has a hydrogen or helium atmosphere, and its mass. The surface temperature can be determined from a star's color and atmospheric constituents.
- "The star's mass matters because objects with greater mass have more energy and take longer to cool," said von Hippel. "This is why a cup of coffee stays hot longer than a teaspoon of coffee. Surface temperature, like spent coals in a campfire that's gone out, offer clues to how long ago the fire died. Finally, knowing whether there is hydrogen or helium at the surface is important because helium radiates heat away from the star more readily than hydrogen."
- Determining the precise masses of stars, particularly for large samples of white dwarfs, is very difficult. Now, astronomers have a new method to determine white dwarf masses.
- Leveraging Gaia Satellite Data: The method takes advantage of data captured by the European Space Agency's Gaia satellite, an ambitious mission to create a three-dimensional map of the Milky Way. Von Hippel, with recent Embry-Riddle graduate Adam Moss, current students Isabelle Kloc, Jimmy Sargent and Natalie Moticksa, and instructor Elliot Robinson, used highly precise Gaia measurements of the distance of stars.
- Just as a car's speedometer may appear to give two different readings from the driver's perspective versus the passenger's seat, celestial objects can appear to be in different locations, depending upon the viewer's vantage point. The Gaia measurements, based on the geometry of two different lines of site or "parallaxes" to objects, helped Embry-Riddle researchers determine the radius of stars based on their brightness. They could then use existing information on the star's mass-to-radius ratio — a calculation driven by the physical behavior of electrons — to fill in the last ingredient for determining the age of the star, its mass.
- Finally, by figuring out the abundance of different elements within the star, or its metallicity, researchers can further refine the age of the object, Moss and Kloc reported in two separate AAS poster presentations. Moss focused on pairs of stars with one white dwarf and one main sequence star similar to our Sun, while Kloc's research looked at two white dwarf stars in the same binary system.
- "The next level of study will be to determine as many of the elements in the periodic table as possible for the main sequence star within these pairs," von Hippel said. "That would tell us more about Galactic chemical evolution, based on how different elements built up over time as stars formed in our galaxy, the Milky Way."
- Though he emphasized that the current work remains preliminary, the team ultimately hopes to publish the ages of all white dwarf stars within the Gaia dataset: "That could allow researchers to significantly advance our understanding of star-formation within the Milky Way."
- Within the field of archaeology, von Hippel noted, carbon-dating methods made it possible to determine the age of structures, fossils, Stone Age sites and much more, thereby providing deeper insights into the evolution of life on Earth. "For today's astronomers, without knowing the age of different components of our galaxy, we don't have context. We've had techniques for dating celestial objects, but not precisely."
- The Embry-Riddle team's research collaborators were David Stenning and David van Dyk of Imperial College London; Elizabeth Jeffery of California Polytechnic State, San Luis Obispo; Kareem El-Badry of the University of California, Berkeley; and William Jeffery of the University of Texas, Austin.
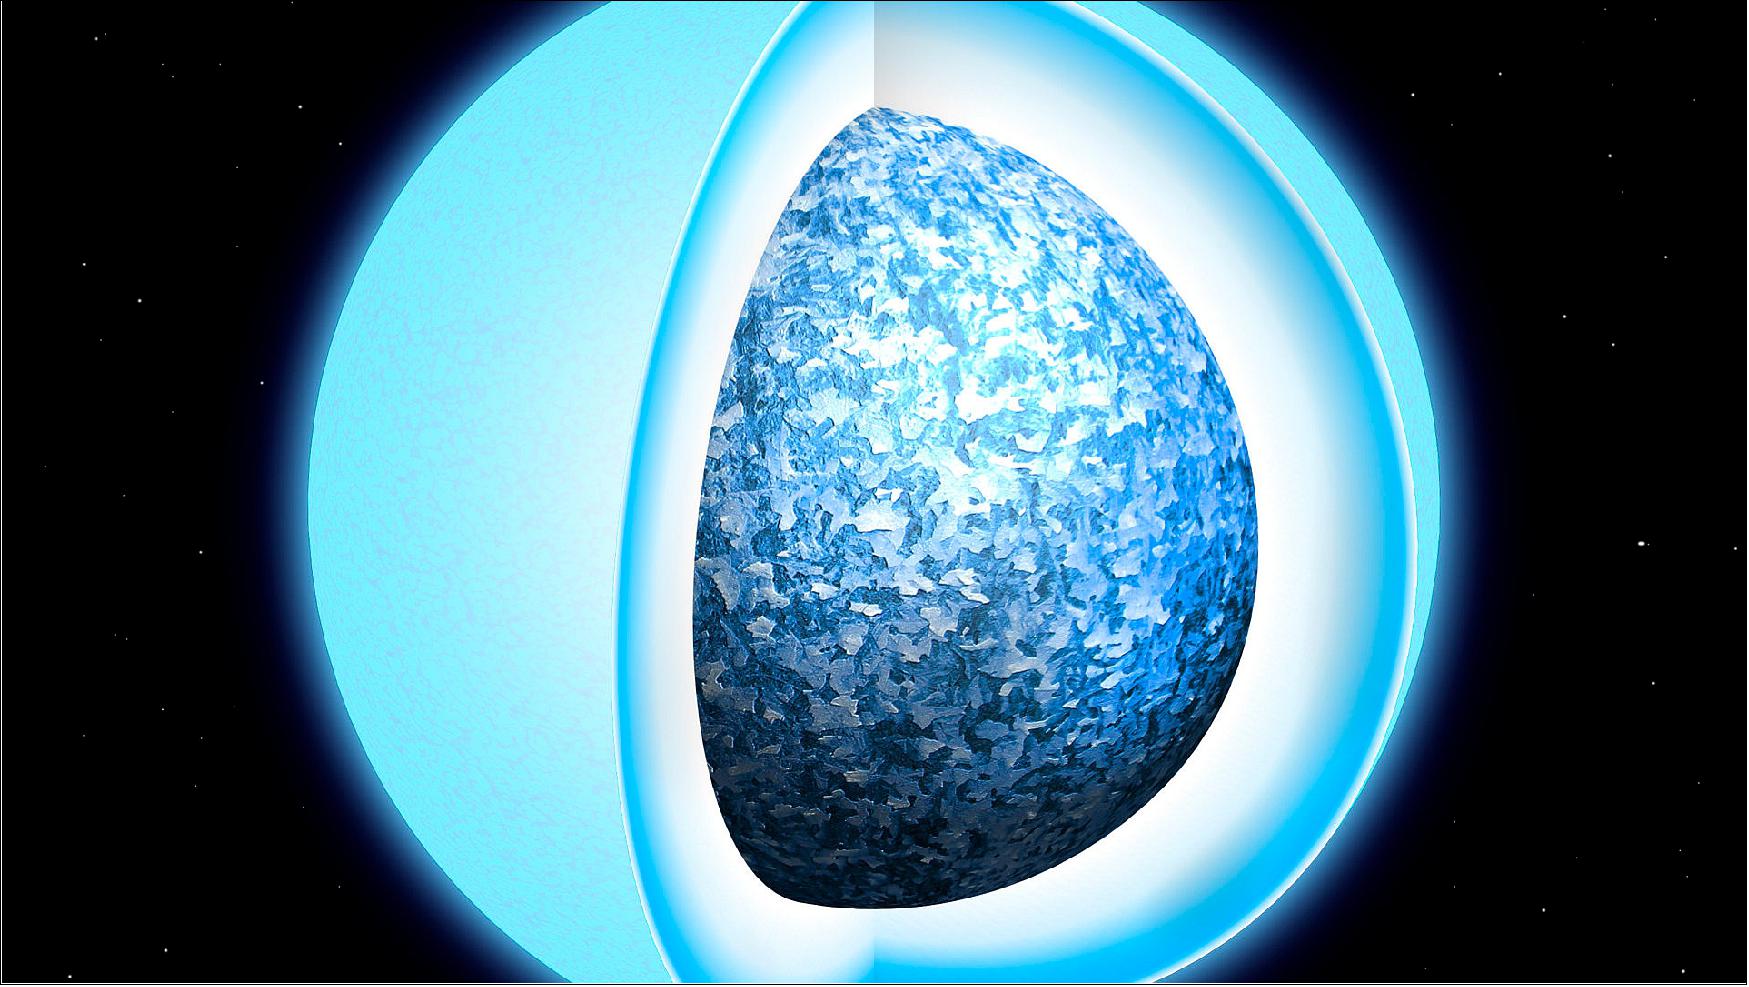
• January 9, 2019: Data captured by ESA's galaxy-mapping spacecraft Gaia has revealed for the first time how white dwarfs, the dead remnants of stars like our Sun, turn into solid spheres as the hot gas inside them cools down. 24)
- This process of solidification, or crystallization, of the material inside white dwarfs was predicted 50 years ago but it wasn't until the arrival of Gaia that astronomers were able to observe enough of these objects with such a precision to see the pattern revealing this process.
- "Previously, we had distances for only a few hundred of white dwarfs and many of them were in clusters, where they all have the same age," says Pier-Emmanuel Tremblay from the University of Warwick, UK, lead author of the paper describing the results, published today in Nature. 25)
- "With Gaia we now have the distance, brightness and color of hundreds of thousands of white dwarfs for a sizeable sample in the outer disc of the Milky Way, spanning a range of initial masses and all kinds of ages."
- It is in the precise estimate of the distance to these stars that Gaia makes a breakthrough, allowing astronomers to gauge their true brightness with unprecedented accuracy.
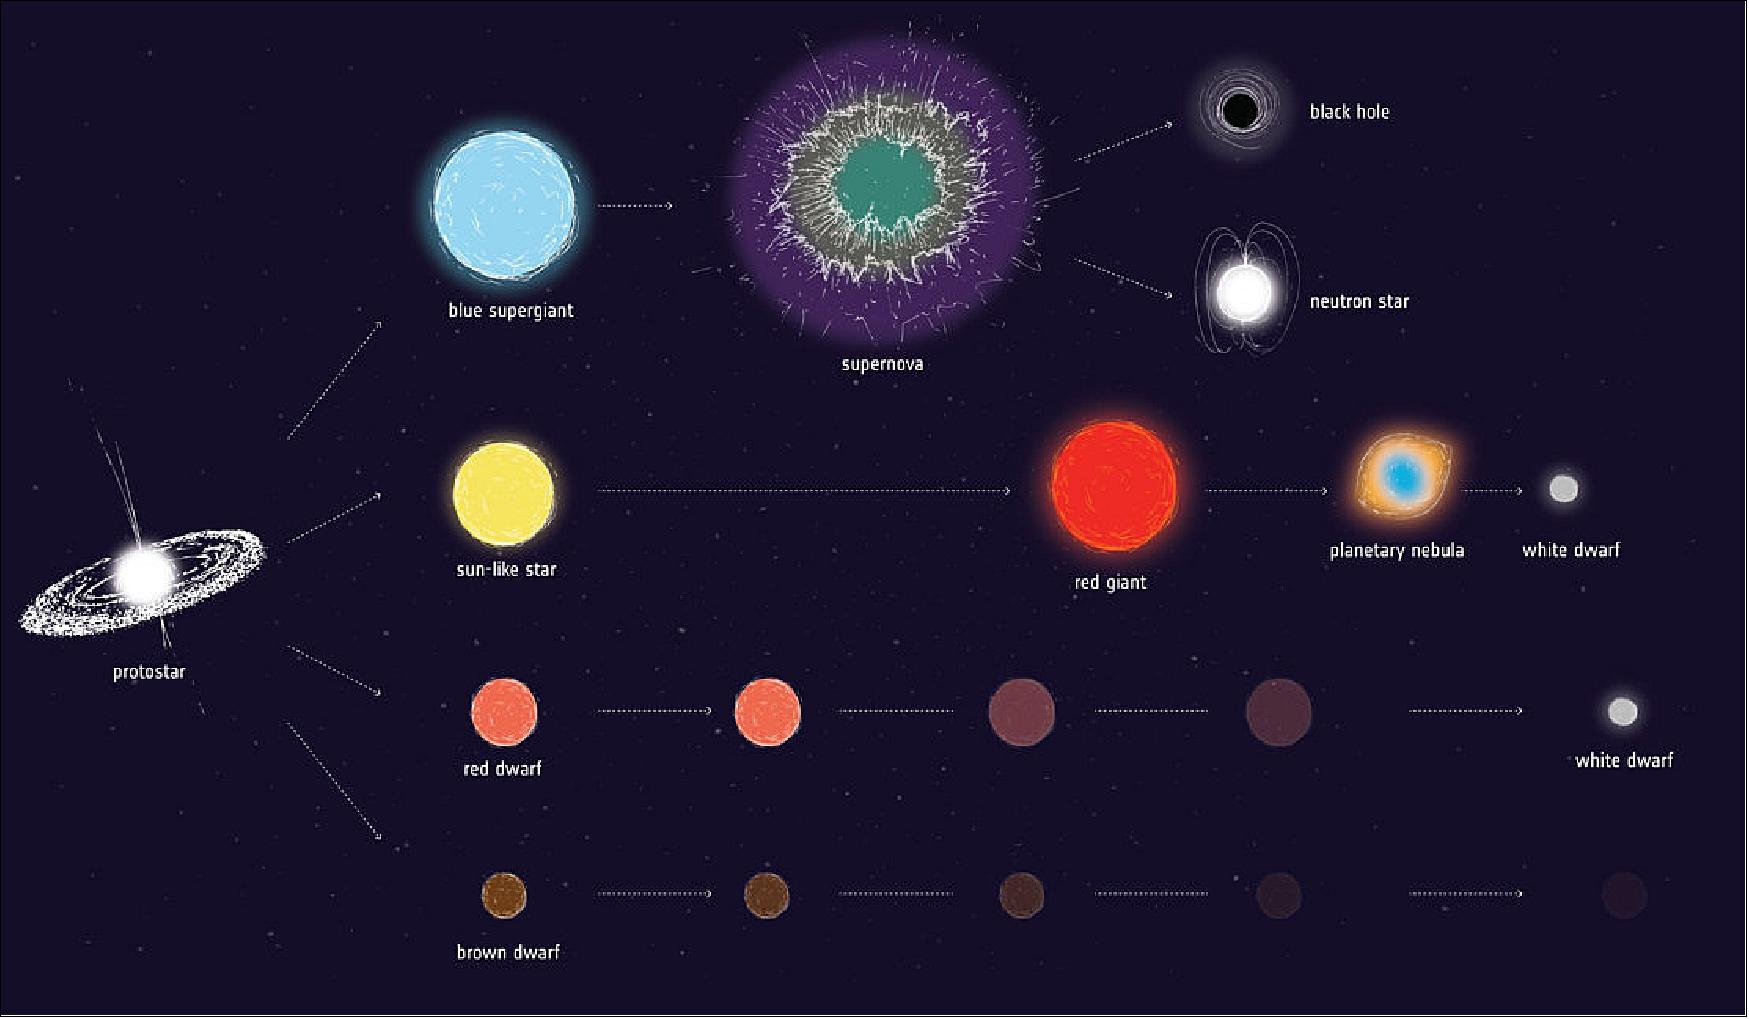
- White dwarfs are the remains of medium-sized stars similar to our Sun. Once these stars have burnt all the nuclear fuel in their core, they shed their outer layers, leaving behind a hot core that starts cooling down.
- These ultra-dense remnants still emit thermal radiation as they cool, and are visible to astronomers as rather faint objects. It is estimated that up to 97% of stars in the Milky Way will eventually turn into white dwarfs, while the most massive of stars will end up as neutron stars or black holes.
- The cooling of white dwarfs lasts billions of years. Once they reach a certain temperature, the originally hot matter inside the star's core starts crystallizing, becoming solid. The process is similar to liquid water turning into ice on Earth at zero degrees Celsius, except that the temperature at which this solidification happens in white dwarfs is extremely high – about 10 million degrees Celsius.
- In this study, the astronomers analyzed more than 15,000 stellar remnant candidates within 300 light years of Earth as observed by Gaia and were able to see these crystallizing white dwarfs as a rather distinct group.
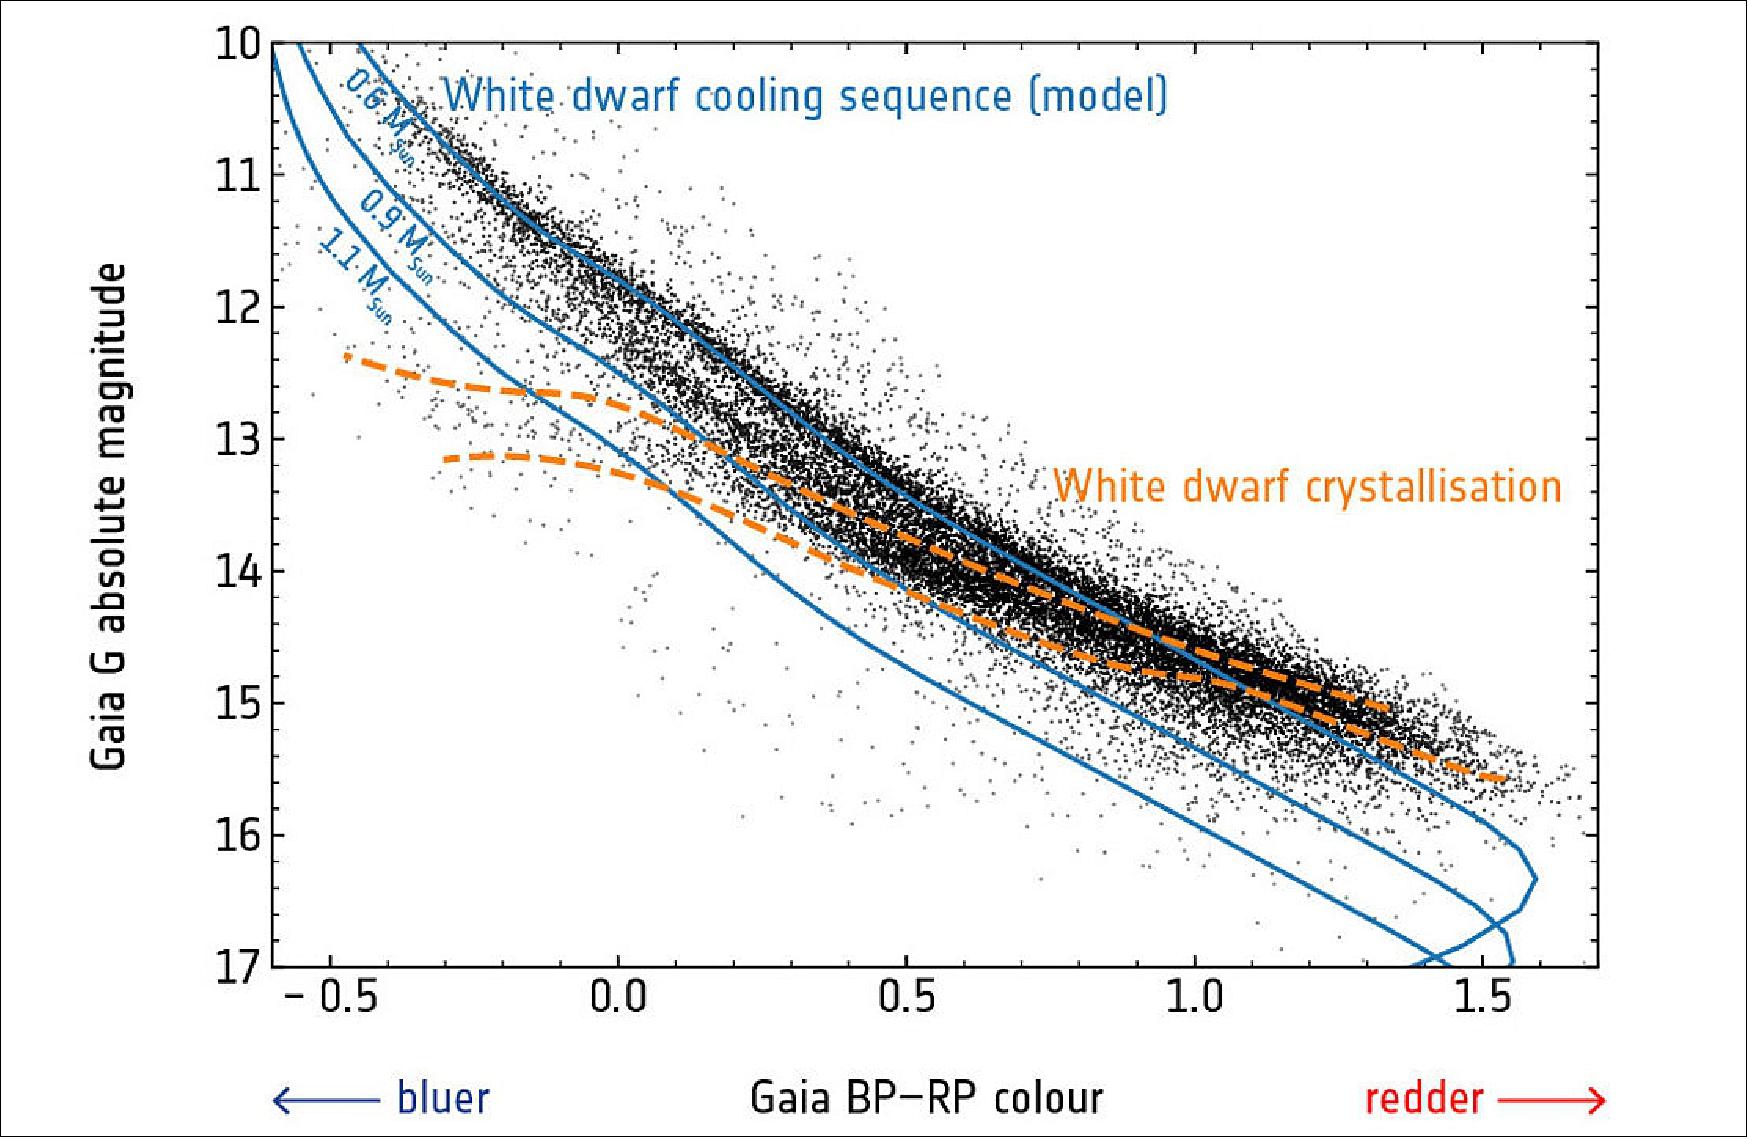
- "We saw a pile-up of white dwarfs of certain colors and luminosities that were otherwise not linked together in terms of their evolution," says Pier-Emmanuel. "We realized that this was not a distinct population of white dwarfs, but the effect of the cooling and crystallization predicted 50 years ago."
- The heat released during this crystallization process, which lasts several billion years, seemingly slows down the evolution of the white dwarfs: the dead stars stop dimming and, as a result, appear up to two billion years younger than they actually are. That, in turn, has an impact on our understanding of the stellar groupings these white dwarfs are a part of.
- White dwarfs are traditionally used for age-dating of stellar populations such as clusters of stars, the outer disc, and the halo in our Milky Way," explains Pier-Emmanuel. "We will now have to develop better crystallization models to get more accurate estimates of the ages of these systems."
- Not all white dwarfs crystallize at the same pace. More massive stars cool down more rapidly and will reach the temperature at which crystallization happens in about one billion years. White dwarfs with lower masses, closer to the expected end stage of the Sun, cool in a slower fashion, requiring up to six billion years to turn into dead solid spheres.
- The Sun still has about five billion years before it becomes a white dwarf, and the astronomers estimate that it will take another five billion years after that to eventually cool down to a crystal sphere.
- "This result highlights the versatility of Gaia and its numerous applications," says Timo Prusti, Gaia project scientist at ESA. "It's exciting how scanning stars across the sky and measuring their properties can lead to evidence of plasma phenomena in matter so dense that cannot be tested in the laboratory."
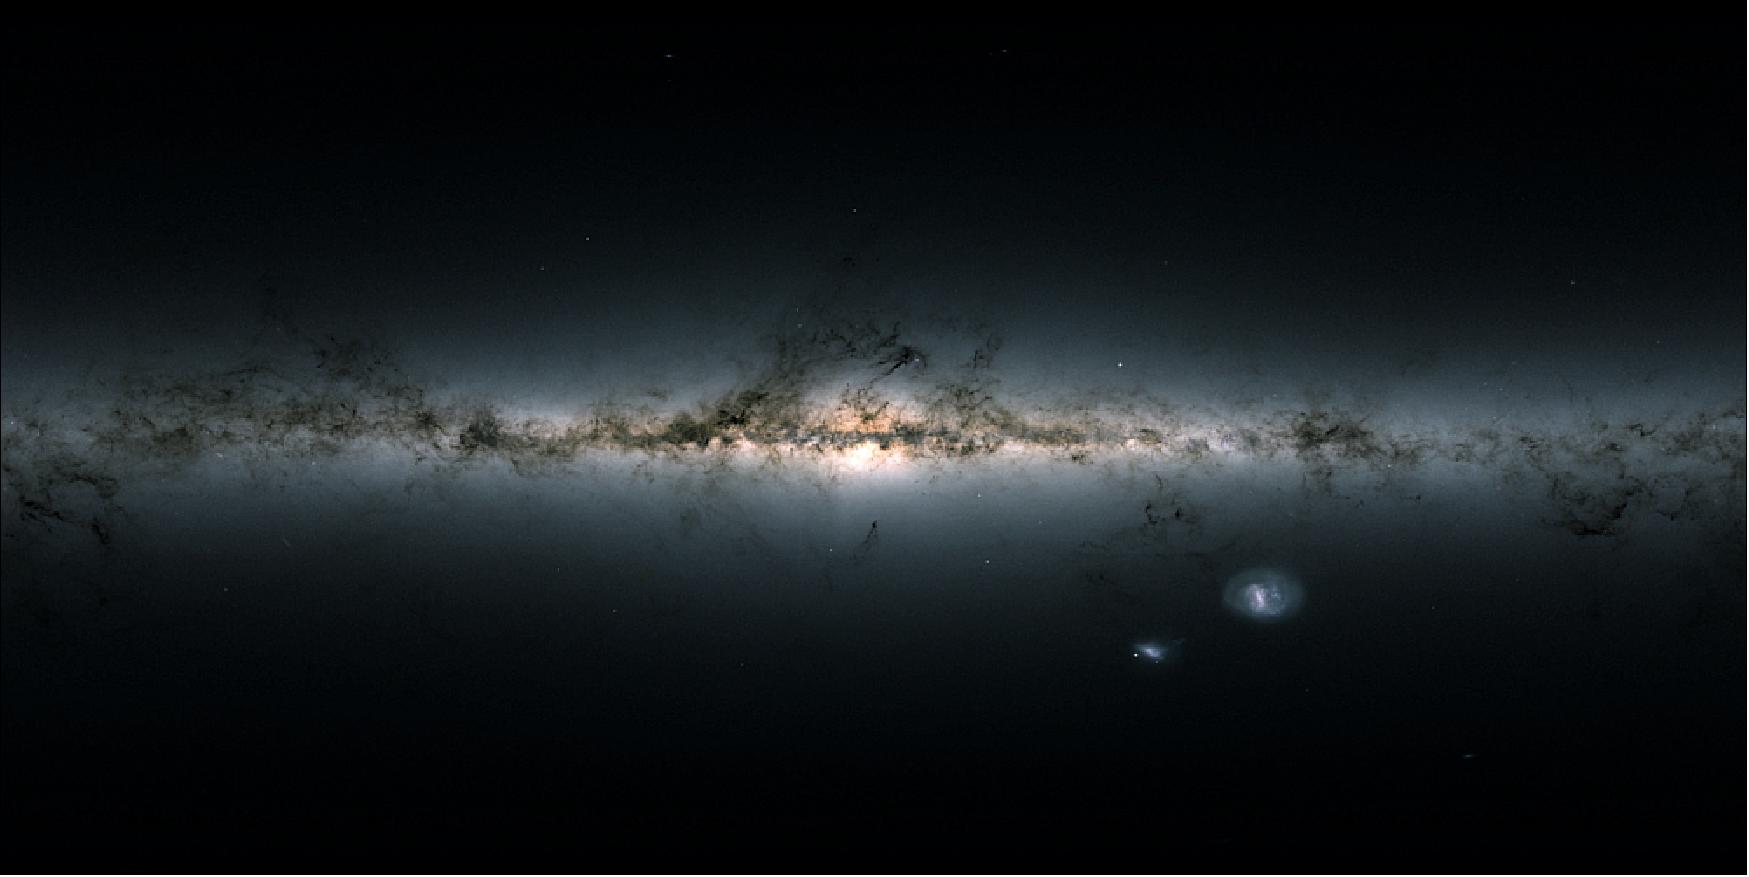
• December 13, 2018: Launched in December 2013, ESA's Gaia satellite has been scanning the sky to perform the most precise stellar census of our Milky Way galaxy, observing more than one billion stars and measuring their positions, distances and motions to unprecedented accuracy. — Launched in December 2013, ESA's Gaia satellite has been scanning the sky to perform the most precise stellar census of our Milky Way galaxy, observing more than one billion stars and measuring their positions, distances and motions to unprecedented accuracy. 26)
• November 14, 2018: The SPC (Science Program Committee) of ESA has confirmed the continued operations of ten scientific missions in the Agency's fleet up to 2022. After a comprehensive review of their scientific merits and technical status, the SPC has decided to extend the operation of the five missions led by ESA's Science Program: Cluster, Gaia, INTEGRAL, Mars Express, and XMM-Newton. The SPC also confirmed the Agency's contributions to the extended operations of Hinode, Hubble, IRIS, SOHO, and ExoMars TGO. 27) - This includes the confirmation of operations for the 2019–2020 cycle for missions that had been given indicative extensions as part of the previous extension process, and indicative extensions for an additional two years, up to 2022. - The decision was taken during the SPC meeting at ESA/ESAC (European Space Astronomy Center) near Madrid, Spain, on 14 November. - ESA's science missions have unique capabilities and are prolific in their scientific output. Cluster, for example, is the only mission that, by varying the separation between its four spacecraft, allows multipoint measurements of the magnetosphere in different regions and at different scales, while Gaia is performing the most precise astrometric survey ever realized, enabling unprecedented studies of the distribution and motions of stars in the Milky Way and beyond. - Many of the science missions are proving to be of great value to pursue investigations that were not foreseen at the time of their launch. Examples include the role of INTEGRAL and XMM-Newton in the follow-up of recent gravitational wave detections, paving the way for the future of multi-messenger astronomy, and the many discoveries of diverse exoplanets by Hubble. - Collaboration between missions, including those led by partner agencies, is also of great importance. The interplay between solar missions like Hinode, IRIS and SOHO provides an extensive suite of complementary instruments to study our Sun; meanwhile, Mars Express and ExoMars TGO are at the forefront of the international fleet investigating the Red Planet. - Another compelling factor to support the extension is the introduction of new modes of operation to accommodate the evolving needs of the scientific community, as well as new opportunities for scientists to get involved with the missions. |
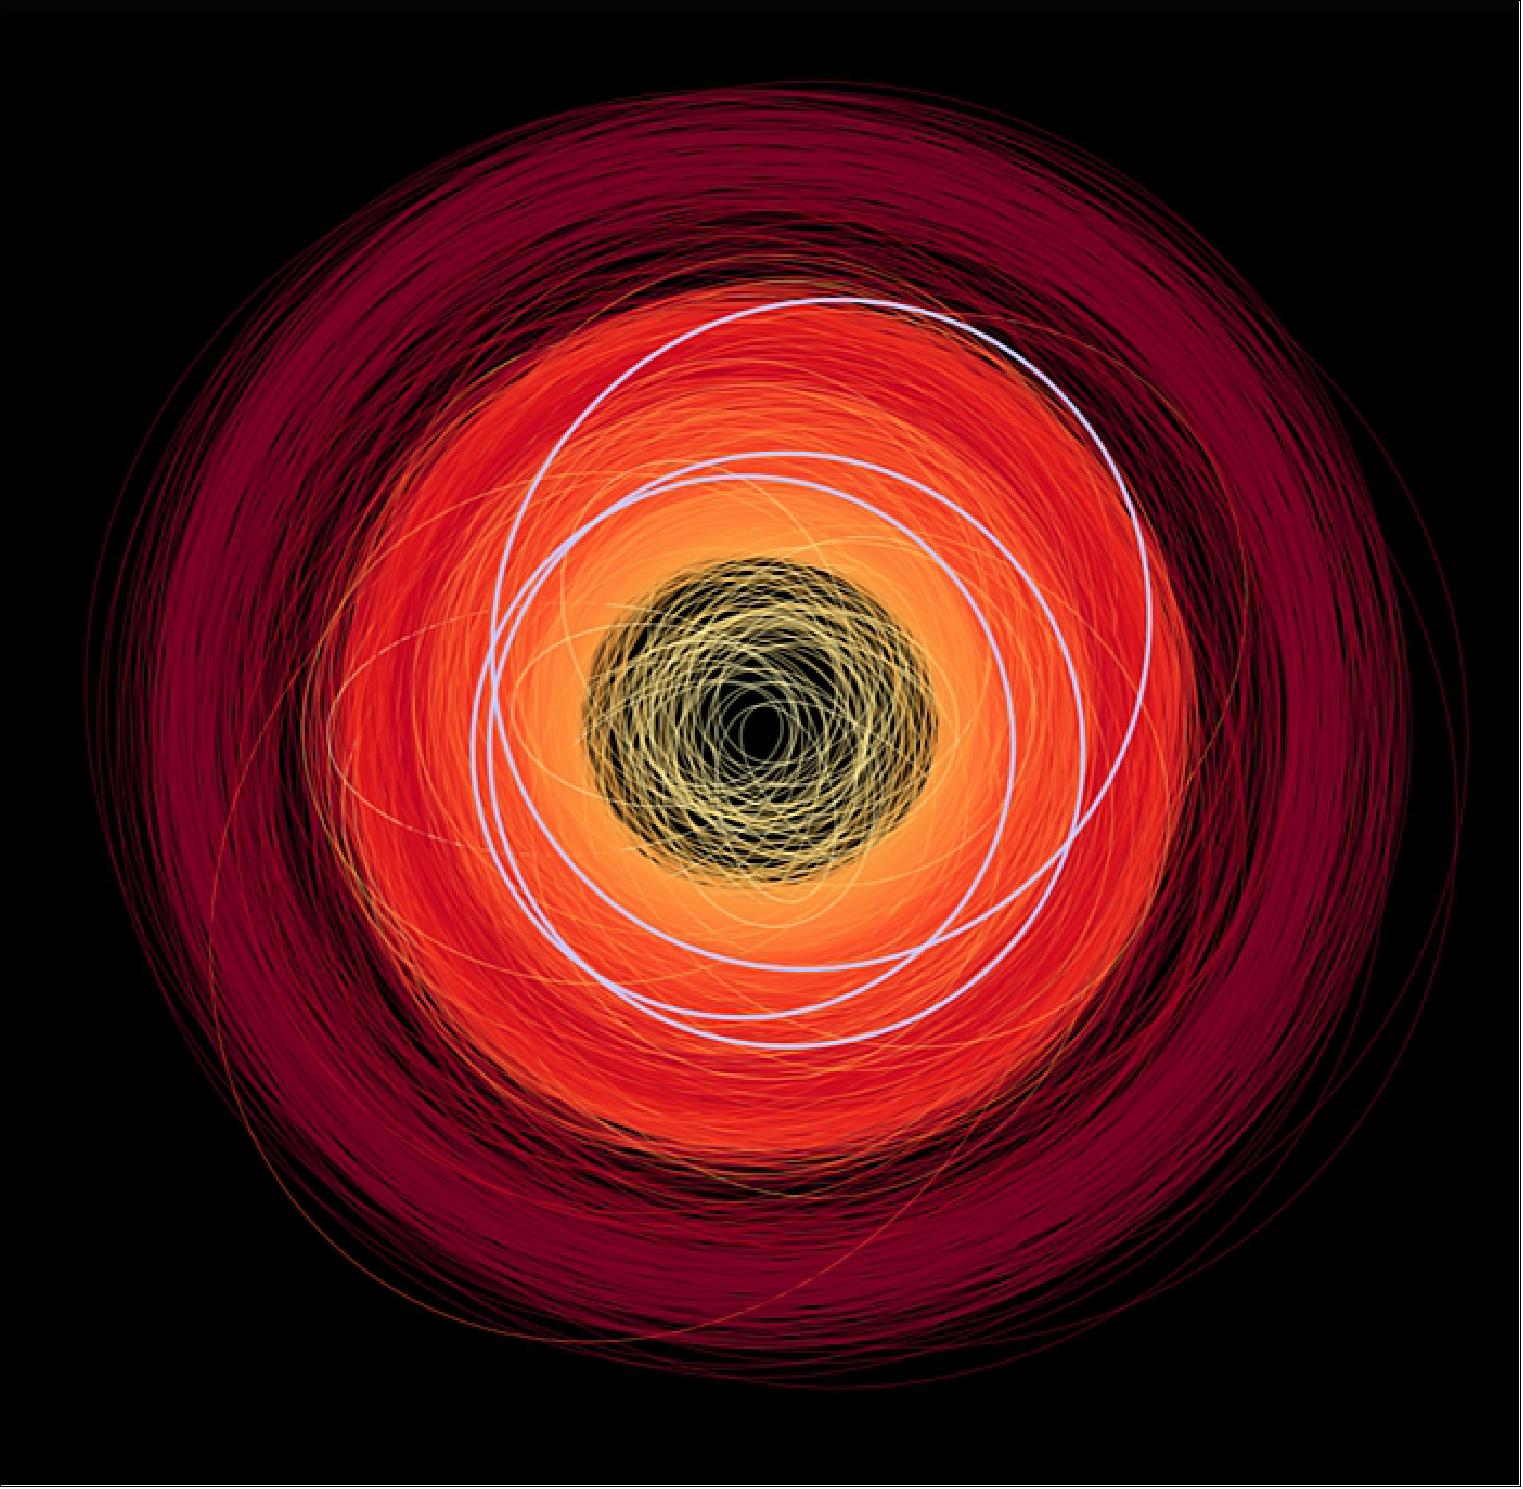
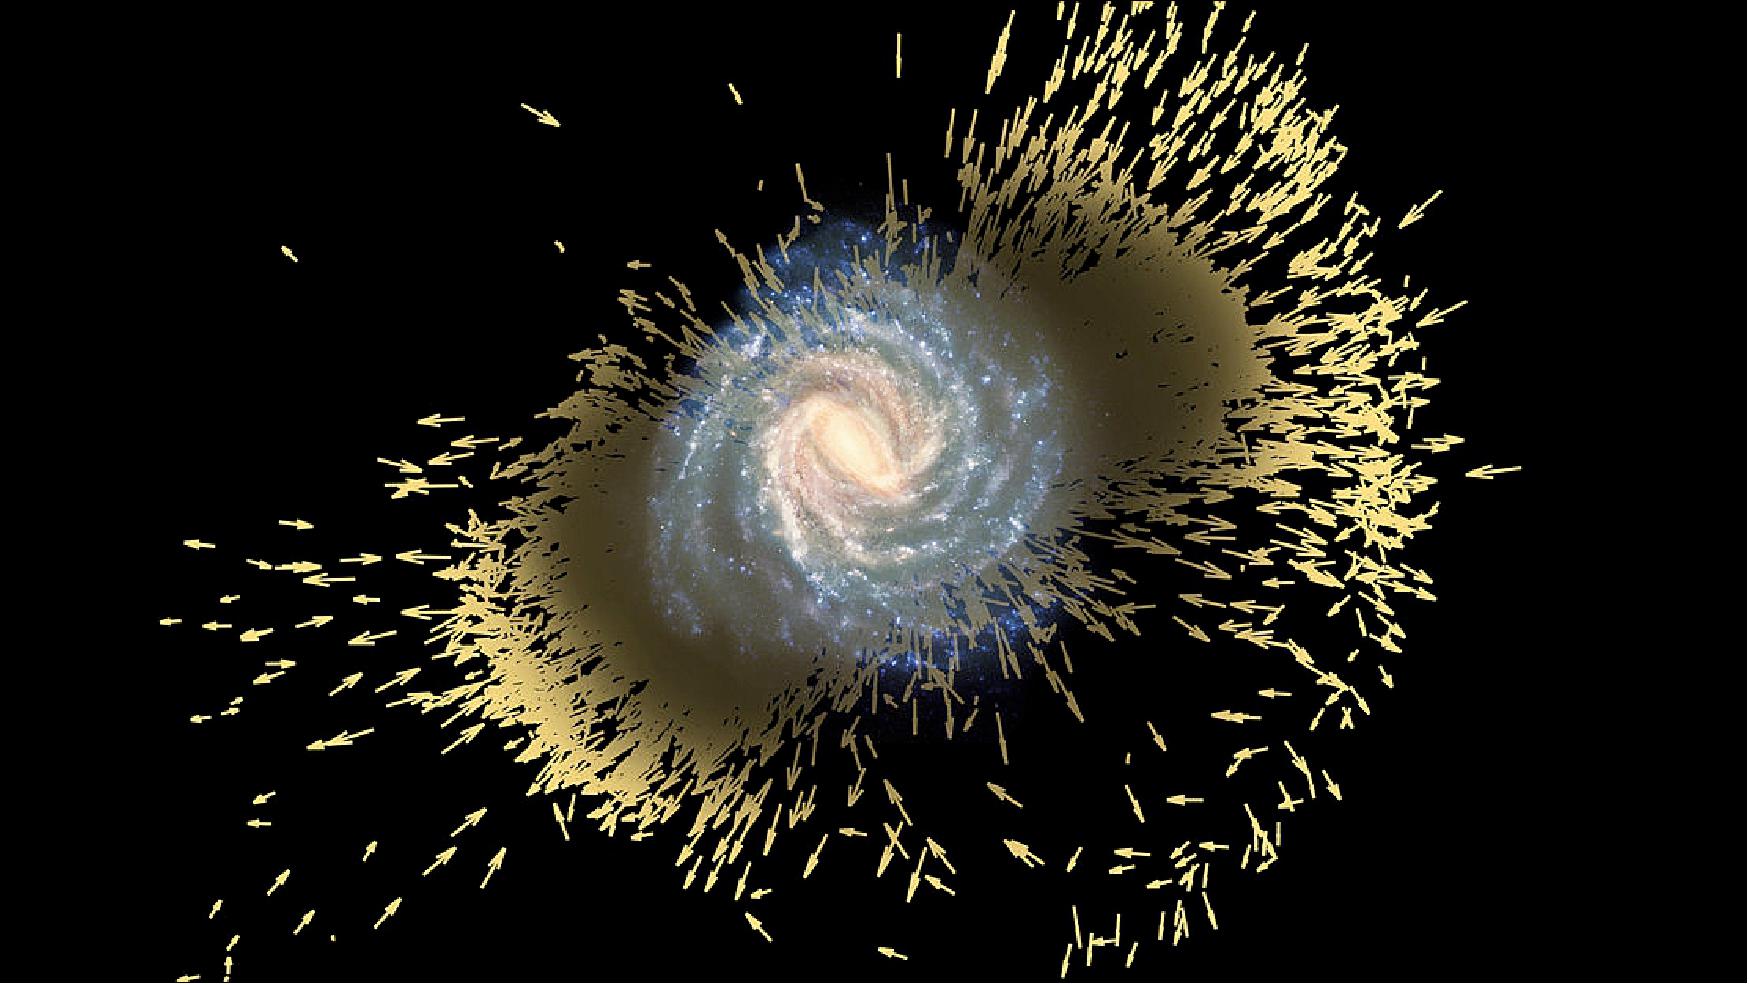
• October 31, 2018: ESA's Gaia mission has made a major breakthrough in unravelling the formation history of the Milky Way. Instead of forming alone, our Galaxy merged with another large galaxy early in its life, around 10 billion years ago. The evidence is littered across the sky all around us, but it has taken Gaia and its extraordinary precision to show us what has been hiding in plain sight all along. 28) 29)
Legend to Figure 31: Astronomers uncovered this major event in the formation history of the Milky Way after discovering an ‘odd collection' of stars that move along elongated trajectories in the opposite direction to the majority of the Galaxy's other hundred billion stars, including the Sun. The discovery was possible thanks to the second data release of ESA's Gaia mission and its extraordinary precision. The positions and motions of the stars in Gaia-Enceladus (represented with yellow arrows) in this early phase of the merger are based on a computer simulation that models a similar encounter to that uncovered by Gaia.
- Using the first 22 months of observations, a team of astronomers led by Amina Helmi, University of Groningen, The Netherlands, looked at seven million stars – those for which the full 3D positions and velocities are available – and found that some 30,000 of them were part of an ‘odd collection' moving through the Milky Way. The observed stars in particular are currently passing by our solar neighborhood.
- We are so deeply embedded in this collection that its stars surround us almost completely, and so can be seen across most of the sky.
- Even though they are interspersed with other stars, the stars in the collection stood out in the Gaia data because they all move along elongated trajectories in the opposite direction to the majority of the Galaxy's other hundred billion stars, including the Sun.
- They also stood out in the so-called Hertzprung-Russell diagram – which is used to compare the color and brightness of stars – indicating that they belong to a clearly distinct stellar population.
- The sheer number of odd-moving stars involved intrigued Amina and her colleagues, who suspected they might have something to do with the Milky Way's formation history and set to work to understand their origins.
- In the past, Amina and her research group had used computer simulations to study what happens to stars when two large galaxies merge. When she compared those to the Gaia data, the simulated results matched the observations.
- "The collection of stars we found with Gaia has all the properties of what you would expect from the debris of a galactic merger," says Amina, lead author of the paper published today in Nature. 31)
- In other words, the collection is what they expected from stars that were once part of another galaxy and have been consumed by the Milky Way. The stars now form most of our Galaxy's inner halo – a diffuse component of old stars that were born at early times and now surround the main bulk of the Milky Way known as the central bulge and disc.
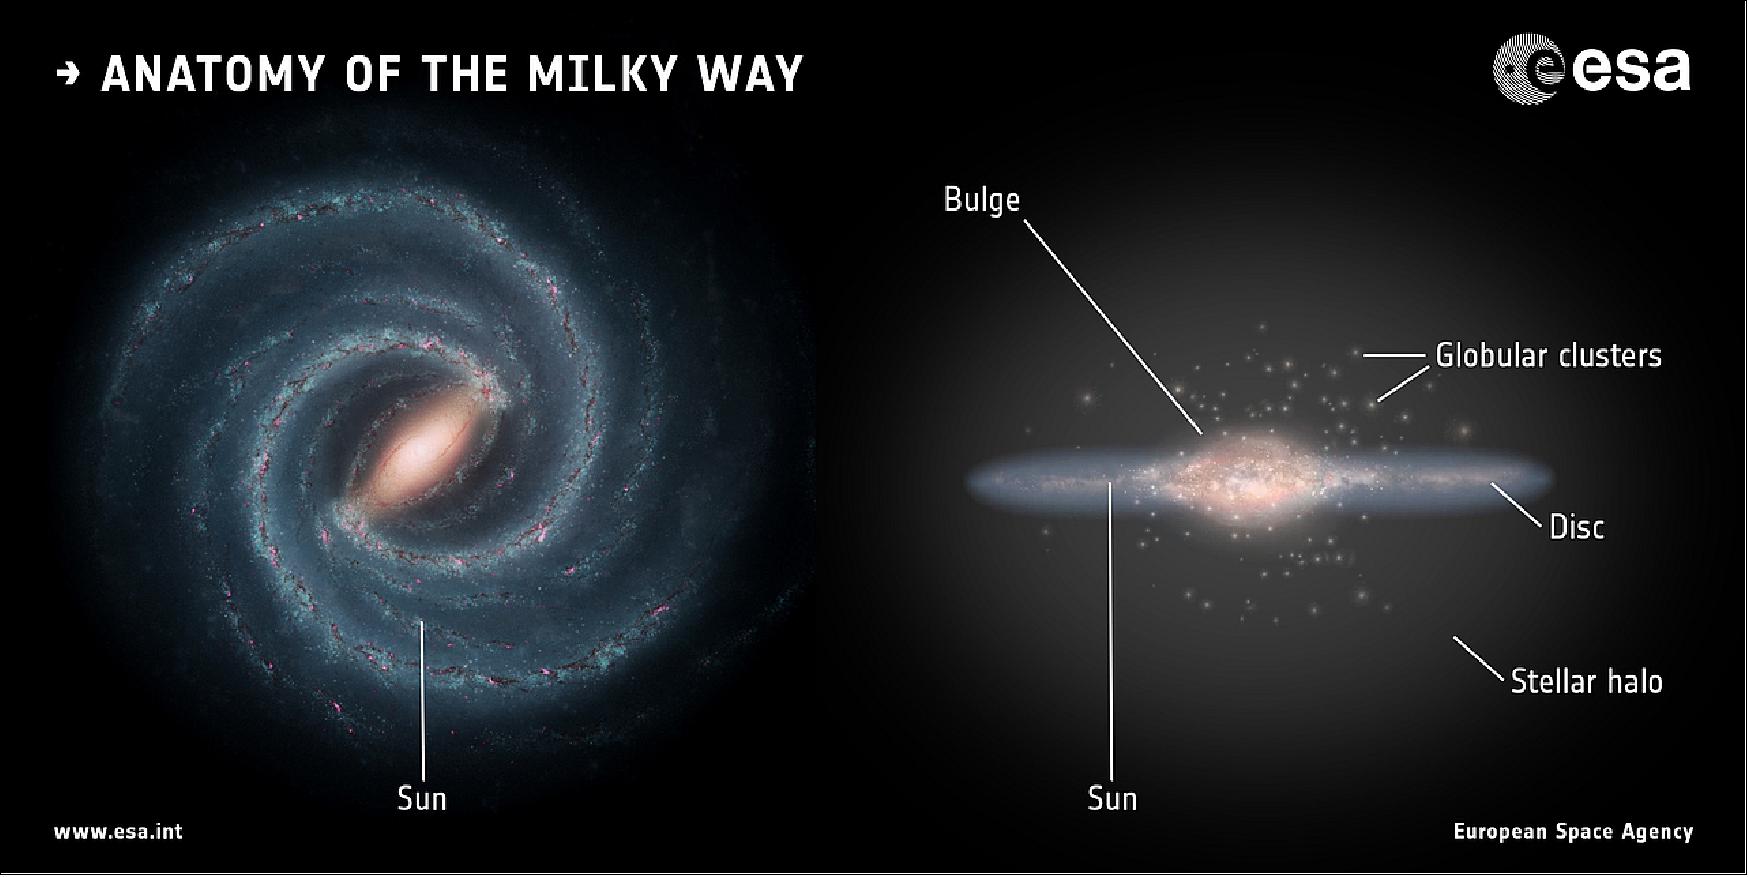
Legend to Figure 33: On the left, a face-on view shows the spiral structure of the Galactic Disc, where the majority of stars are located, interspersed with a diffuse mixture of gas and cosmic dust. The disc measures about 100,000 light-years across, and the Sun sits about half way between its center and periphery. - On the right, an edge-on view reveals the flattened shape of the disc. Observations point to a substructure: a thin disc some 700 light-years high embedded in a thick disc, about 3000 light-years high and populated with older stars.
The edge on view also shows the Galactic Bulge, located in the central portion of the Milky Way and hosting about 10 billion stars, which are mainly old and red. The bulge, also visible in the face-on view on the left, has an overall elongated shape that resembles that of a peanut-shaped bar, with a half-length of about 10,000 light-years, making the Milky Way a barred spiral galaxy.
Beyond the disc and bulge is the stellar halo, a roughly spherical structure with a radius of about 100 000 light-years, containing isolated stars as well as many globular clusters – large, compact conglomerations of some of the most ancient stars in the Galaxy. On a grander scale, the Milky Way is embedded in an even larger halo of invisible dark matter.
- The Galactic disc itself is composed of two parts. There is the thin disc, which is a few hundred light years deep and contains the pattern of spiral arms made by bright stars. And there is the thick disc, which is a few thousand light years deep. It contains about 10–20 percent of the Galaxy's stars yet its origins have been difficult to determine.
- According to the team's simulations, as well as supplying the halo stars, the accreted galaxy could also have disturbed the Milky Way's pre-existing stars to help form the thick disc.
- "We became only certain about our interpretation after complementing the Gaia data with additional information about the chemical composition of stars, supplied by the ground-based APOGEE survey," says Carine Babusiaux, Université Grenoble Alpes, France, and second author of the paper.
- Stars that form in different galaxies have unique chemical compositions that match the conditions of the home galaxy. If this star collection was indeed the remains of a galaxy that merged with our own, the stars should show an imprint of this in their composition. And they did.
- The astronomers called this galaxy Gaia-Enceladus after one of the Giants in ancient Greek mythology, who was the offspring of Gaia, the Earth, and Uranus, the Sky.
- "According to the legend, Enceladus was buried under Mount Etna, in Sicily, and responsible for local earthquakes. Similarly, the stars of Gaia-Enceladus were deeply buried in the Gaia data, and they have shaken the Milky Way, leading to the formation of its thick disc," explains Amina.
- Even though no more evidence was really needed, the team also found hundreds of variable stars and 13 globular clusters in the Milky Way that follow similar trajectories as the stars from Gaia-Enceladus, indicating that they were originally part of that system. Globular clusters are groups of up to millions of stars, held together by their mutual gravity and orbiting the center of a galaxy. The fact that so many clusters could be linked to Gaia-Enceladus is another indication that this must have once been a big galaxy in its own right, with its own entourage of globular clusters.
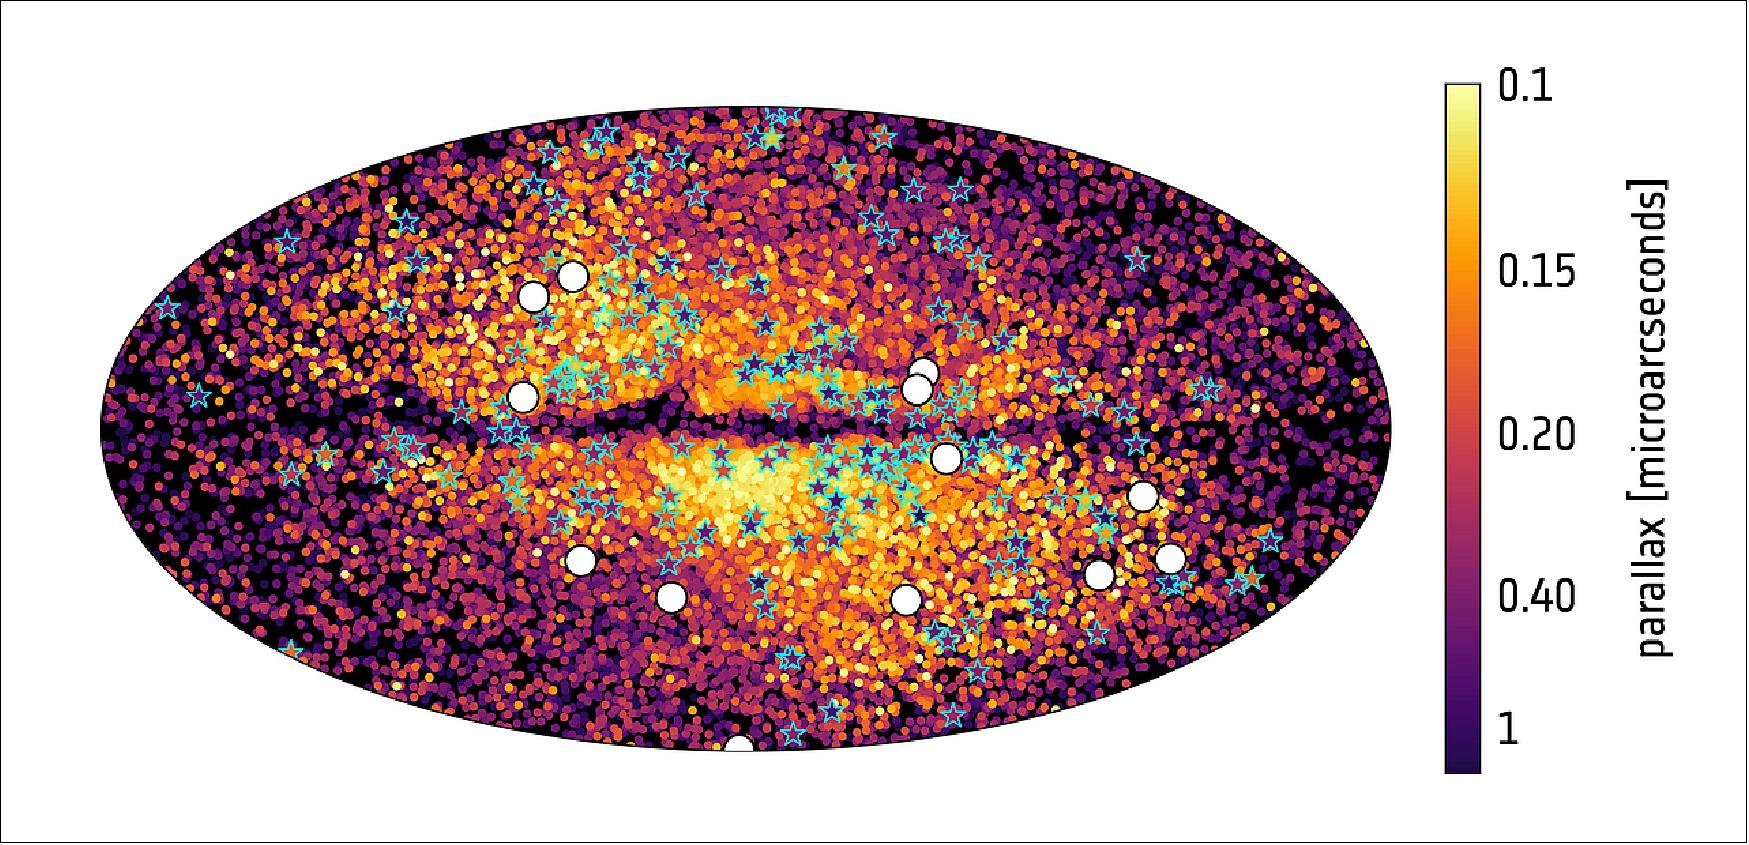
Legend to Figure 34: All-sky distribution of an 'odd collection' of stars detected in the second data release of ESA's Gaia mission. These stars move along elongated trajectories in the opposite direction to the majority of our Milky Way's other hundred billion stars and have a markedly different chemical composition, indicating that they belong to a clearly distinct stellar population.
From these clues, astronomers inferred that these stars are the debris of a galaxy that merged with our Milky Way during its early formation stages, 10 billion years ago, and named this galaxy Gaia-Enceladus.
The stars of Gaia-Enceladus are represented with different colors depending on their parallax – a measure of their distance – with purple hues indicating the most nearby stars and yellow hues the most distant ones. White circles indicate globular clusters that were observed to follow similar trajectories as the stars from Gaia-Enceladus, indicating that they were originally part of that system; cyan star symbols indicate variable stars that are also associated as Gaia-Enceladus debris.
- Further analysis revealed that this galaxy was about the size of one of the Magellanic Clouds – two satellite galaxies roughly ten times smaller than the current size of the Milky Way.
- Ten billion years ago, however, when the merger with Gaia-Enceladus took place, the Milky Way itself was much smaller, so the ratio between the two was more like four to one. It was therefore clearly a major blow to our Galaxy.
- "Seeing that we are now starting to unravel the formation history of the Milky Way is very exciting," says Anthony Brown, Leiden University, The Netherlands, who is a co-author of the paper and also chair of the Gaia Data Processing and Analysis Consortium Executive.
- Since the very first discussions about building Gaia 25 years ago, one of the mission's key objectives was to examine the various stellar streams in the Milky Way, and reconstruct its early history. That vision is paying off.
- "Gaia was built to answer such questions," says Amina. "We can now say this is the way the Galaxy formed in those early epochs. It's fantastic. It's just so beautiful and makes you feel so big and so small at the same time."
- "By reading the motions of stars scattered across the sky, we are now able to rewind the history of the Milky Way and discover a major milestone in its formation, and this is possible thanks to Gaia," concludes Timo Prusti, Gaia project scientist at ESA.
• October 02, 2018: A team of astronomers using the latest set of data from ESA's Gaia mission to look for high-velocity stars being kicked out of the Milky Way were surprised to find stars instead sprinting inwards – perhaps from another galaxy. 32)
![Figure 35: The positions and reconstructed orbits of 20 high-velocity stars, represented on top of an artistic view of our Galaxy, the Milky Way. These stars were identified using data from the second release of ESA's Gaia mission. The seven stars shown in red are sprinting away from the Galaxy and could be travelling fast enough to eventually escape its gravity. Surprisingly, the study revealed also thirteen stars, shown in orange, that are racing towards the Milky Way: these could be stars from another galaxy, zooming right through our own [image credit: ESA (artist's impression and composition); Marchetti et al 2018 (star positions and trajectories); NASA/ESA/Hubble (background galaxies), CC BY-SA 3.0 IGO]](/api/cms/documents/163813/5389966/Gaia2019_Auto39.jpeg)
- In April, ESA's stellar surveyor Gaia released an unprecedented catalogue of more than one billion stars. Astronomers across the world have been working ceaselessly over the past few months to explore this extraordinary dataset, scrutinizing the properties and motions of stars in our Galaxy and beyond with never before achieved precision, giving rise to a multitude of new and intriguing studies.
- The Milky Way contains over a hundred billion stars. Most are located in a disk with a dense, bulging center, at the middle of which is a supermassive black hole. The rest are spread out in a much larger spherical halo.
- Stars circle around the Milky Way at hundreds of km/s, and their motions contain a wealth of information about the past history of the Galaxy. The fastest class of stars in our Galaxy are called hypervelocity stars, which are thought to start their life near the Galactic center to be later flung towards the edge of the Milky Way via interactions with the black hole.
- Only a small number of hypervelocity stars have ever been discovered, and Gaia's recently published second data release provides a unique opportunity to look for more of them.
- Several groups of astronomers jumped into the brand-new dataset in search of hypervelocity stars immediately after the release. Among them, three scientists at Leiden University, the Netherlands, were in for a big surprise.
- For 1.3 billion stars, Gaia measured positions, parallaxes – an indicator of their distance – and 2D motions on the plane of the sky. For seven million of the brightest ones, it also measured how quickly they move towards or away from us.
- "Of the seven million Gaia stars with full 3D velocity measurements, we found twenty that could be travelling fast enough to eventually escape from the Milky Way," explains Elena Maria Rossi, one of the authors of the new study. 33)
- Elena and colleagues, who had already discovered a handful of hypervelocity stars last year in an exploratory study based on data from Gaia's first release, were pleasantly surprised, as they were hoping to find at most one star breaking loose from the Galaxy among these seven million. And there is more.
- "Rather than flying away from the Galactic center, most of the high velocity stars we spotted seem to be racing towards it," adds co-author Tommaso Marchetti. — "These could be stars from another galaxy, zooming right through the Milky Way."
- It is possible that these intergalactic interlopers come from the Large Magellanic Cloud, a relatively small galaxy orbiting the Milky Way, or they may originate from a galaxy even further afield.
![Figure 36: The Large Magellanic Cloud (LMC), one of the nearest galaxies to our Milky Way, as viewed by ESA's Gaia satellite using information from the mission's second data release. This view is not a photograph but has been compiled by mapping the total amount of radiation detected by Gaia in each pixel, combined with measurements of the radiation taken through different filters on the spacecraft to generate color information [image credit: ESA/Gaia/DPAC (Data Processing and Analysis Consortium); A. Moitinho / A. F. Silva / M. Barros / C. Barata, University of Lisbon, Portugal; H. Savietto, Fork Research, Portugal]](/api/cms/documents/163813/5389966/Gaia2019_Auto38.jpeg)
Legend to Figure 36: The image is dominated by the brightest, most massive stars, which greatly outshine their fainter, lower-mass counterparts. In this view, the bar of the LMC is outlined in great detail, along with individual regions of star formation like the giant 30 Doradus, visible just above the center of the galaxy.
- If that is the case, they carry the imprint of their site of origin, and studying them at much closer distances than their parent galaxy could provide unprecedented information on the nature of stars in another galaxy – similar in a way to studying martian material brought to our planet by meteorites.
- "Stars can be accelerated to high velocities when they interact with a supermassive black hole," Elena explains. "So the presence of these stars might be a sign of such black holes in nearby galaxies. But the stars may also have once been part of a binary system, flung towards the Milky Way when their companion star exploded as a supernova. Either way, studying them could tell us more about these kinds of processes in nearby galaxies."
- An alternative explanation is that the newly identified sprinting stars could be native to our Galaxy's halo, accelerated and pushed inwards through interactions with one of the dwarf galaxies that fell towards the Milky Way during its build-up history. Additional information about the age and composition of the stars could help the astronomers clarify their origin.
- "A star from the Milky Way halo is likely to be fairly old and mostly made of hydrogen, whereas stars from other galaxies could contain lots of heavier elements," says Tommaso. - "Looking at the colors of stars tells us more about what they are made of."
- New data will help nail down the nature and origin of these stars with more certainty, and the team will use ground-based telescopes to find out more about them. In the meantime, Gaia continues to make observations of the full sky, including the stars analyzed in this study.
- While investigating the nature of these possible stellar interlopers, the team is also busy digging into the full dataset from Gaia's second release, searching for more high-speed stars and looking forward to the future. At least two more Gaia data releases are planned in the 2020s, and each will provide both more precise and new information on a larger set of stars.
- "We eventually expect full 3D velocity measurements for up to 150 million stars," explains co-author Anthony Brown, chair of the Gaia Data Processing and Analysis Consortium Executive. "This will help find hundreds or thousands of hypervelocity stars, understand their origin in much more detail, and use them to investigate the Galactic center environment as well as the history of our Galaxy," he adds.
- "This exciting result shows that Gaia is a true discovery machine, providing the ground for completely unexpected discoveries about our Galaxy," concludes Timo Prusti, Gaia project scientist at ESA (Ref. 32).
• September 25, 2018: Using data from ESA's Gaia stellar surveyor, astronomers have identified four stars that are possible places of origin of ‘Oumuamua, an interstellar object spotted during a brief visit to our Solar System in 2017. 34)
- The discovery last year sparked a large observational campaign: originally identified as the first known interstellar asteroid, the small body was later revealed to be a comet, as further observations showed it was not slowing down as fast as it should have under gravity alone. The most likely explanation of the tiny variations recorded in its trajectory was that they are caused by gasses emanating from its surface, making it more akin to a comet.
- But where in the Milky Way did this cosmic traveller come from?
- Comets are leftovers of the formation of planetary systems, and it is possible that ‘Oumuamua was ejected from its home star's realm while planets were still taking shape there. To look for its home, astronomers had to trace back in time not only the trajectory of the interstellar comet, but also of a selection of stars that might have crossed paths with this object in the past few million years.
- "Gaia is a powerful time machine for these types of studies, as it provides not only star positions but also their motions," explains Timo Prusti, Gaia project scientist at ESA.
- To this aim, a team of astronomers led by Coryn Bailer-Jones at the Max Planck Institute for Astronomy in Heidelberg, Germany, dived into the data from Gaia's second release, which was made public in April. 35)
- The Gaia data contain positions, distance indicators and motions on the sky for more than a billion stars in our Galaxy; most importantly, the data set includes radial velocities – how fast they are moving towards or away from us – for a subset of seven million, enabling a full reconstruction of their trajectories. The team looked at these seven million stars, complemented with an extra 220,000 for which radial velocities are available from the astronomical literature.
- As a result, Coryn and colleagues identified four stars whose orbits had come within a couple of light years of ‘Oumuamua in the near past, and with relative velocities low enough to be compatible with likely ejection mechanisms.
- All four are dwarf stars – with masses similar to or smaller than our Sun's – and had their ‘close' encounter with the interstellar comet between one and seven million years ago. However, none of them is known to either harbor planets or to be part of a binary stellar system; a giant planet or companion star would be the preferred mechanism to have ejected the small body.
- While future observations of these four stars might shed new light on their properties and potential to be the home system of ‘Oumuamua, the astronomers are also looking forward to future releases of Gaia data. At least two are planned in the 2020s, which will include a much larger sample of radial velocities, enabling them to reconstruct and investigate the trajectories of many more stars.
- "While it's still early to pinpoint ‘Oumuamua's home star, this result illustrates the power of Gaia to delve into the history of our Milky Way galaxy," concludes Timo.
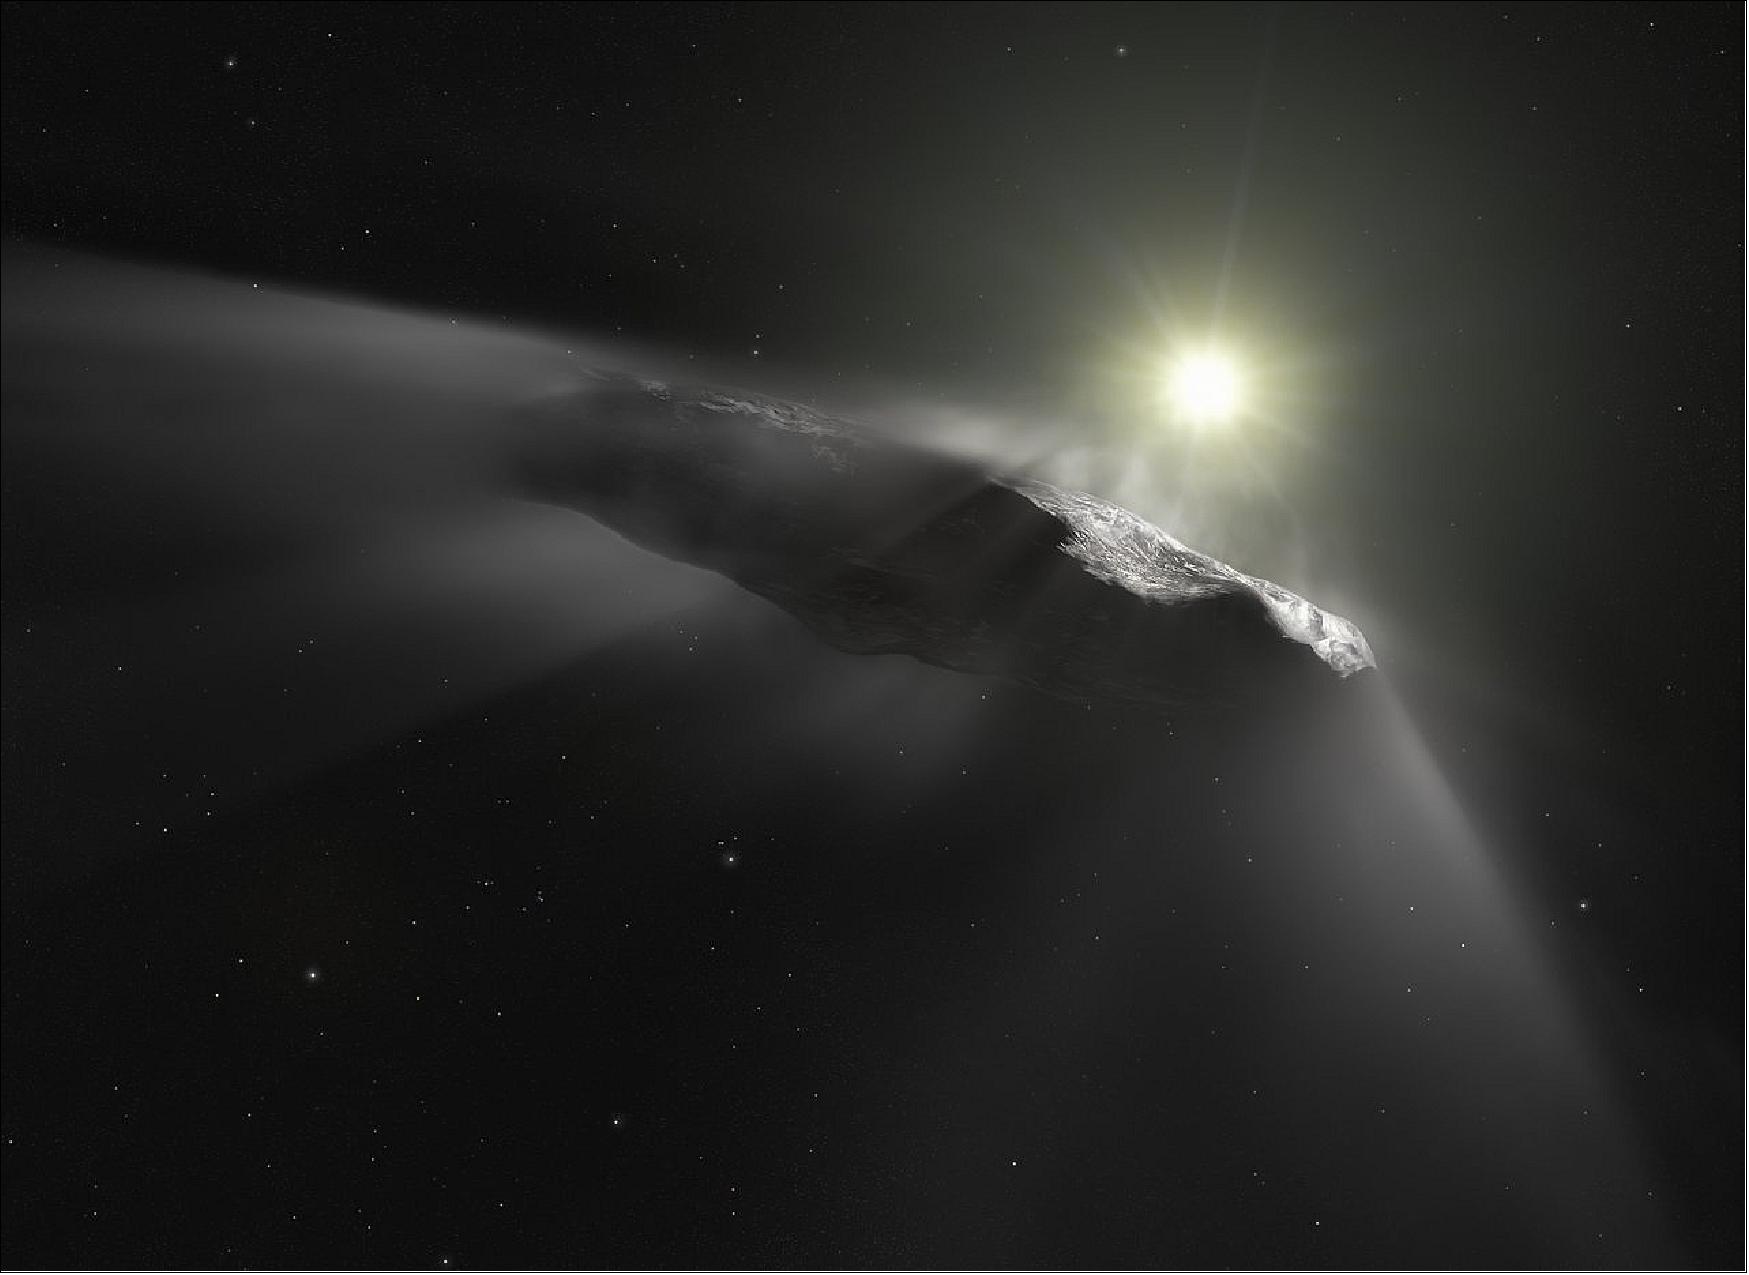
• September 19, 2018: ESA's star mapping mission, Gaia, has shown our Milky Way galaxy is still enduring the effects of a near collision that set millions of stars moving like ripples on a pond. The close encounter likely took place sometime in the past 300–900 million years. It was discovered because of the pattern of movement it has given to stars in the Milky Way disk – one of the major components of our Galaxy. 36)
- The pattern was revealed because Gaia not only accurately measures the positions of more than a billion stars but also precisely measures their velocities on the plane of the sky. For a subset of a few million stars, Gaia provided an estimate of the full three-dimensional velocities, allowing a study of stellar motion using the combination of position and velocity, which is known as ‘phase space'.
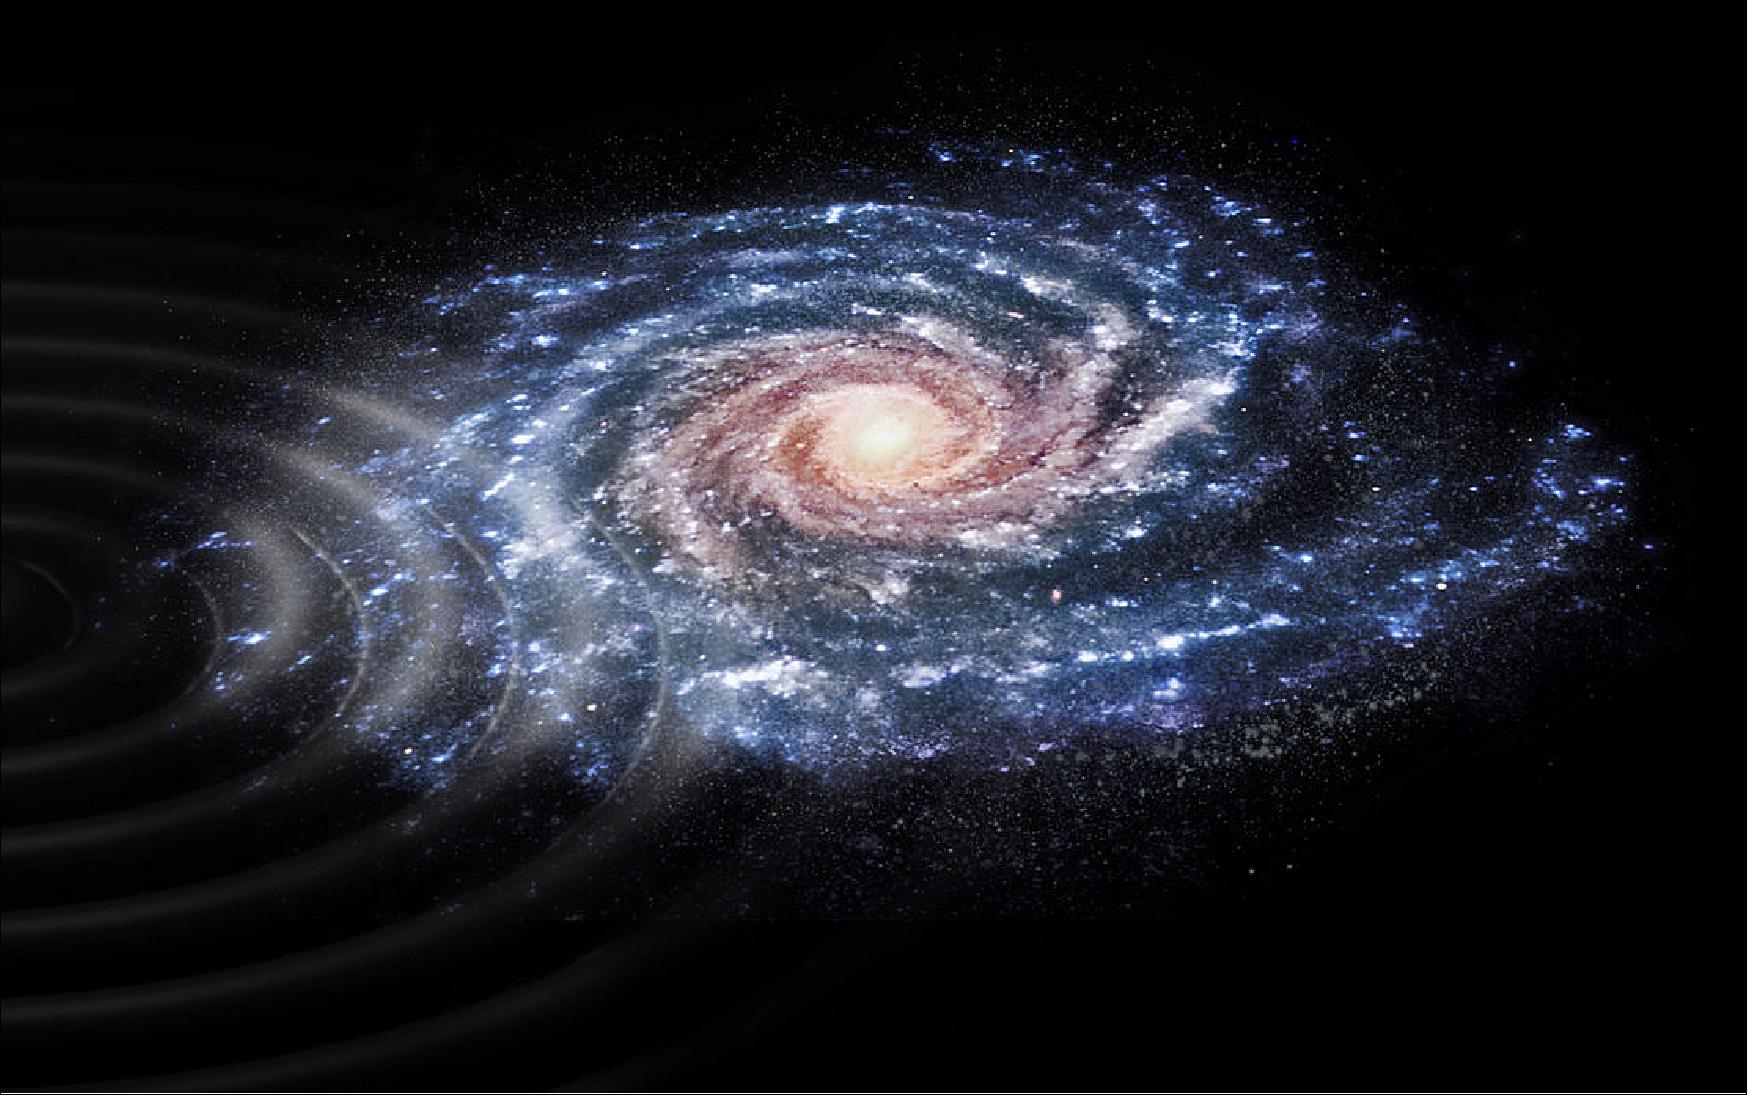
- In phase space, the stellar motions revealed an interesting and totally unexpected pattern when the star's positions were plotted against their velocities. Teresa Antoja from Universitat de Barcelona, Spain, who led the research couldn't quite believe her eyes when she first saw it on her computer screen.
- One shape in particular caught her attention. It was a snail shell-like pattern in the graph that plotted the stars' altitude above or below the plane of the Galaxy against their velocity in the same direction. It had never been seen before. "At the beginning the features were very weird to us," says Teresa. "I was a bit shocked and I thought there could be a problem with the data because the shapes are so clear."
Legend to Figure 39: The snail shell-like shape of the pattern reproduces a feature that was first seen in the movement of stars in the Milky Way disk using data from the second release of ESA's Gaia mission, and interpreted as an imprint of a galactic encounter. - The close encounter revealed by the Gaia data likely took place sometime in the past 300–900 million years, and the culprit could be the Sagittarius dwarf galaxy, a small galaxy containing a few tens of millions of stars that is currently in the process of being cannibalized by the Milky Way.
- But the Gaia data had undergone multiple validation tests by the Gaia Data Processing and Analysis Consortium teams all over Europe before release. Also, together with collaborators, Teresa had performed many tests on the data to look for errors that could be forcing such shapes on the data. Yet no matter what they checked, the only conclusion they could draw was that these features do indeed exist in reality.
- The reason they had not been seen before was because the quality of the Gaia data was a huge step up from what had come before. "It looks like suddenly you have put the right glasses on and you see all the things that were not possible to see before," says Teresa.
- With the reality of the structure confirmed, it came time to investigate why it was there. "It is a bit like throwing a stone in a pond, which displaces the water as ripples and waves," explains Teresa.
- Unlike the water molecules, which settle again, the stars retain a ‘memory' that they were perturbed. This memory is found in their motions. After some time, although the ripples may no longer be easily visible in the distribution of stars, they are still there when you look in their velocities.
- The researchers looked up previous studies that had investigated such ‘phase mixing' in other astrophysical settings and in quantum physics situations. Although no one had investigated this happening in the disk of our Galaxy, the structures were clearly reminiscent of each other.
- "I find this really amazing that we can see this snail shell shape. It is just like it appears in text books," says Amina Helmi, University of Groningen, The Netherlands, a collaborator on the project and the second author on the resulting paper. 37)
- So the next question was what had ‘hit' the Milky Way to cause this behavior in the stars. We know that our Galaxy is a cannibal. It grows by eating smaller galaxies and clusters of stars that then mix in with the rest of the Galaxy. But that didn't seem to be the case here.
- Then Amina recalled her own and others studies of the Sagittarius dwarf galaxy. This small galaxy contains a few tens of millions of stars and is currently in the process of being cannibalized by the Milky Way.
- Its last close pass to our Galaxy was not a direct hit – it passed close by. This would have been enough so that its gravity perturbed some stars in our Galaxy like a stone dropping into water.
- The clincher was that estimates of Sagittarius's last close encounter with the Milky Way place it sometime between 200 and 1000 million years ago, which is almost exactly what Teresa and colleagues calculated as an origin for the beginning of the snail shell-like pattern.
- So far, however, the association of the snail shell feature with the Sagittarius dwarf galaxy is based on simple computer models and analyses. The next step is to scrutinize the phenomenon more fully to gain knowledge of the Milky Way.
- The scientists plan to investigate this galactic encounter as well as the distribution of matter in the Milky Way by using the information contained in the snail shell shape. One thing is certain. There is a lot of work to do.
- "The discovery was easy; the interpretations harder. And the full understanding of its meaning and implications might take several years." said Amina.
- Gaia is one of ESA's cornerstone missions and was designed primarily to investigate the origin, evolution and structure of the Milky Way. In April, it made available its second data release, which is the data that made this discovery possible.
- "This is exactly the kind of discovery we hoped would come from the Gaia data," says Timo Prusti, Gaia project scientist at ESA. "The Milky Way has a rich history to tell, and we are starting to read that story."
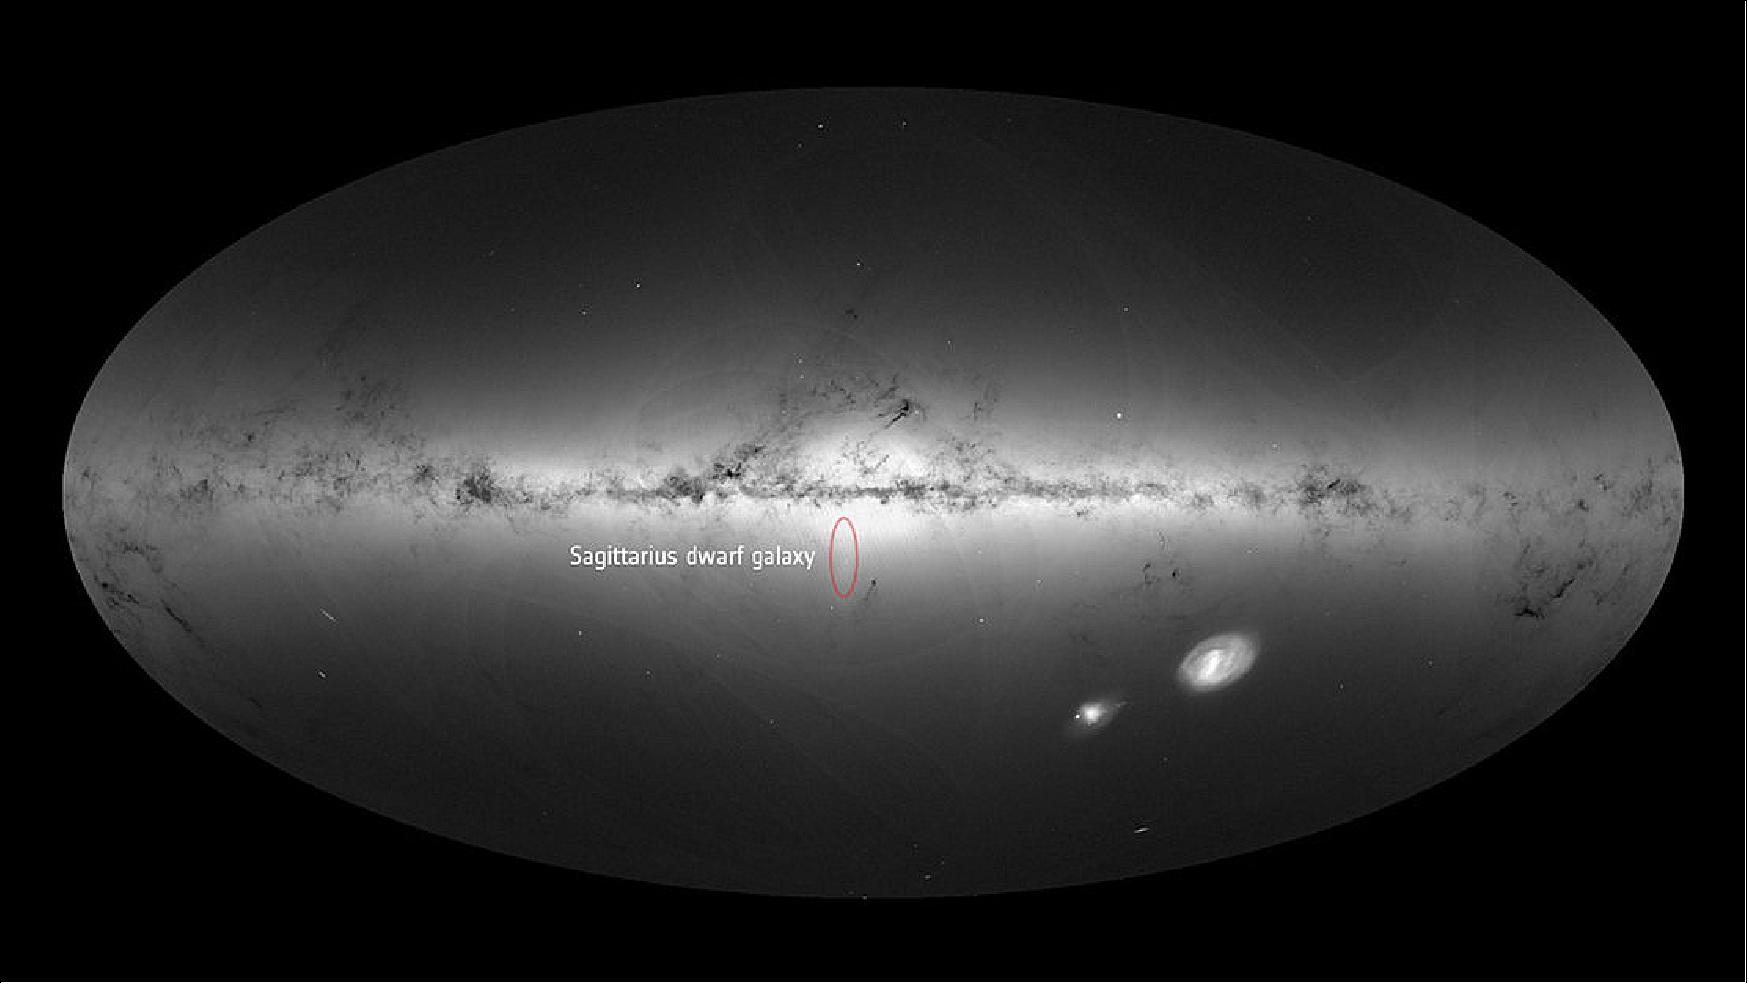
• August 20,2018: The mass of a very young exoplanet has been revealed for the first time using data from ESA's star mapping spacecraft Gaia and its predecessor, the quarter-century retired Hipparcos satellite. 38)
- Astronomers Ignas Snellen and Anthony Brown from Leiden University, the Netherlands, deduced the mass of the planet Beta Pictoris b from the motion of its host star over a long period of time as captured by both Gaia and Hipparcos.
- The planet is a gas giant similar to Jupiter but, according to the new estimate, is 9 to 13 times more massive. It orbits the star Beta Pictoris, the second brightest star in the constellation Pictor.
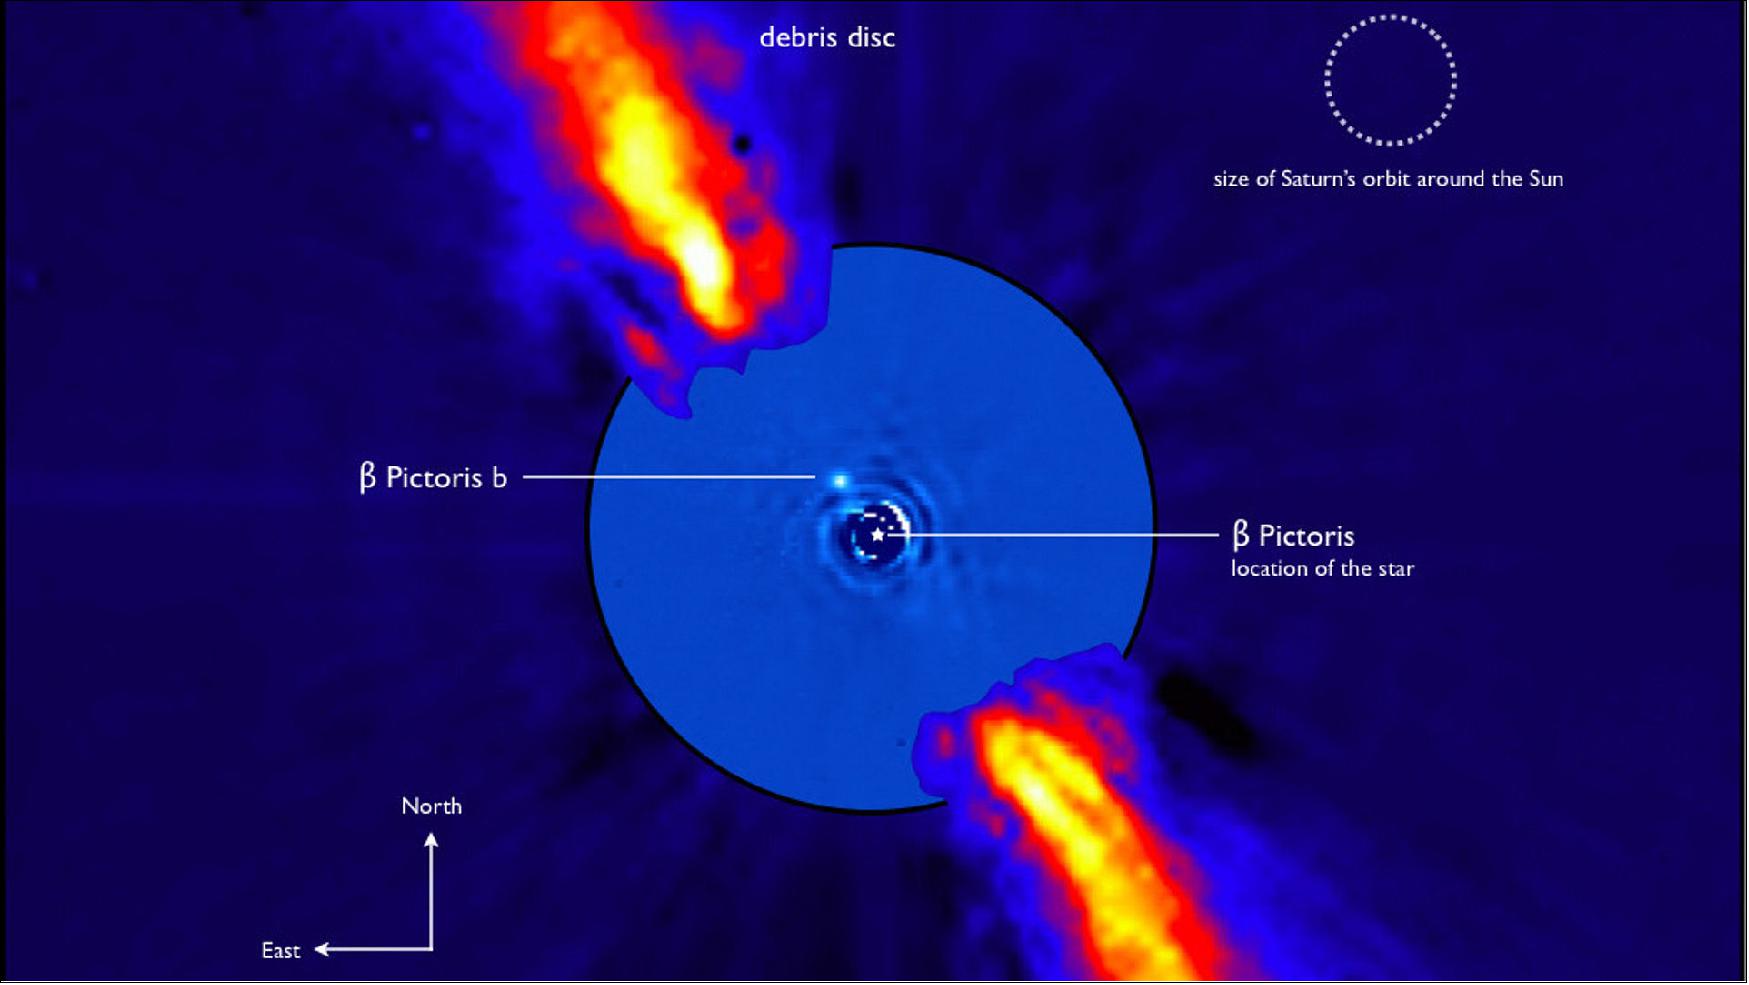
- The planet was only discovered in 2008 in images captured by the VLT (Very Large Telescope) at the European Southern Observatory in Chile. Both the planet and the star are only about 20 million years old – roughly 225 times younger than the Solar System. Its young age makes the system intriguing but also difficult to study using conventional methods.
- "In the Beta Pictoris system, the planet has essentially just formed," says Ignas. "Therefore we can get a picture of how planets form and how they behave in the early stages of their evolution. On the other hand, the star is very hot, rotates fast, and it pulsates."
- This behavior makes it difficult for astronomers to accurately measure the star's radial velocity – the speed at which it appears to periodically move towards and away from the Earth. Tiny changes in the radial velocity of a star, caused by the gravitational pull of planets in its vicinity, are commonly used to estimate masses of exoplanets. But this method mainly works for systems that have already gone through the fiery early stages of their evolution.
- In the case of Beta Pictoris b, upper limits of the planet's mass range had been arrived at before using the radial velocity method. To obtain a better estimate, the astronomers used a different method, taking advantage of Hipparcos' and Gaia's measurements that reveal the precise position and motion of the planet's host star in the sky over time.
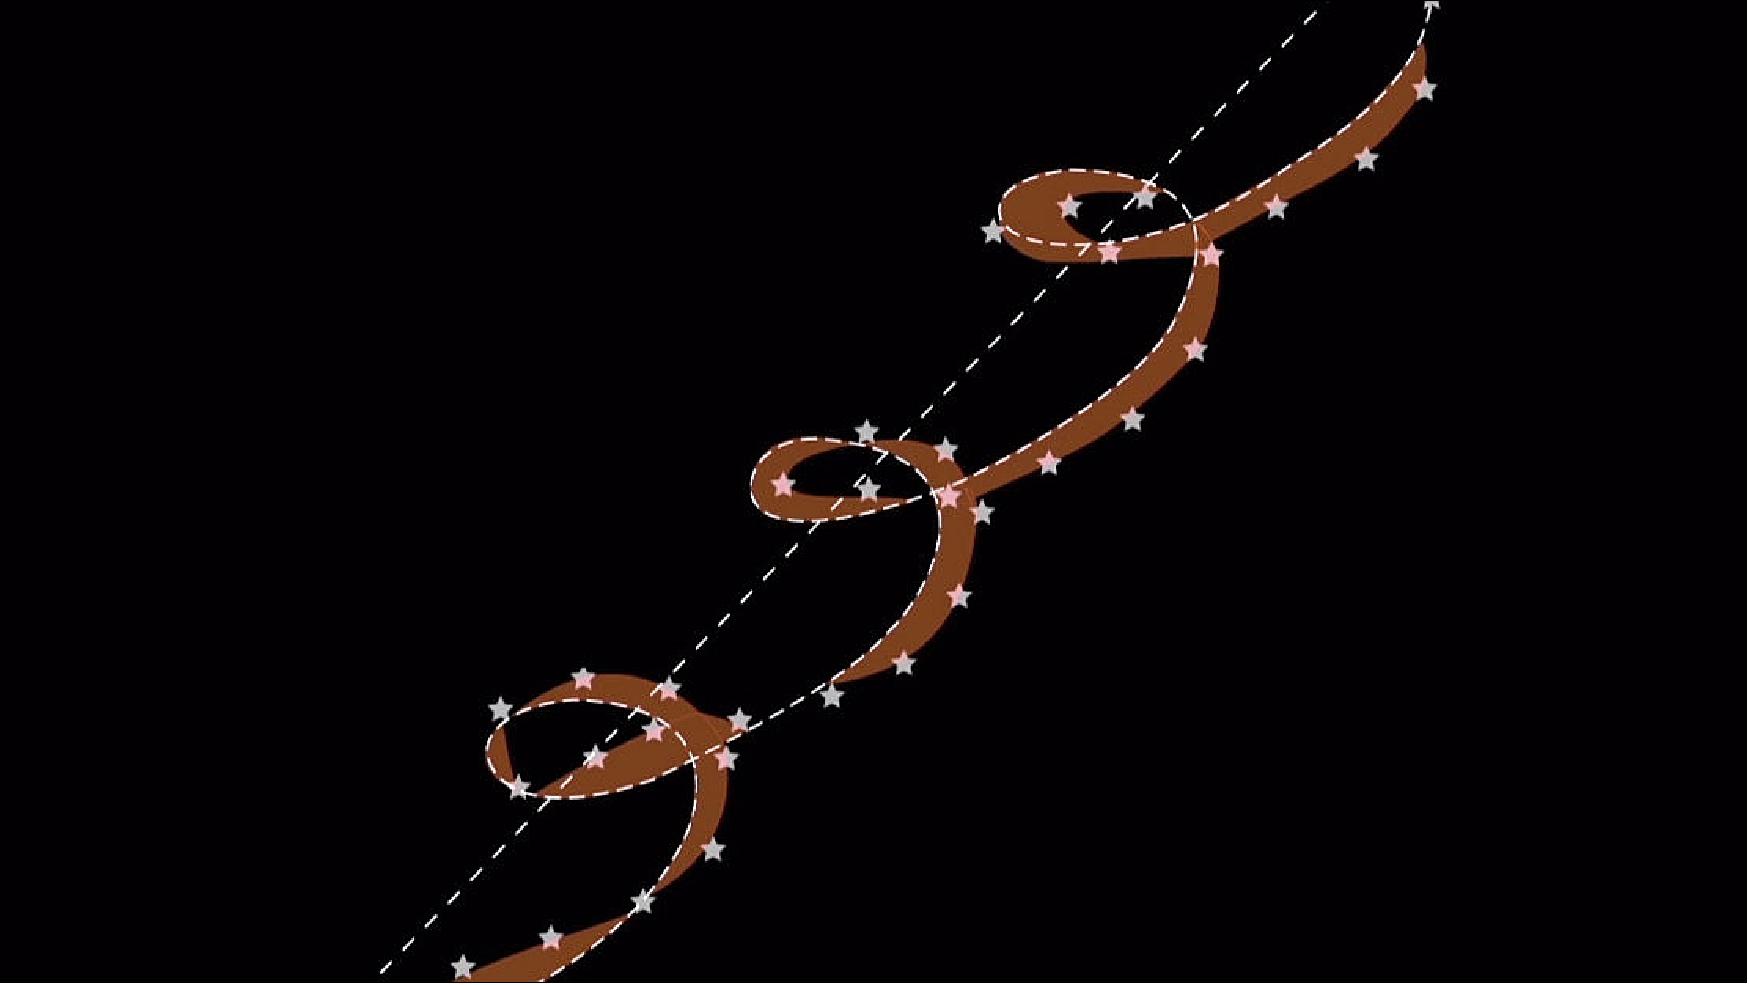
- "The star moves for different reasons," says Ignas. "First, the star circles around the center of the Milky Way, just as the Sun does. That appears from the Earth as a linear motion projected on the sky. We call it proper motion. And then there is the parallax effect, which is caused by the Earth orbiting around the Sun. Because of this, over the year, we see the star from slightly different angles."
- And then there is something that the astronomers describe as ‘tiny wobbles' in the trajectory of the star across the sky – minuscule deviations from the expected course caused by the gravitational pull of the planet in the star's orbit. This is the same wobble that can be measured via changes in the radial velocity, but along a different direction – on the plane of the sky, rather than along the line of sight.
- "We are looking at the deviation from what you expect if there was no planet and then we measure the mass of the planet from the significance of this deviation," says Anthony. "The more massive the planet, the more significant the deviation."
- To be able to make such an assessment, astronomers need to observe the trajectory of the star for a long period of time to properly understand the proper motion and the parallax effect.
- The Gaia mission, designed to observe more than one billion stars in our Galaxy, will eventually be able to provide information about a large amount of exoplanets. In the 22 months of observations included in Gaia's second data release, published in April, the satellite has recorded the star Beta Pictoris about thirty times. That, however, is not enough.
- "Gaia will find thousands of exoplanets, that's still on our to-do list," says Timo Prusti, ESA's Gaia project scientist. "The reason that the exoplanets can be expected only late in the mission is the fact that to measure the tiny wobble that the exoplanets are causing, we need to trace the position of stars for several years."
- Combining the Gaia measurements with those from ESA's Hipparcos mission, which observed Beta Pictoris 111 times between 1990 and 1993, enabled Ignas and Anthony to get their result much faster. This led to the first successful estimate of a young planet's mass using astrometric measurements.
- "By combining data from Hipparcos and Gaia, which have a time difference of about 25 years, you get a very long term proper motion," says Anthony. "This proper motion also contains the component caused by the orbiting planet. Hipparcos on its own would not have been able to find this planet because it would look like a perfectly normal single star unless we had measured it for a much longer time. Now, by combining Gaia and Hipparcos and looking at the difference in the long term and the short term proper motion, we can see the effect of the planet on the star."
- The result represents an important step towards better understanding the processes involved in planet formation, and anticipates the exciting exoplanet discoveries that will be unleashed by Gaia's future data releases. 40)
• August 20, 2018: The second data release of ESA's Gaia mission, made in April, has marked a turning point in the study of our Galactic home, the Milky Way. With an unprecedented catalog of 3D positions and 2D motions of more than a billion stars, plus additional information on smaller subsets of stars and other celestial sources, Gaia has provided astronomers with an astonishing resource to explore the distribution and composition of the Galaxy and to investigate its past and future evolution. 41)
- The majority of stars in the Milky Way are located in the Galactic disc, which has a flattened shape characterized by a pattern of spiral arms similar to that observed in spiral galaxies beyond our own. However, it is particularly challenging to reconstruct the distribution of stars in the disc, and especially the design of the Milky Way's arms, because of our position within the disc itself. — This is where Gaia's measurements can make the difference.
- The image of Figure 43 shows a 3D map obtained by focusing on one particular type of object: OB stars, the hottest, brightest and most massive stars in our Galaxy. Because these stars have relatively short lives – up to a few tens of million years – they are mostly found close to their formation sites in the Galactic disc. As such, they can be used to trace the overall distribution of young stars, star formation sites, and the Galaxy's spiral arms.
- The map, based on 400,000 of this type of star within less than 10,000 light-years from the Sun, was created by Kevin Jardine, a software developer and amateur astronomer with an interest in mapping the Milky Way using a variety of astronomical data.
- It is centered on the Sun and shows the Galactic disc as if we were looking at it face-on from a vantage point outside the Galaxy.
- To deal with the massive number of stars in the Gaia catalog, Kevin made use of so-called density isosurfaces, a technique that is routinely used in many practical applications, for example to visualize the tissue of organs of bones in CT (Computer Tomography) scans of the human body. In this technique, the 3D distribution of individual points is represented in terms of one or more smooth surfaces that delimit regions with a different density of points.
- Here, regions of the Galactic disc are shown with different colors depending on the density of ionizing stars recorded by Gaia; these are the hottest among OB stars, shining with ultraviolet radiation that knocks electrons off hydrogen atoms to give them their ionized state.
- The regions with the highest density of these stars are displayed in pink/purple shades, regions with intermediate density in violet/light blue, and low-density regions in dark blue. Additional information from other astronomical surveys was also used to map concentrations of interstellar dust, shown in green, while known clouds of ionized gas are depicted as red spheres.
- The appearance of ‘spokes' is a combination of dust clouds blocking the view to stars behind them and a stretching effect of the distribution of stars along the line of sight.
- An interactive version of this map is also available as part of Gaia Sky, a real-time, 3D astronomy visualization software that was developed in the framework of the Gaia mission at the Astronomisches Rechen-Institut, University of Heidelberg, Germany.
- Further details including annotated version of the map: Mapping and visualizing Gaia DR2.
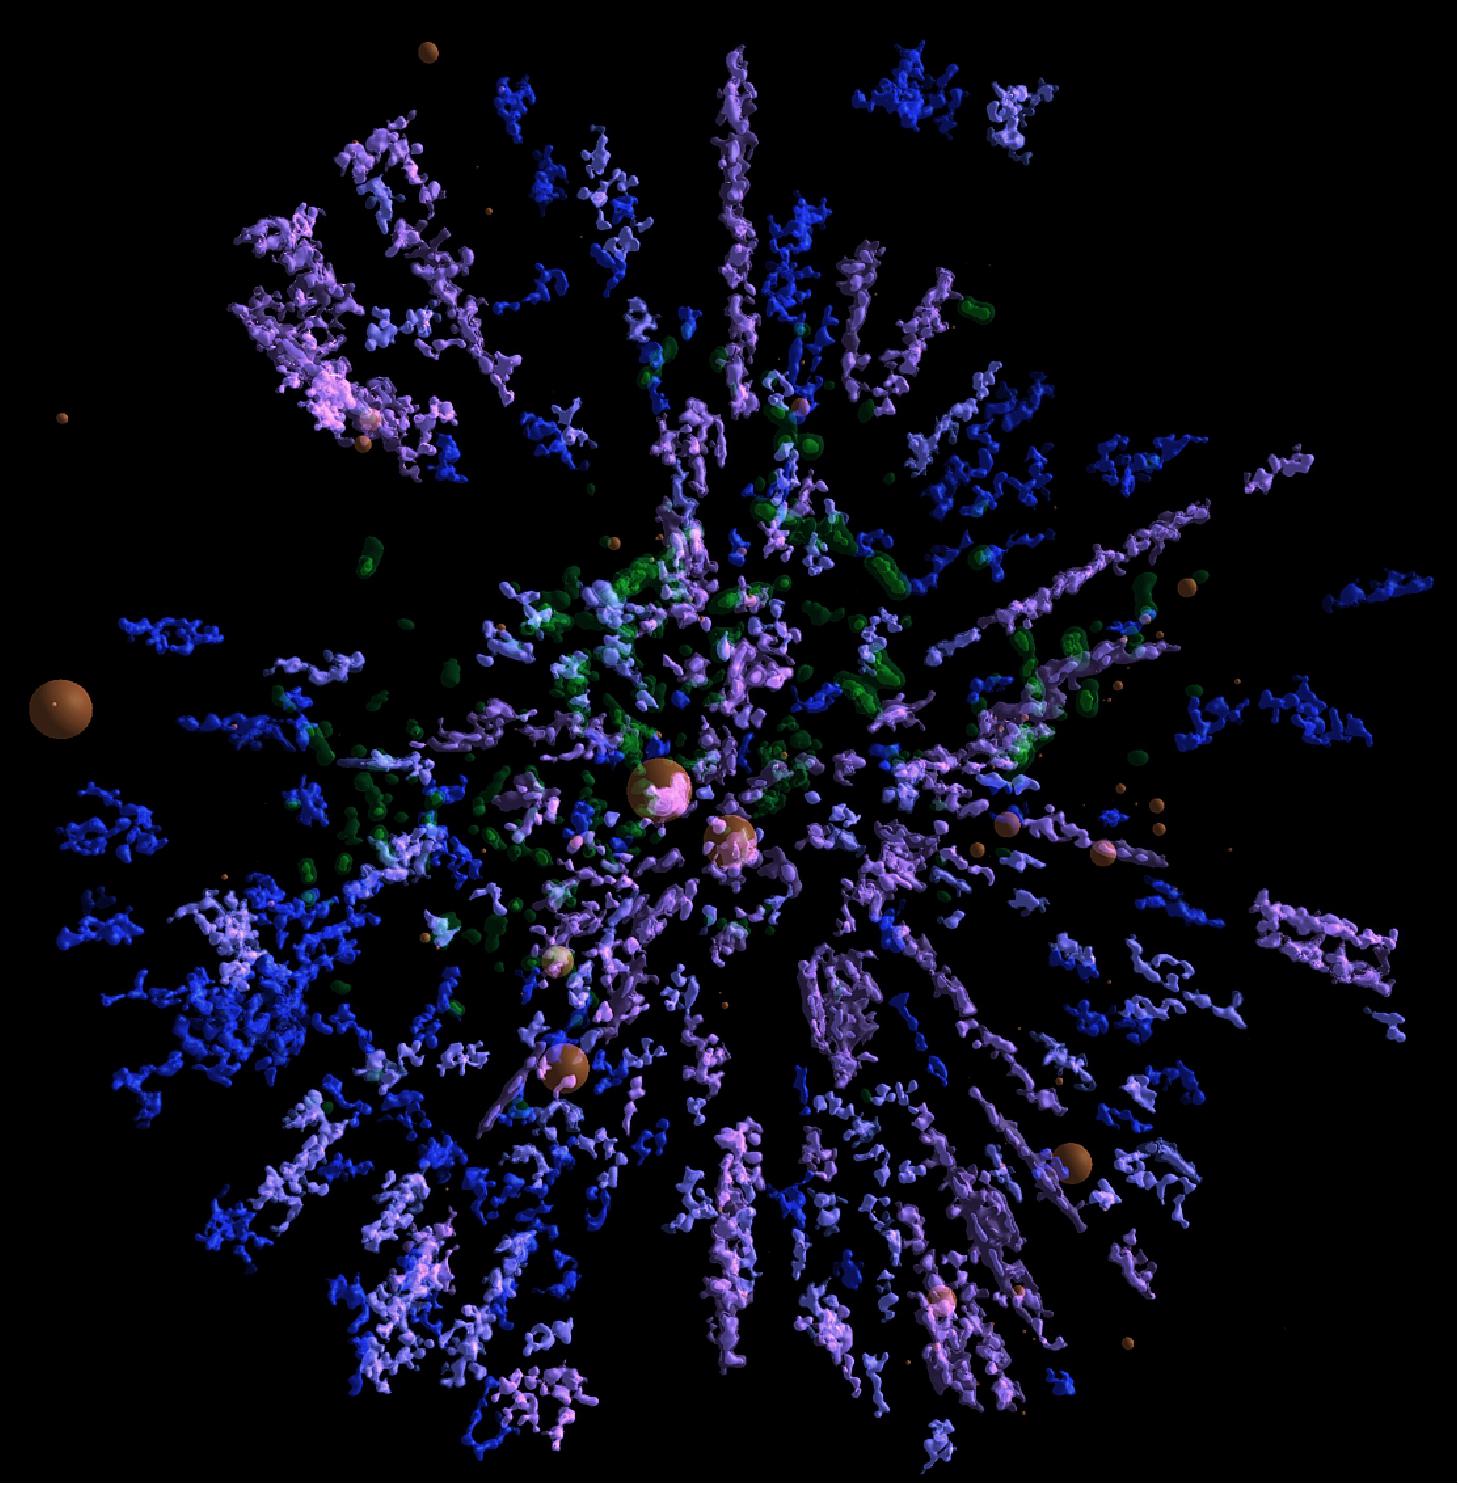
• April 25, 2018: Gaia's second release of the star catalog. ESA's Gaia mission has produced the richest star catalog to date, including high-precision measurements of nearly 1.7 billion stars and revealing previously unseen details of our home Galaxy. A multitude of discoveries are on the horizon after this much awaited release, which is based on 22 months of charting the sky. The new data includes positions, distance indicators and motions of more than one billion stars, along with high-precision measurements of asteroids within our Solar System and stars beyond our own Milky Way Galaxy. 42) 43)
Note 1: A series of scientific papers describing the data contained in the release and their validation process will appear in a special issue of Astronomy & Astrophysics.
Note 2: A series of 360-degree videos and other Virtual Reality visualization resources are available at http://sci.esa.int/gaia-vr
- Preliminary analysis of this phenomenal data reveals fine details about the make-up of the Milky Way's stellar population and about how stars move, essential information for investigating the formation and evolution of our home Galaxy. -"The observations collected by Gaia are redefining the foundations of astronomy," says Günther Hasinger, ESA Director of Science.
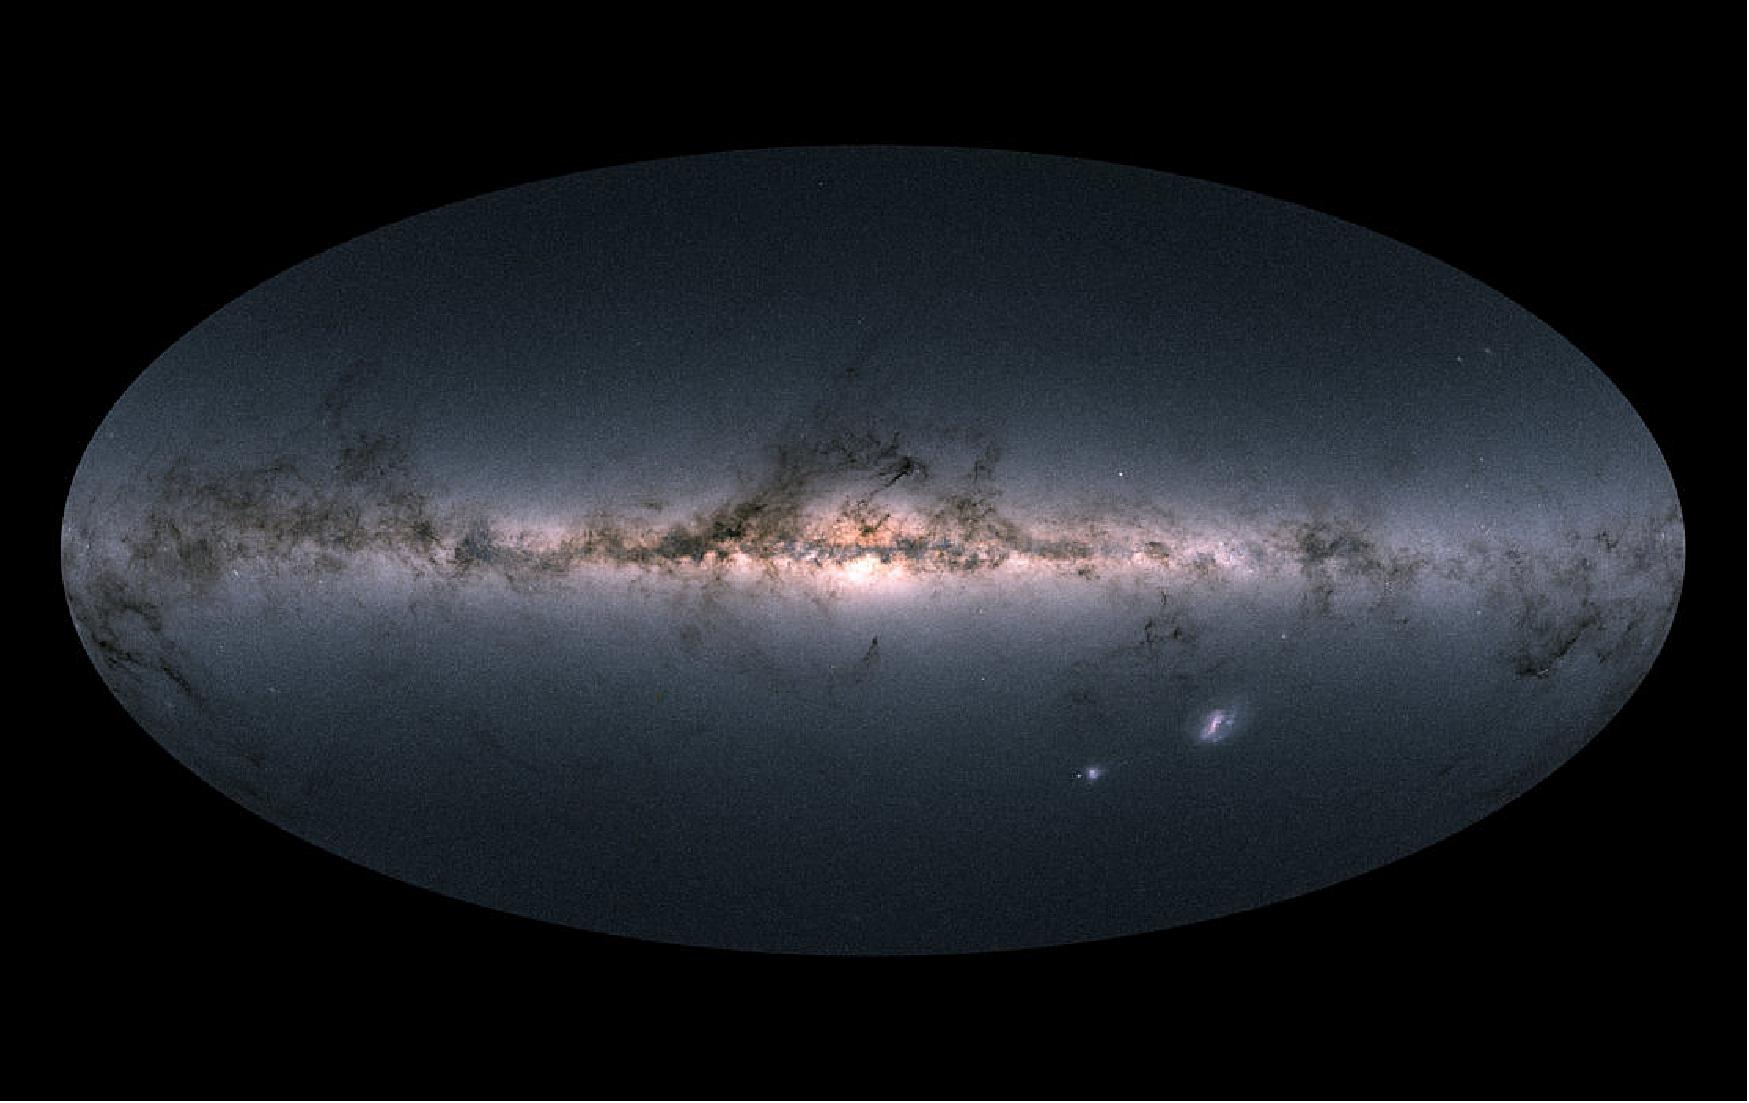
Legend to Figure 44: Brighter regions indicate denser concentrations of especially bright stars, while darker regions correspond to patches of the sky where fewer bright stars are observed. The color representation is obtained by combining the total amount of light with the amount of blue and red light recorded by Gaia in each patch of the sky.
The bright horizontal structure that dominates the image is the Galactic plane, the flattened disc that hosts most of the stars in our home Galaxy. In the middle of the image, the Galactic center appears vivid and teeming with stars. Darker regions across the Galactic plane correspond to foreground clouds of interstellar gas and dust, which absorb the light of stars located further away, behind the clouds. Many of these conceal stellar nurseries where new generations of stars are being born.
Sprinkled across the image are also many globular and open clusters – groupings of stars held together by their mutual gravity, as well as entire galaxies beyond our own.
The two bright objects in the lower right of the image are the Large and Small Magellanic Clouds, two dwarf galaxies orbiting the Milky Way.
In small areas of the image where no color information was available – to the lower left of the Galactic center, to the upper left of the Small Magellanic Cloud, and in the top portion of the map – an equivalent greyscale value was assigned.
The second Gaia data release was made public on 25 April 2018 and includes the position and brightness of almost 1.7 billion stars, and the parallax, proper motion and color of more than 1.3 billion stars. It also includes the radial velocity of more than seven million stars, the surface temperature of more than 100 million stars, and the amount of dust intervening between us and of 87 million stars. There are also more than 500,000 variable sources, and the position of 14,099 known Solar System objects – most of them asteroids – included in the release.
A complementary image showing Gaia's density map of the stars is available here.

- "Gaia is an ambitious mission that relies on a huge human collaboration to make sense of a large volume of highly complex data. It demonstrates the need for long-term projects to guarantee progress in space science and technology and to implement even more daring scientific missions of the coming decades."
- Gaia was launched in December 2013 and started science operations the following year. The first data release, based on just over one year of observations, was published in 2016; it contained distances and motions of two million stars.
- The new data release, which covers the period between 25 July 2014 and 23 May 2016, pins down the positions of nearly 1.7 billion stars, and with a much greater precision. For some of the brightest stars in the survey, the level of precision equates to Earth-bound observers being able to spot a Euro coin lying on the surface of the Moon.
- The new catalog lists the parallax and velocity across the sky, or proper motion, for more than 1.3 billion stars. From the most accurate parallax measurements, about ten per cent of the total, astronomers can directly estimate distances to individual stars.
- "The second Gaia data release represents a huge leap forward with respect to ESA's Hipparcos satellite, Gaia's predecessor and the first space mission for astrometry, which surveyed some 118 000 stars almost thirty years ago," says Anthony Brown of Leiden University, The Netherlands. Anthony is the chair of the Gaia Data Processing and Analysis Consortium Executive, overseeing the large collaboration of about 450 scientists and software engineers entrusted with the task of creating the Gaia catalogue from the satellite data.
- As well as positions, the data include brightness information of all surveyed stars and color measurements of nearly all, plus information on how the brightness and color of half a million variable stars change over time. It also contains the velocities along the line of sight of a subset of seven million stars, the surface temperatures of about a hundred million and the effect of interstellar dust on 87 million.
- Gaia also observes objects in our Solar System: the second data release comprises the positions of more than 14 000 known asteroids, which allows precise determination of their orbits. A much larger asteroid sample will be compiled in Gaia's future releases.
- Further afield, Gaia closed in on the positions of half a million distant quasars, bright galaxies powered by the activity of the supermassive black holes at their cores. These sources are used to define a reference frame for the celestial coordinates of all objects in the Gaia catalog, something that is routinely done in radio waves but now for the first time is also available at optical wavelengths.
- Major discoveries are expected to come once scientists start exploring Gaia's new release. An initial examination performed by the data consortium to validate the quality of the catalog has already unveiled some promising surprises – including new insights on the evolution of stars.
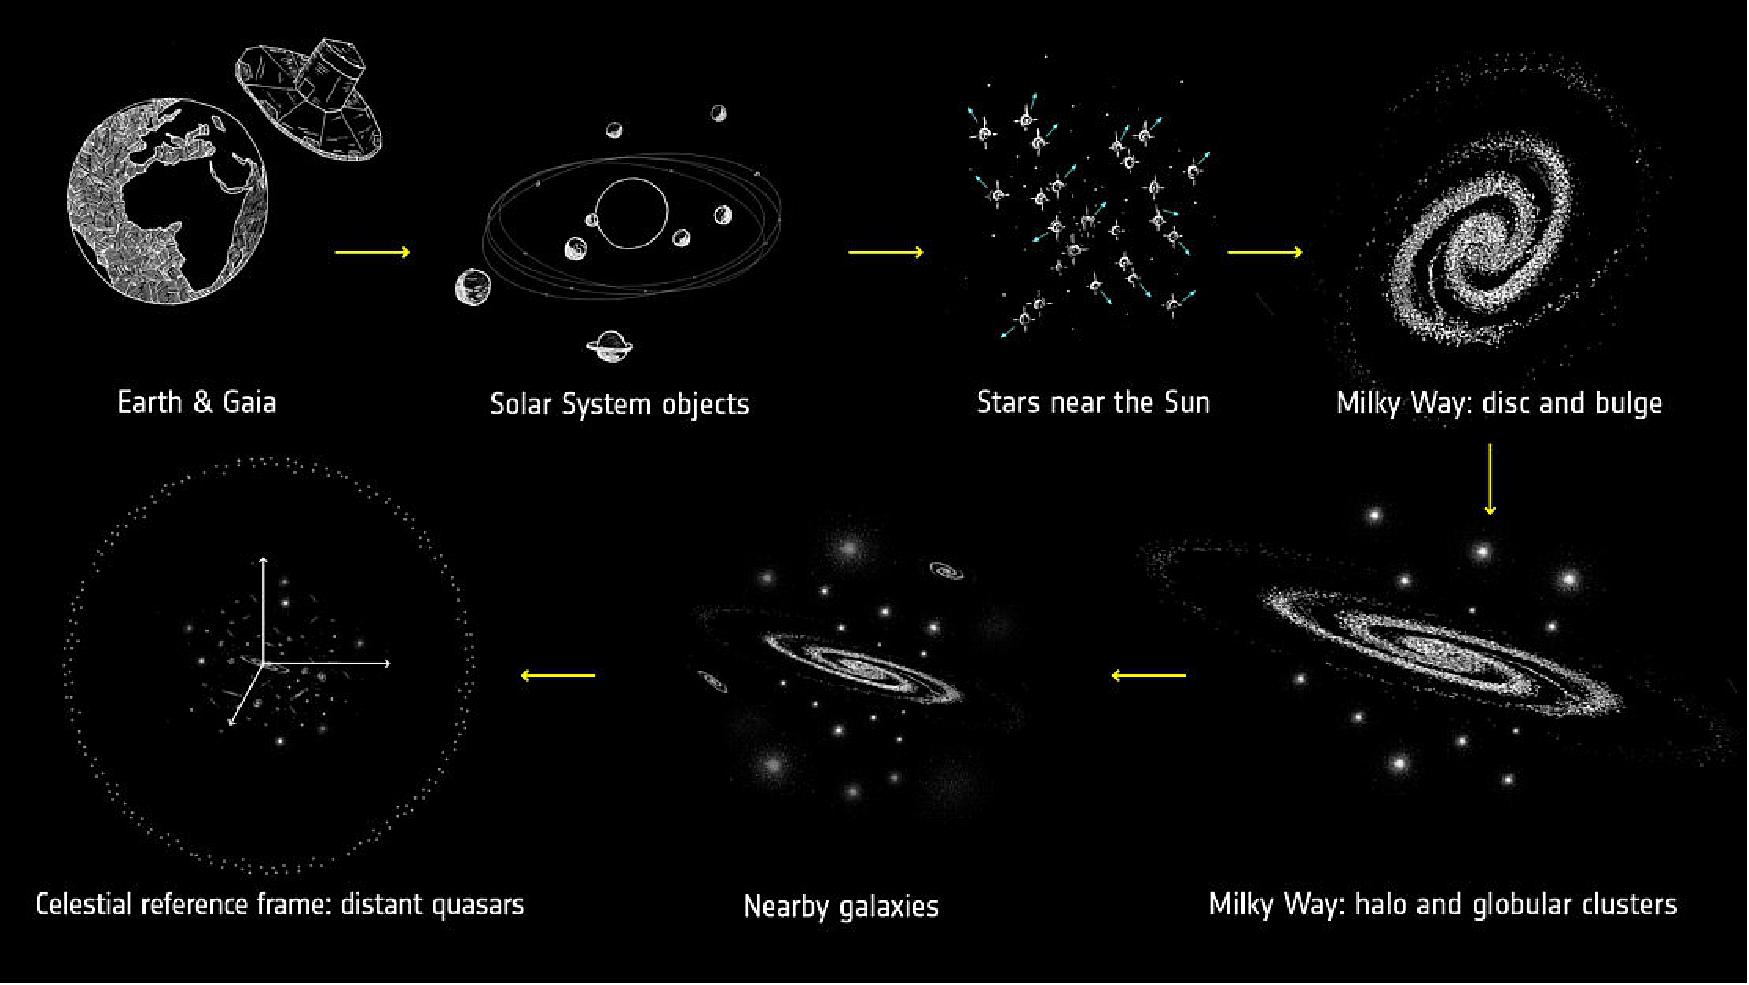
Galactic archeology (Ref. 42)
- "The new Gaia data are so powerful that exciting results are just jumping at us," says Antonella Vallenari from the Istituto Nazionale di Astrofisica (INAF) and the Astronomical Observatory of Padua, Italy, deputy chair of the data processing consortium executive board.
- "For example, we have built the most detailed Hertzsprung-Russell diagram of stars ever made on the full sky and we can already spot some interesting trends. It feels like we are inaugurating a new era of Galactic archeology."
- Hertzsprung-Russell diagram: Named after the two astronomers who devised it in the early twentieth century, the Hertzsprung-Russell diagram compares the intrinsic brightness of stars with their color and is a fundamental tool to study populations of stars and their evolution.
- A new version of this diagram, based on four million stars within five thousand light-years from the Sun selected from the Gaia catalog, reveals many fine details for the first time. This includes the signature of different types of white dwarfs – the dead remnants of stars like our Sun – such that a differentiation can be made between those with hydrogen-rich cores and those dominated by helium.
- Combined with Gaia measurements of star velocities, the diagram enables astronomers to distinguish between various populations of stars of different ages that are located in different regions of the Milky Way, such as the disc and the halo, and that formed in different ways. Further scrutiny suggests that the fast-moving stars thought to belong to the halo encompass two stellar populations that originated via two different formation scenarios, calling for more detailed investigations.
- "Gaia will greatly advance our understanding of the Universe on all cosmic scales," says Timo Prusti, Gaia project scientist at ESA. "Even in the neighborhood of the Sun, which is the region we thought we understood best, Gaia is revealing new and exciting features."
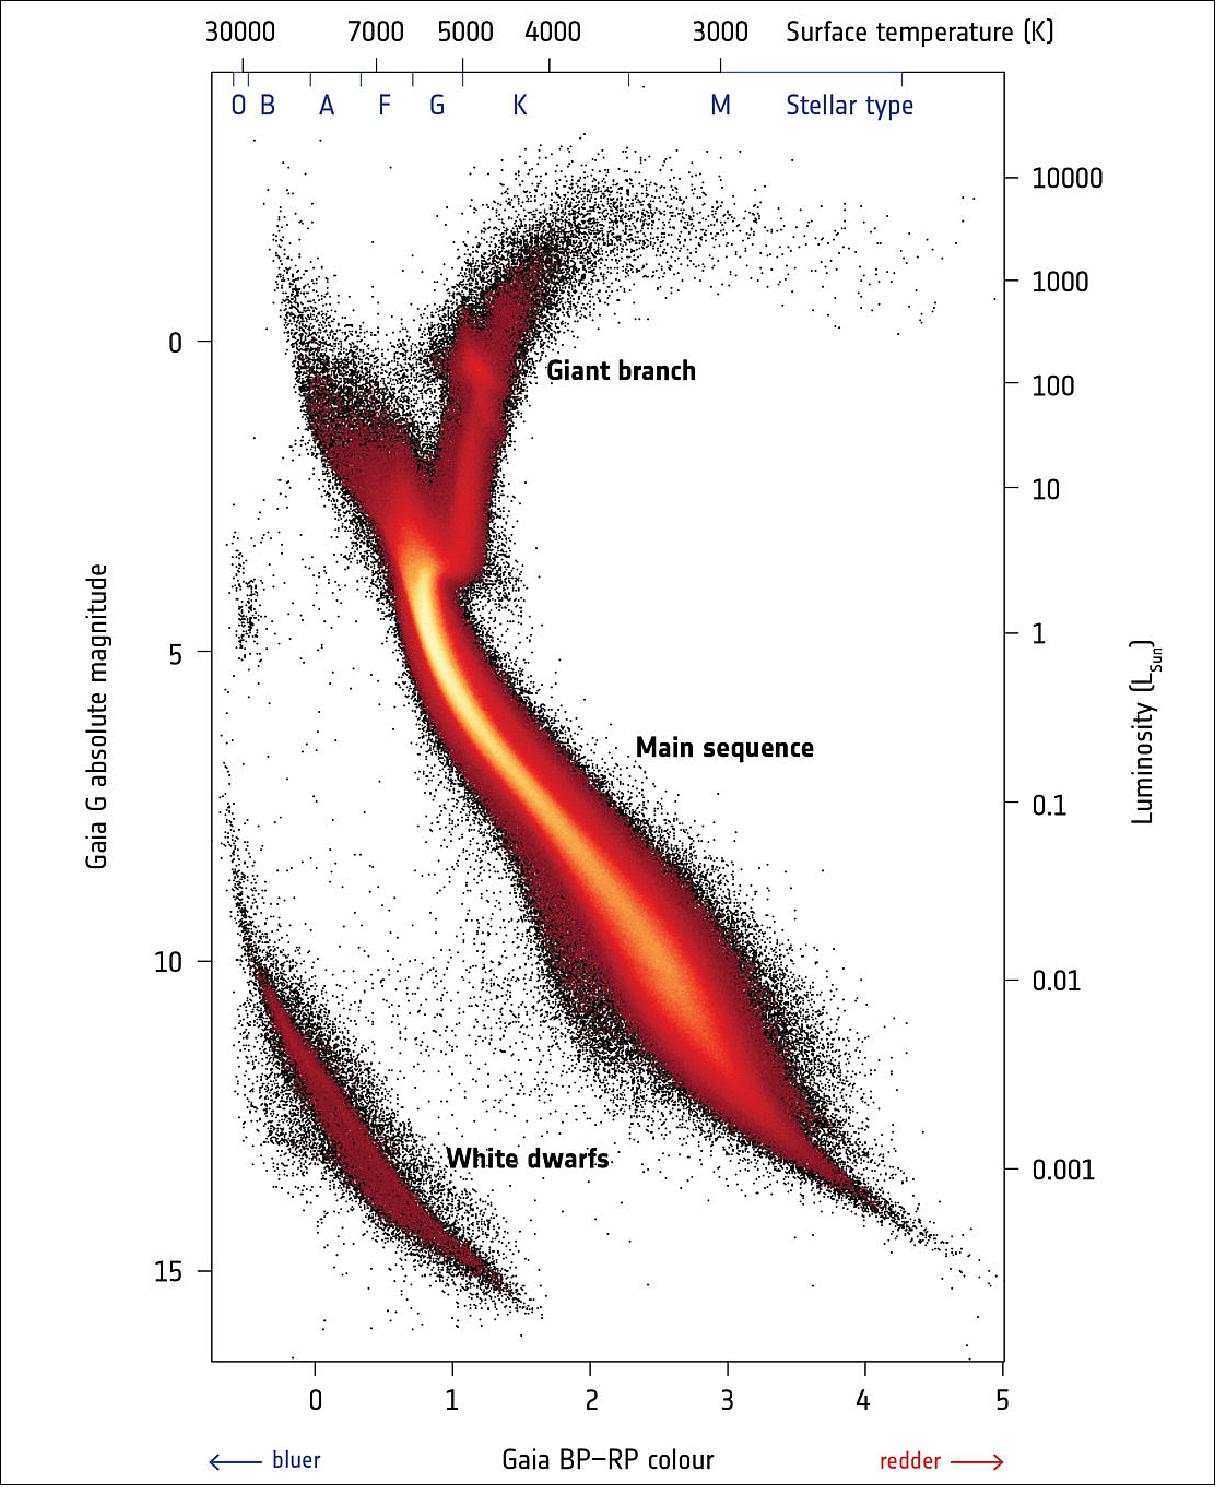
Legend to Figure 47: This Hertzsprung-Russell diagram, obtained by a selection of stars in Gaia's second release catalog, is the most detailed to date made by mapping stars over the entire sky, containing roughly a hundred times more stars than the one obtained using data from ESA's Hipparcos mission, the predecessor of Gaia, in the 1990s. This new diagram contains so much highly accurate information that astronomers have been able to identify fine details that were never before seen.
The Hertzsprung-Russell diagram can be imagined as a stellar family portrait: stars are plotted according to their color (on the horizontal axis) and brightness (on the vertical axis) and are grouped in different regions of the diagram depending mainly on their masses, chemical composition, ages, and stages in the stellar life cycle. Information about stellar distances is fundamental to calculate the true brightness, or absolute magnitude, of stars.
Brighter stars are shown in the top part of the diagram, while fainter stars are in the lower part. Bluer stars, which have hotter surfaces, are on the left, and redder stars, with cooler surfaces, on the right. The color scale in this image does not represent the color of stars but is a representation of how many stars are plotted in each portion of the diagram: black represents lower numbers of stars, while red, orange and yellow correspond to increasingly higher numbers of stars.
The large diagonal stripe across the center of the graph is known as the main sequence. This is where fully-fledged stars that are generating energy by fusing hydrogen into helium are found. Massive stars, which have bluer or whiter colors, are found in the upper left end of the main sequence, while intermediate-mass stars like our Sun, characterized by yellow colors, are located mid-way. Redder, low-mass stars are found towards the lower right.
As stars age they swell up, becoming brighter and redder. Stars experiencing this are shown on the diagram as the vertical arm leading off the main sequence and turning to the right. This is known as the red giant branch.
While the most massive stars swell into red giants and explode as powerful supernovae, stars like our Sun end their days in a less spectacular fashion, eventually turning into white dwarfs – the hot cores of dead stars. These are found in the lower left of the diagram.
The huge leap forward from Hipparcos to Gaia is especially visible in the white dwarf region of the diagram. While Hipparcos had obtained reliable distance measurements to only a handful of white dwarfs, more than 35,000 such objects are included in this diagram based on Gaia data. This allows astronomers to see the signature of different types of white dwarfs such that a differentiation can be made between those with hydrogen-rich cores and those dominated by helium.
Galaxy in 3D (Ref. 42)
- For a subset of stars within a few thousand light-years of the Sun, Gaia has measured the velocity in all three dimensions, revealing patterns in the motions of stars that are orbiting the Galaxy at similar speeds.
- Future studies will confirm whether these patterns are linked to perturbations produced by the Galactic bar, a denser concentration of stars with an elongated shape at the center of the Galaxy, by the spiral arm architecture of the Milky Way, or by the interaction with smaller galaxies that merged with it billions of years ago.
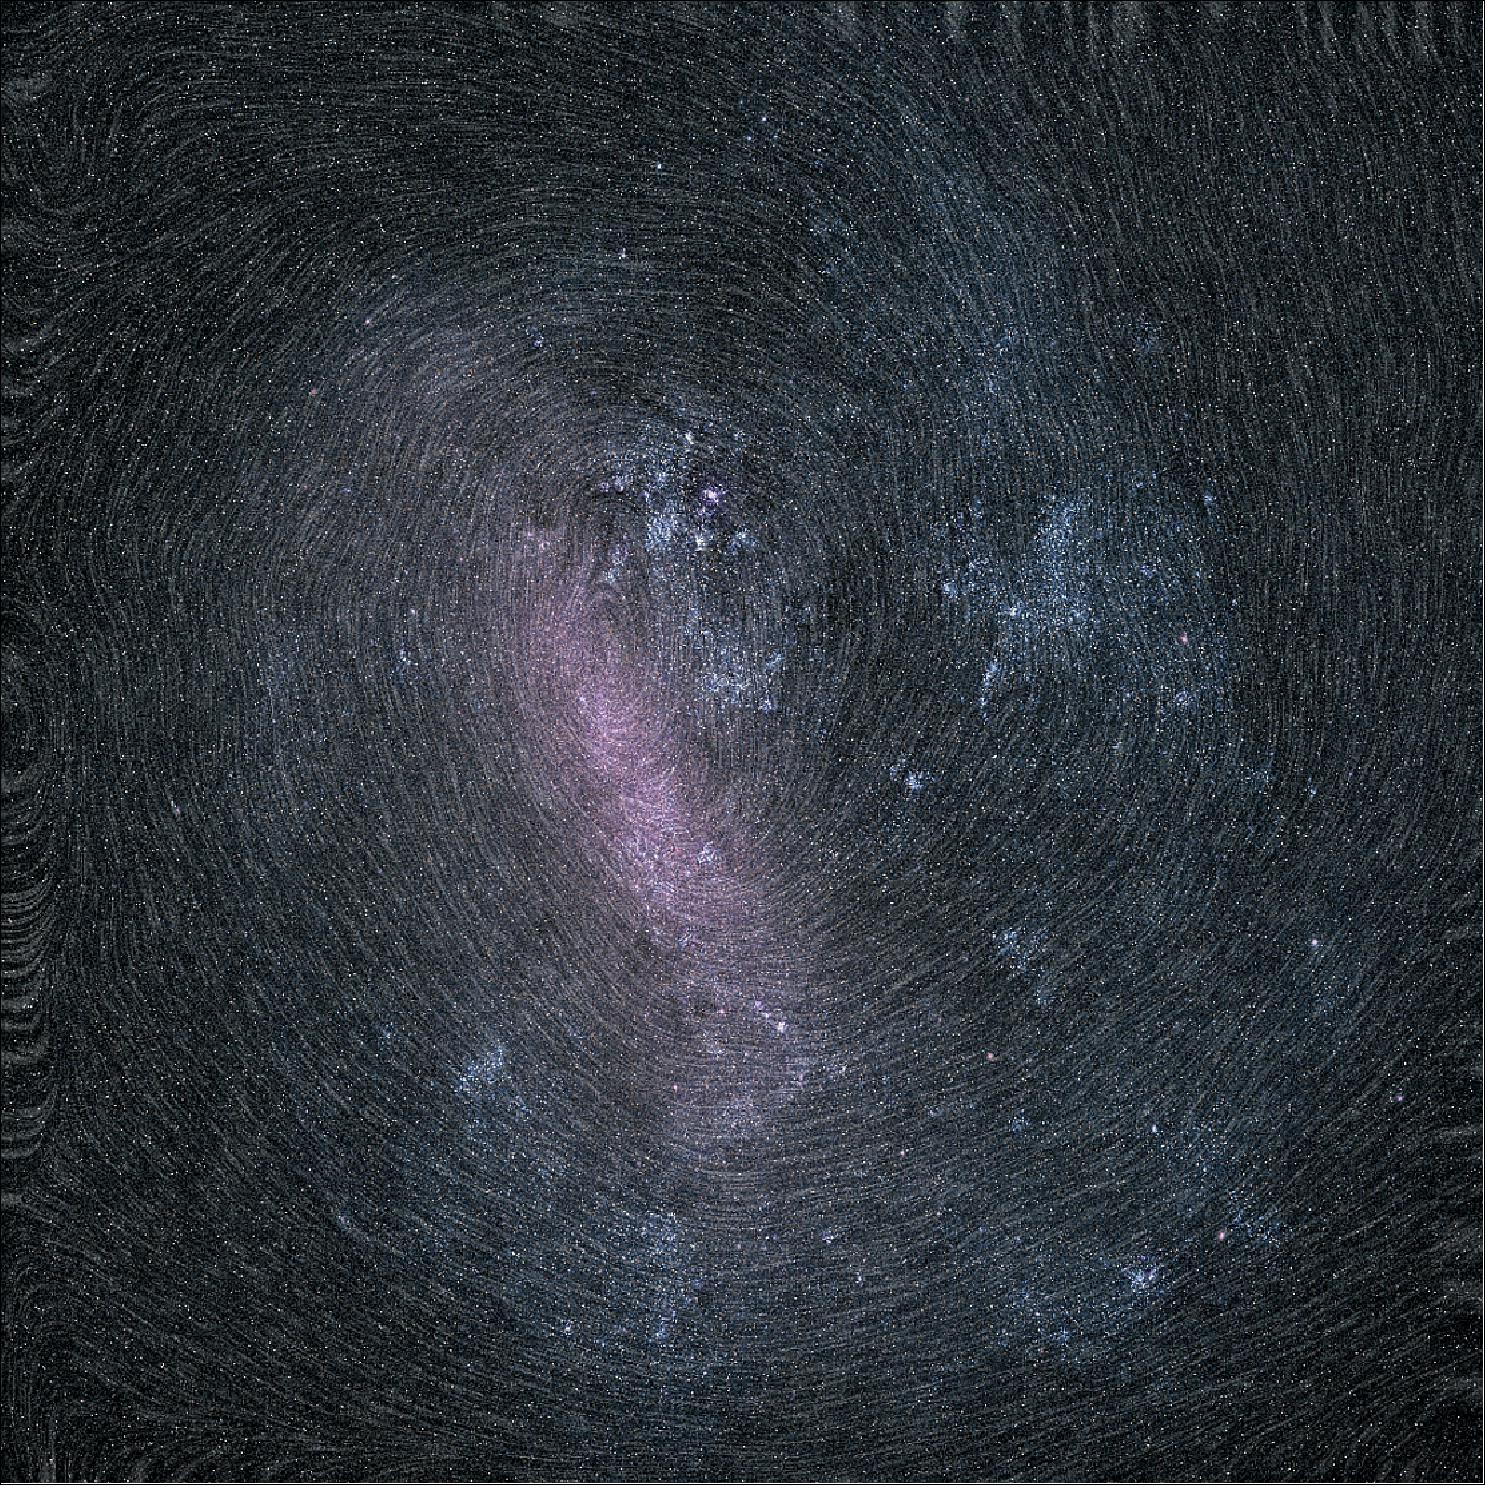
Legend to Figure 48: This image combines the total amount of radiation detected by Gaia in each pixel with measurements of the radiation taken through different filters on the spacecraft to generate color information. Information about the proper motion of stars – their velocity across the sky – is represented as the texture of the image.
Measuring the proper motion of several million stars in the LCM, astronomers were able to see an imprint of the stars rotating clockwise around the center of the galaxy. The image processing technique used to create this image is called Line Integral Convolution.
• April 3, 2018: What is the first creature that comes to mind when you look at the dark cloud in this image of Figure 49? Perhaps a dark kitten with a vivid white nose, front paws stretching towards the right of the frame and tail up towards the left? Or perhaps a fox, running with its mouth open and looking ahead, its vigilant eyes pointing to the right? 49) 50)
- In fact, this animal-themed shape belongs to a dark nebula, a dense cloud of gas and dust in the constellation of Orion, the Hunter, with the cat's nose (or fox's eye) corresponding to the Orion Nebula Cluster, a star cluster near the famous Orion Nebula, M42. The image is based on data from the first release of ESA's Gaia satellite, and shows the density of stars observed while scanning that region of the sky.
- While this particular nebula is not visible to the naked eye, similar clouds can be seen against the bright background of the Milky Way from dark locations in the southern hemisphere. Finding shapes in these dark nebulas is part of the astronomical tradition of various cultures, from South America to Australia, that include ‘dark cloud constellations' resembling a variety of creatures in their firmaments.
- Launched in 2013, Gaia has been charting more than a billion stars to unprecedented accuracy. This information is extremely valuable to astronomers who are studying the distribution of stars across our Galaxy.
- Even in the dark patches where fewer stars are observed, Gaia's meticulous census provides important information to study the interstellar material that blocks starlight. It is in these dark clouds of gas and dust that new generations of stars come to life.
- The first data release from Gaia, published in 2016, contained the position on the sky of more than a billion stars, as well as the distance and motions of about two million stars. Astronomers worldwide are now looking forward to the next data release, planned for 25 April, which will include the distance and motions for the full sample of stars, greatly extending the reach of the previous survey.
- So far, Gaia data have been used to study only the most nearby regions of star formation, within several hundred light-years of us. With the new data, it will be possible to investigate in great detail regions that are much farther away, like the Orion star-forming complex, located some 1500 light-years from us, and to estimate the 3D distribution not only of stars but also of the dusty dark clouds where stars are born.
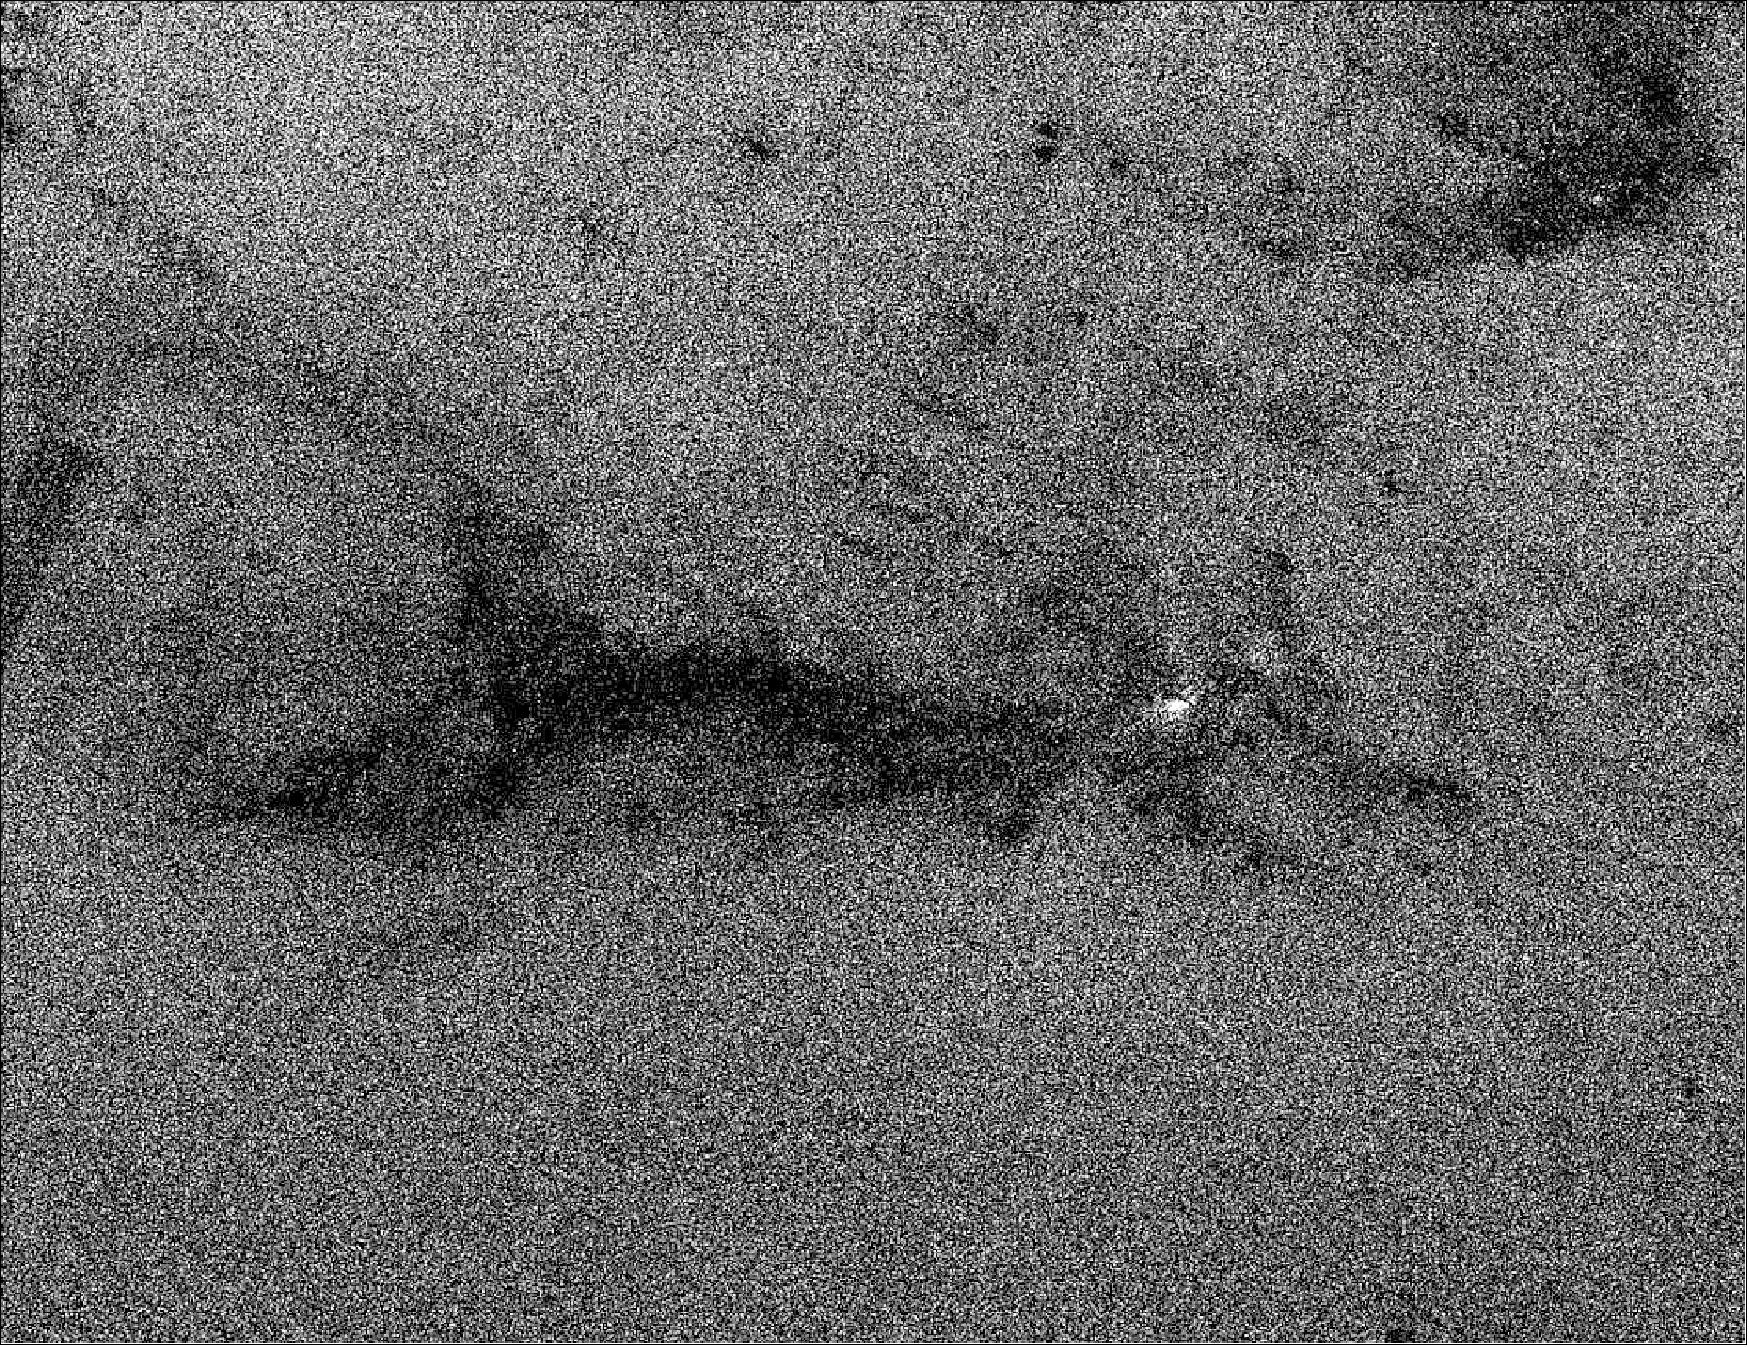
• March 21, 2018: Last month, ESA's Gaia satellite experienced a technical anomaly followed by a 'safe mode' event. After thorough examination, the spacecraft was successfully recovered and resumed normal scientific operations, while the mission team keeps investigating the exact cause of the anomaly. 51)
- On 18 February, errors of two electrical units on the service module of Gaia led the spacecraft to trigger an automatic safe mode. Safe modes occur when certain spacecraft parameters fall out of their normal operating ranges and the spacecraft automatically takes measures to preserve its safety. During this safe mode, the science instruments were disabled in order to protect them, and telecommunication with Earth took place through the spacecraft's low-gain antenna.
- Following the anomaly, the mission team conducted an initial inquiry into what caused the spacecraft to activate the safe mode. They quickly identified the problem as deriving from a failure in one of the two transponders on board Gaia, but the root cause of the malfunction is still being investigated. After an in-depth inquiry, the team recovered the satellite, which went back to its normal scientific operations on 28 February using the second identical back-up transponder.
- The team is still investigating the origin of the anomaly and its possible relation to the lifetime of the second transponder. Meanwhile, Gaia has been collecting data since it resumed operations at the end of last month.
- Scientists worldwide are looking forward to the second data release of Gaia, which will take place on 25 April and is based on observations performed between mid 2014 and mid 2016. The mission has already collected all data needed for its third release; these data will be processed and analyzed over the next few years.
• February 27, 2018: Last year, ESA's Gaia mission helped astronomers make unique observations of Neptune's largest moon, Triton, as it passed in front of a distant star. This is a preview of the superb quality and versatility of the Gaia data that will be released in April. 52)
- When a small Solar System body such as a moon or an asteroid passes in front of a star and temporarily blocks its light, the occultation is an extraordinary chance for astronomers to study the properties of the foreground object. And, of course, the more accurate the prediction of both objects' positions on the sky, the better the observations.
- This is why, when a group of astronomers were planning to observe the rare occultation of a distant star by Neptune's moon Triton on 5 October 2017, they made a special request to the Gaia team.
- The astronomers, led by Bruno Sicardy from Pierre and Marie Curie University and the Observatory of Paris, France, had used all available observations to compute the path that the moon's shadow would sweep across our planet. Within less than three minutes, the occultation would first cross Europe and North Africa, rapidly moving towards North America.
- They knew that somewhere, within this couple of thousand kilometer-wide stretch, would lie a very special thin strip, only about 100-km across. Observers situated on this strip would be perfectly aligned with both Triton and the distant star, and therefore able to see the so-called central flash.
- This sharp brightening of the star happens half way through the occultation, and is caused by focussing of the starlight by deep layers in the moon's atmosphere – about 10 km above surface. The central flash contains all-important information to study the profile of Triton's atmosphere and the possible presence of haze in it.
- To narrow down the best locations to observe the occultation, and possibly the flash, the astronomers turned to Gaia and its unprecedentedly accurate measurements of the positions of more than a billion stars.
- They obtained a first estimate using the star's position from the first batch of Gaia data (Gaia DR1), which were publicly released in 2016. However, knowledge of the star's proper motion – how it moves across the sky over the years – would substantially improve their estimate.
- So they approached the Gaia team, asking to receive extra information about the star's motion across the sky from the upcoming second release of Gaia data (Gaia DR2), which is planned for 25 April 2018.
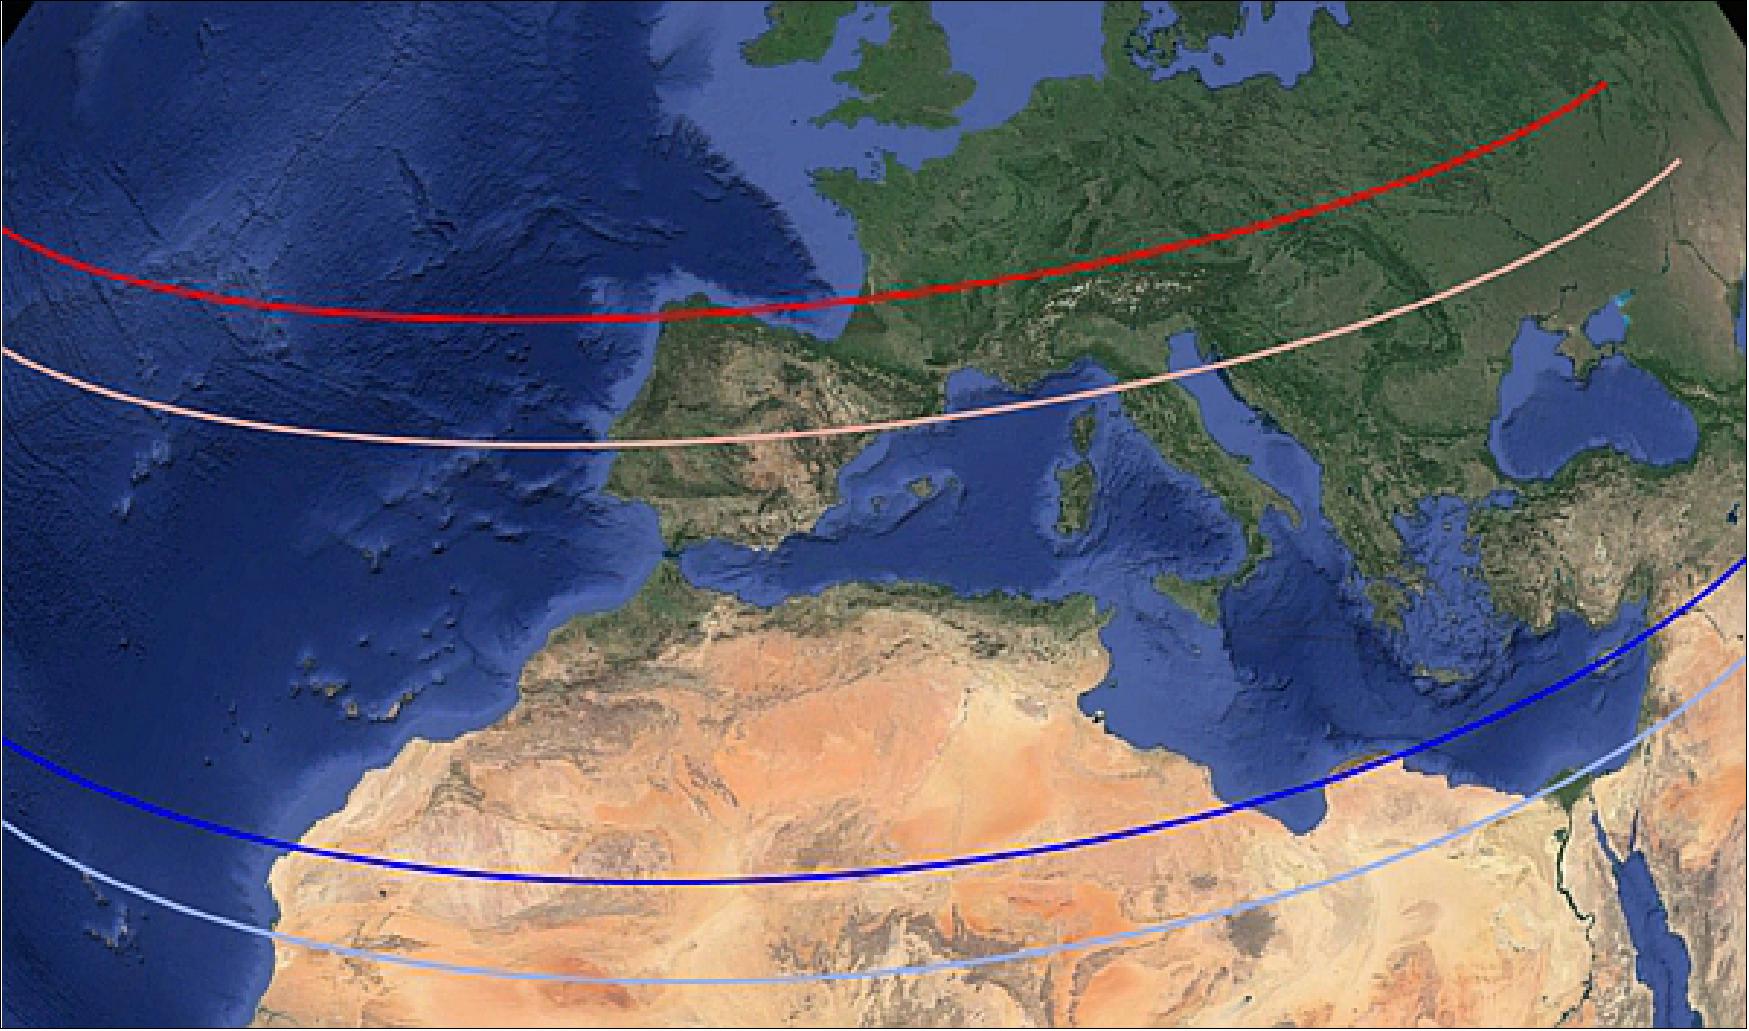
- Having recognized the importance of these observations, the Gaia team published not only the preliminary position and proper motion of the occulted star from DR2, but also the positions of 453 other stars that could be used to refine the estimate of Triton's orbit. With this additional information, they computed again the location of the thin strip where the central flash would be observed, shifting it roughly 300 km southwards of the earlier prediction.
- Come 5 October, a large collaboration of professional as well as amateur astronomers scattered across three continents were ready to observe Triton's occultation at more than a hundred stations.
- Almost eighty of them were able to monitor the phenomenon, and the improved prediction of observing locations based on the specially released, preliminary data from Gaia DR2 led to twenty-five successful detections of the central flash, from Spain and Portugal to the south of France and the north of Italy. The astronomers are now busy analyzing the data collected during this campaign to learn more about the atmosphere of Triton.
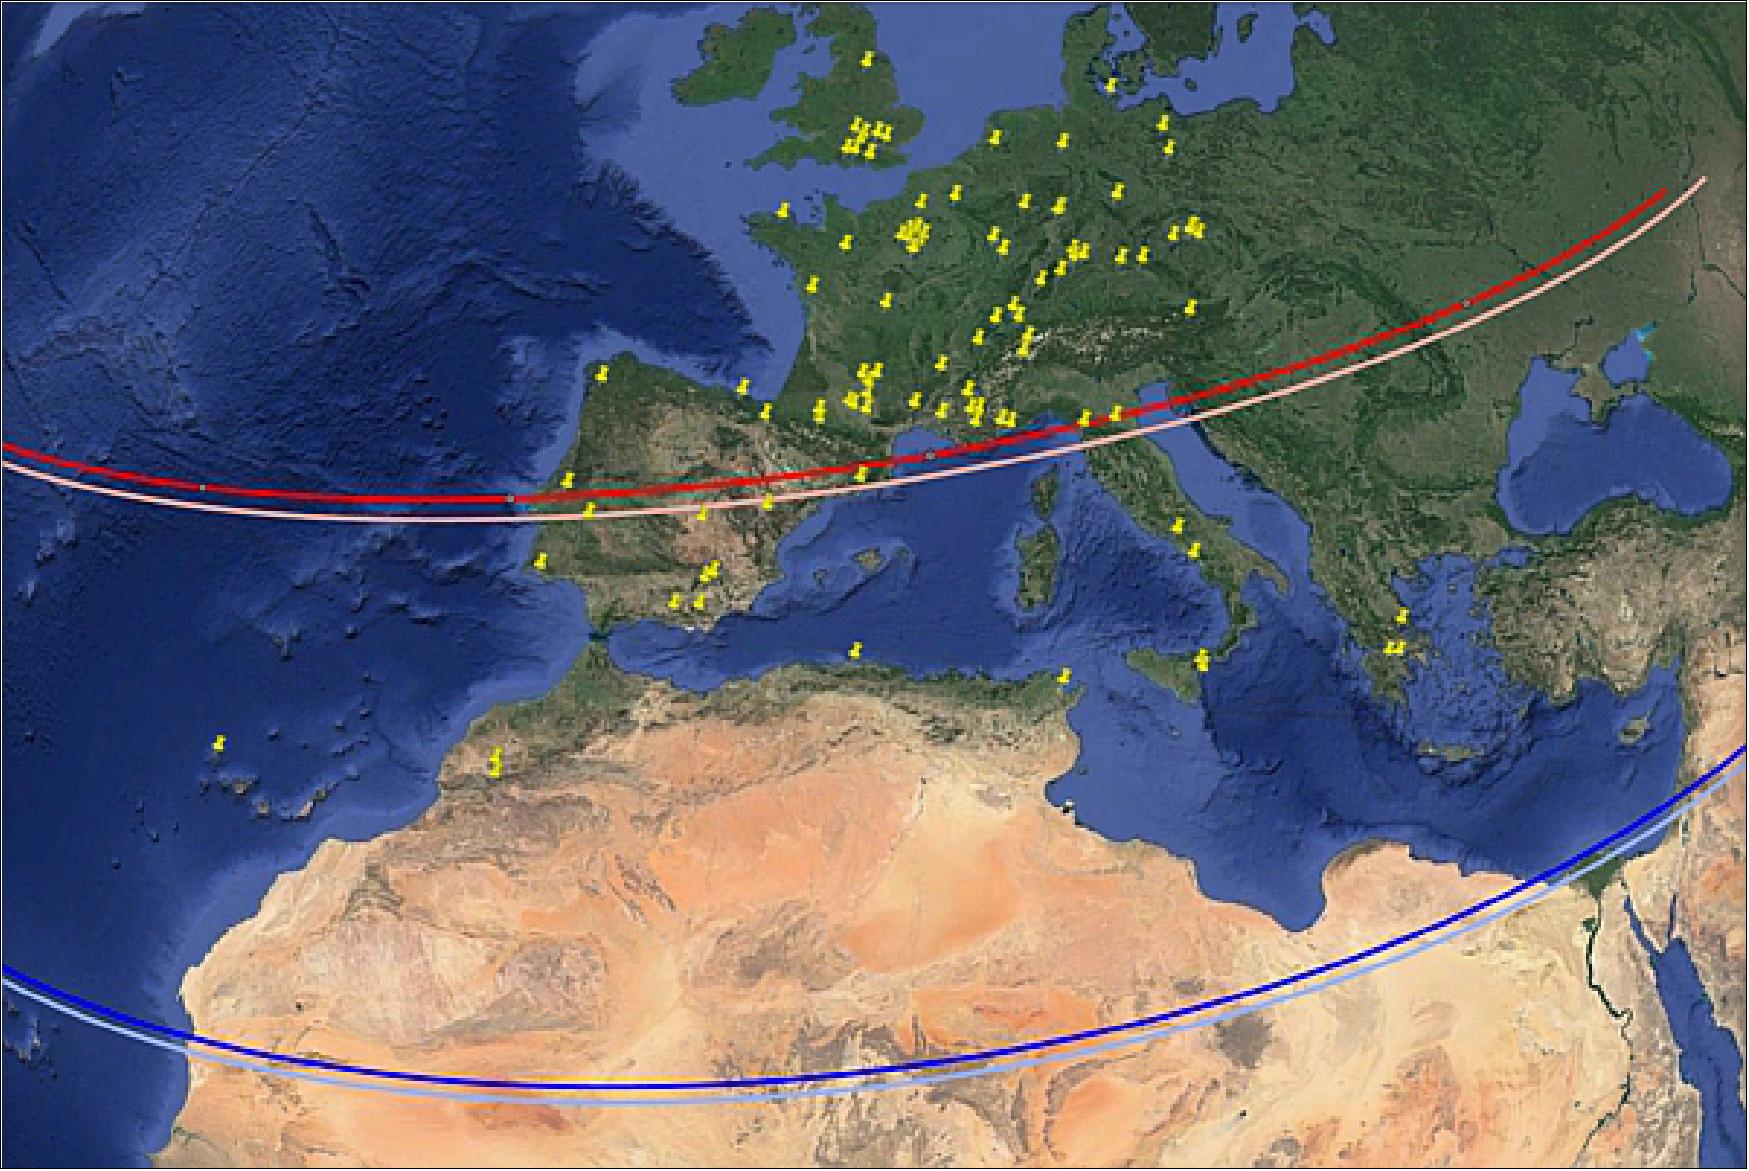
- This occultation was a rare opportunity to detect possible changes in Triton's atmospheric pressure almost thirty years after the flyby of NASA's Voyager probe in August 1989. Observations of the central flash can also provide unique information to detect possible winds near Triton's surface; current analysis of the data indicates a quiet and still atmosphere.
- With the release of the position, parallax and proper motion of more than 1.3 billion stars measured with unprecedented accuracy, Gaia will provide an invaluable resource for all branches of astrophysics. It will also be of great help to professional and amateur astronomers who will be planning the observation of stellar occultations by Solar System bodies in the future, including that of another star by Triton on 6 October 2022.
- The star that was occulted by Triton on 5 October 2017 is UCAC4 410-143659, a 12.7 V-magnitude (12.2 G-magnitude) star, situated in the constellation of Aquarius. — Observations of this occultation by Triton are coordinated by Bruno Sicardy (Université Pierre et Marie Curie and Observatoire de Paris), leader of the ERC Lucky Star project.
• January 29, 2018: If you gazed at the night sky over the past few weeks, it is possible that you stumbled upon a very bright star near the Orion constellation. This is Sirius, the brightest star of the entire night sky, which is visible from almost everywhere on Earth except the northernmost regions. It is, in fact, a binary stellar system, and one of the nearest to our Sun – only eight light-years away. 53)
- Known since antiquity, this star played a key role for the keeping of time and agriculture in Ancient Egypt, as its return to the sky was linked to the annual flooding of the Nile. In Ancient Greek mythology, it represented the eye of the Canis Major constellation, the Great Dog that diligently follows Orion, the Hunter.
- Dazzling stars like Sirius are both a blessing and a curse for astronomers. Their bright appearance provides plenty of light to study their properties, but also outshines other celestial sources that happen to lie in the same patch of sky.
- This is why Sirius has been masked in this picture taken by amateur astronomer Harald Kaiser on 10 January from Karlsruhe, a city in the southwest of Germany.
- Once the glare of Sirius is removed, an interesting object becomes visible to its left: the stellar cluster Gaia 1, first spotted last year using data from ESA's Gaia satellite.
- Gaia 1 is an open cluster – a family of stars all born at the same time and held together by gravity – and it is located some 15,000 light-years away. Its chance alignment next to nearby, bright Sirius kept it hidden to generations of astronomers that have been sweeping the heavens with their telescopes over the past four centuries. But not to the inquisitive eye of Gaia, which has been charting more than a billion stars in our Milky Way galaxy.
- Mr. Kaiser heard about the discovery of this cluster during a public talk on the Gaia mission and zealously waited for a clear sky to try and image it using his 30 cm diameter telescope. After covering Sirius on the telescope sensor – creating the dark circle on the image – he succeeded at recording some of the brightest stars of the Gaia 1 cluster.
- Gaia 1 is one of two previously unknown star clusters that have been discovered by counting stars from the first set of Gaia data, which was released in September 2016. Astronomers are now looking forward to Gaia's second data release, planned for 25 April, which will provide vast possibilities for new, exciting discoveries.
- More information about opportunities for amateur astronomers to follow up on Gaia observations here.
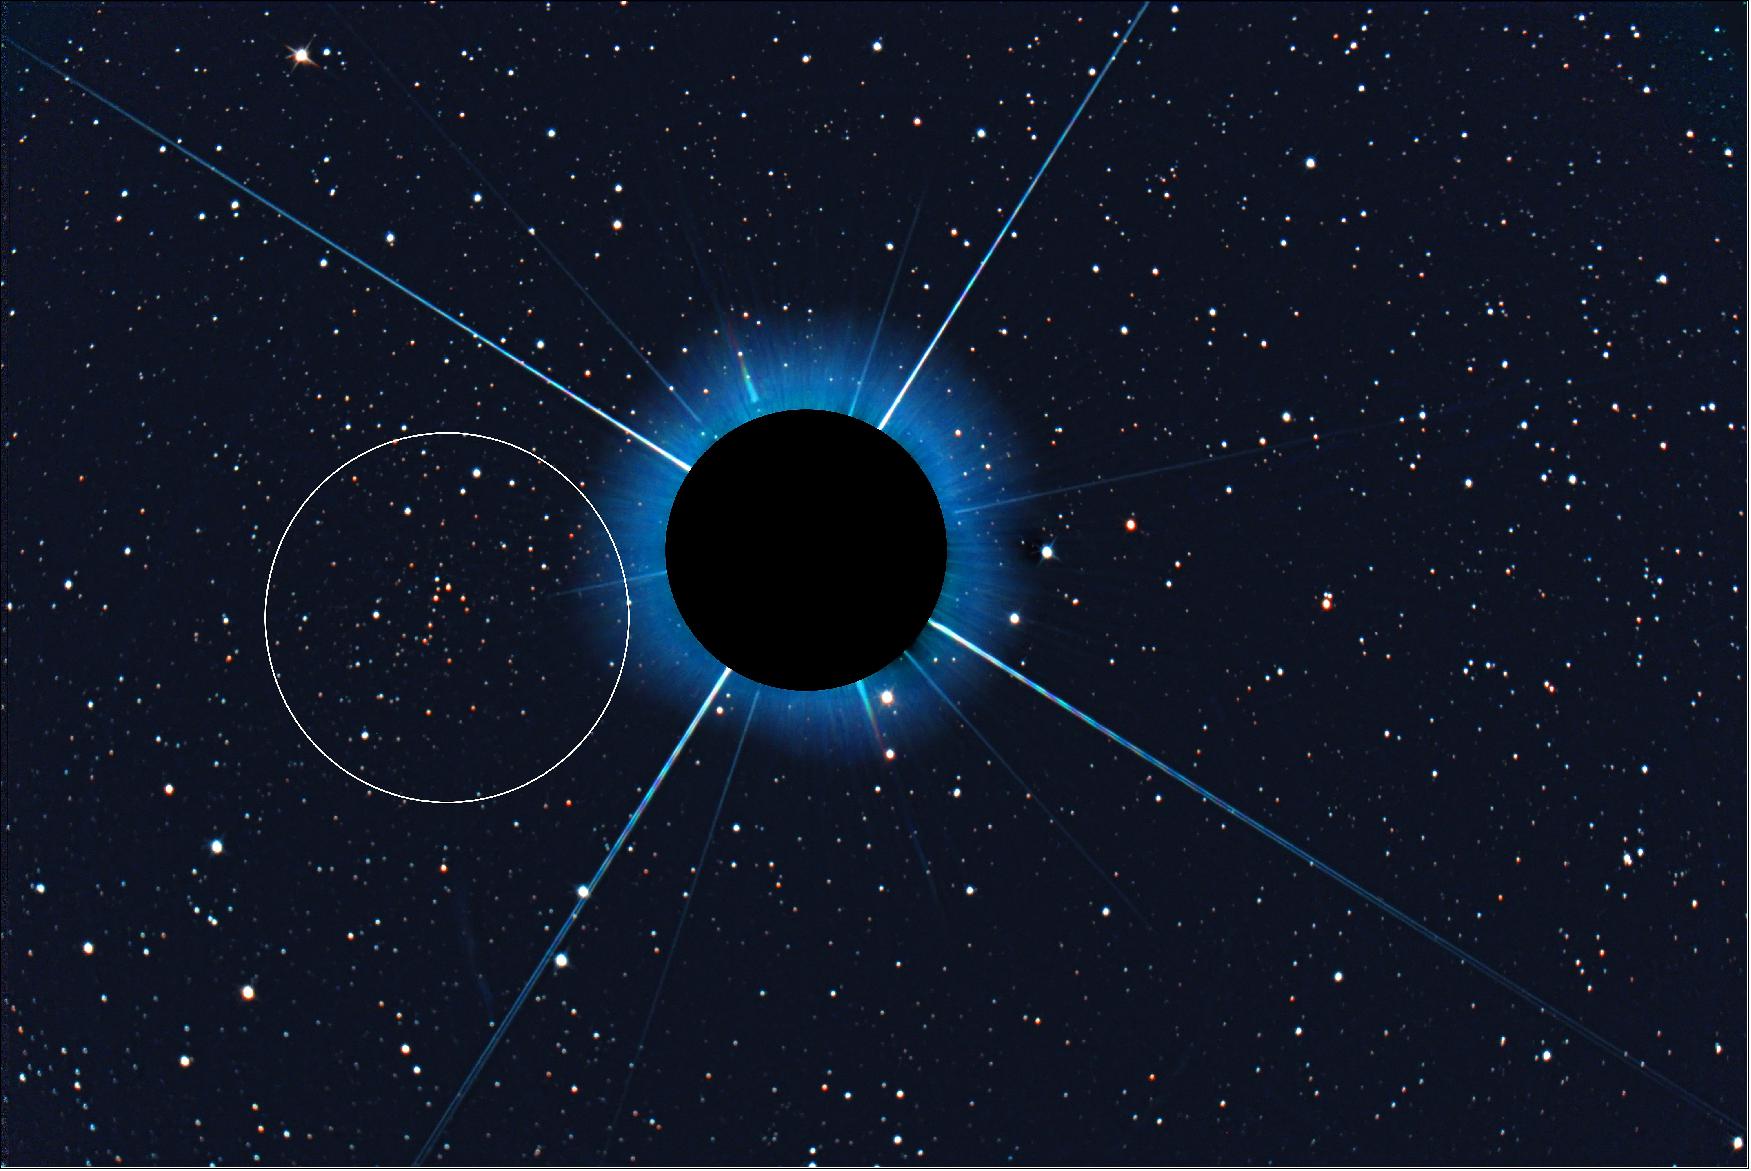
• January 25, 2018: Following the release of the first catalog in 2016, ESA's Gaia mission will publish its long-awaited map of more than 1 billion stars in our Galaxy on 25 April 2018. 54)
- Launched on 19 December 2013, and in routine science operations since 25 July 2014, Gaia has been mapping the positions and motions of stars at an accuracy level never before achieved, far below one thousandth of an arcsecond. Such an accuracy relies on the satellite's extraordinary equipment, long stretches of uninterrupted observations, and a collaboration of about 450 scientists and software experts who are entrusted with the complex task of analyzing and processing the data.
- The first release, which included the positions on the sky for 1 billion stars plus an estimate of the distance (parallax) and proper motion for a subset of 2 million bright stars, has already had a profound impact on the global astronomical community and generated hundreds of scientific publications.
- But it is the second release of Gaia data that astronomers across the world are eagerly looking forward to. - Based on 22 months of data collected between 25 July 2014 and 23 May 2016, it will contain the positions, parallaxes, and proper motions for more than 1.3 billion stars, as well as G magnitudes for all of them. It will also contain a measure of each star's color – the BP magnitude, recorded by the blue photometer, and the RP magnitude, recorded by the red photometer – for the vast majority of sources.
- And there is more: the second Gaia release will also include: radial velocities for more than six million stars; temperature estimates for about 150 million stars; the light curves of more than half a million variable stars, including Cepheids and RR Lyrae; and the positions of more than 13,000 objects in the Solar System – mostly asteroids – based on more than 1.5 million observations.
• January 17, 2018: ESA's Gaia observatory was launched in December 2013, and is now surveying our Milky Way, creating one of the most accurate-ever maps of the stars in our home galaxy and helping to answer questions about its origin and evolution. 55)
- The spacecraft is operated by teams at ESA's mission control in Darmstadt, Germany, who send commands, download data and status information and ensure the health and functioning of this marvelous explorer. They also plan and conduct the routine maneuvers needed to keep it in its orbital position, 1.5 million km from Earth at L2 in the Sun-Earth system.
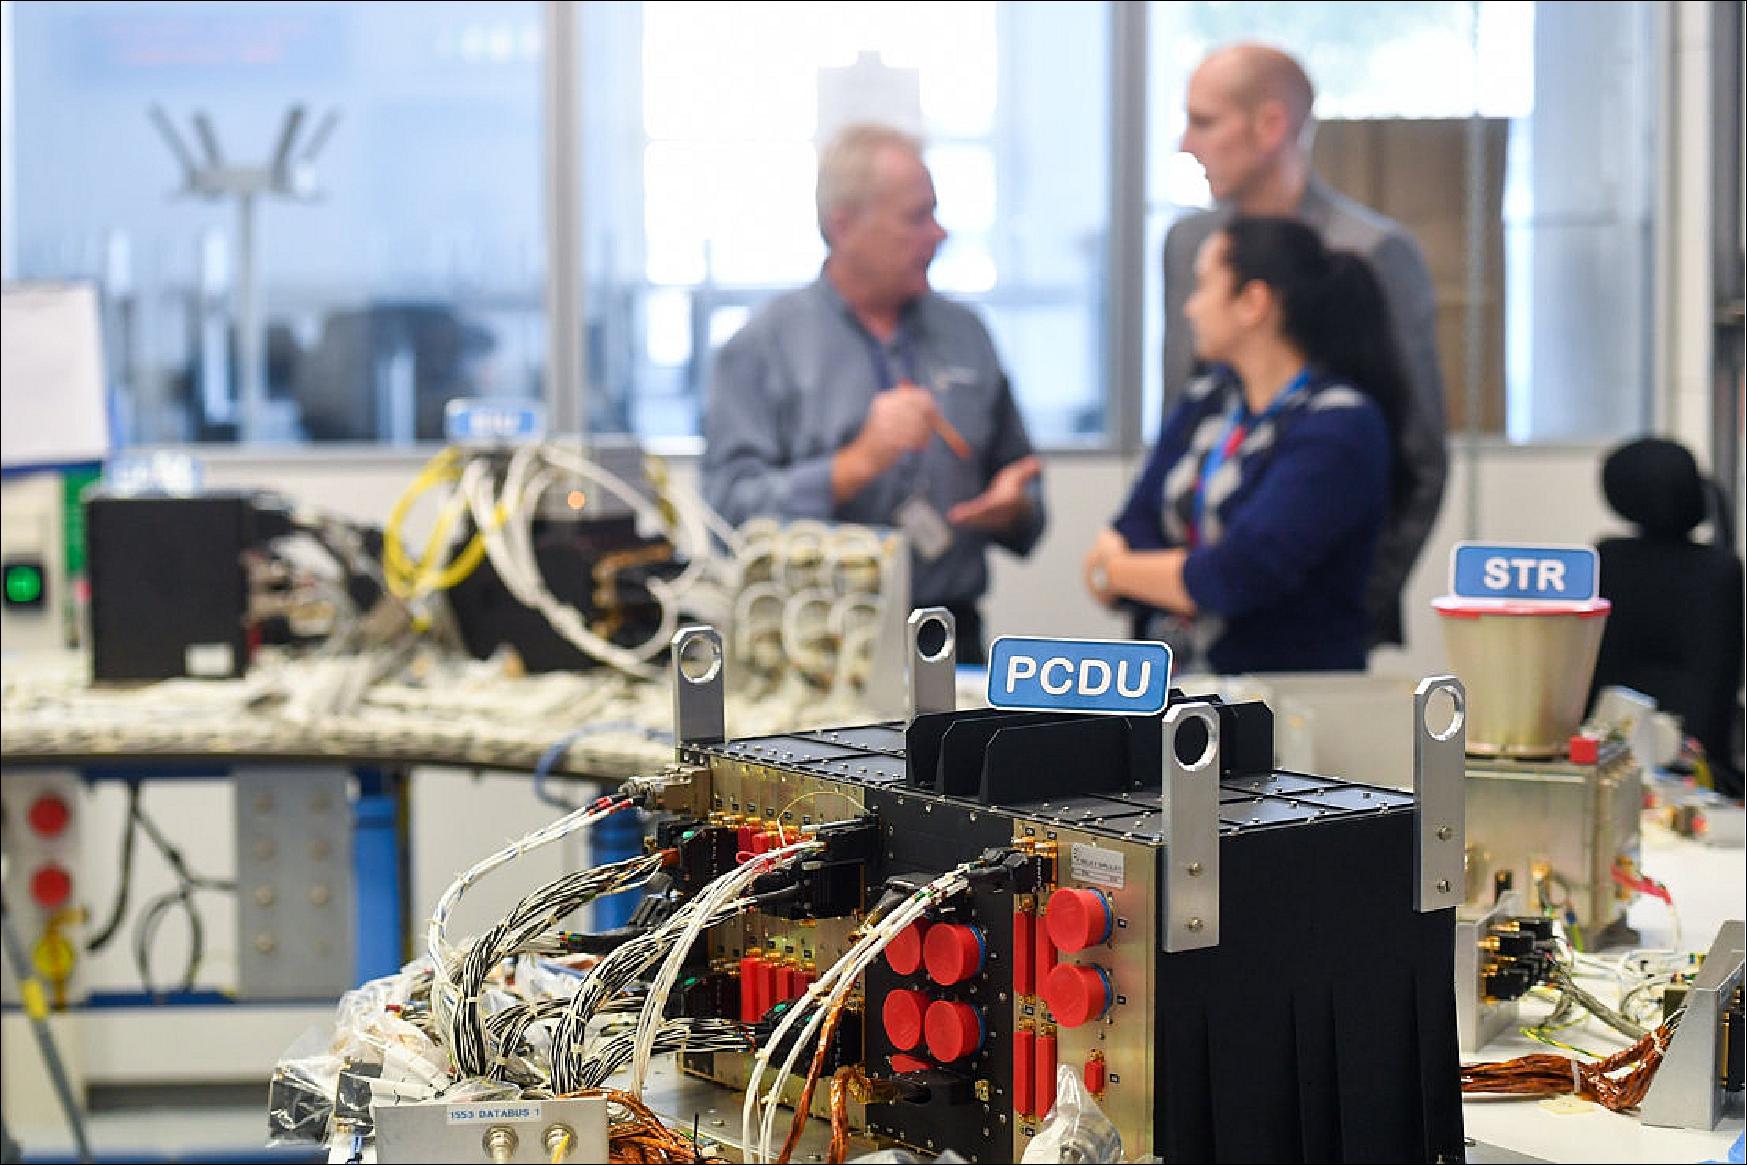
- Avionics are the devices, hardware and software on a spacecraft that enable it to be controlled from the ground, include propulsion, attitude control, communication, computers and navigation.
- "This model contains engineering copies of some of Gaia's onboard units," says spacecraft operations manager Dave Milligan. "It is used for high-fidelity simulations allowing our team to test procedures and software on the ground before they are executed on the real thing, 1.5 million km away. It is was recently used to test an automatic micropropulsion recovery process, now successfully used in flight."
• January 5, 2018: The Gaia spacecraft – which is busy creating the most detailed 3D map of the Milky Way – could also be instrumental when it comes to gravitational wave research. That's what a team of astronomers from the University of Cambridge recently claimed. According to their study, the Gaia satellite has the necessary sensitivity to study ultra-low frequency gravitational waves that are produced by supermassive black hole mergers. 56) 57) 58)
- GWs (Gravitational Waves) are generated by violent events, such as the collisions of black holes or neutron stars, objects whose extreme density strongly warps the surrounding spacetime. LIGO and Advanced Virgo detect a GW by the stretching and squeezing it produces, but a passing GW would also cause the Earth to oscillate in its location with respect to the stars. So distant stars, viewed from Earth or from an orbiting space telescope, would seem to temporarily shift position in a predictable way.
- Detection of GWs by observing extra-galactic objects, rather than stars, was suggested in the 1990s. 59) And large networks of astronomers are already gearing up to detect GWs via their effects on radio emissions from pulsars, for which the highly regular stream of fast pulses would be slightly shifted in frequency . Now astronomer Christopher Moore of the University of Cambridge in the UK and his co-workers have predicted the fingerprint that a GW would leave in the massive field of stars observed by ESA's Gaia space telescope. The observatory was launched in late 2013 to make high-precision observations of the positions of stars in our Galaxy.
- The data from Gaia will be released in the early 2020s. Then, says Moore, "Gaia will make measuring this effect a realistic prospect for the first time." While Gaia was being designed, researchers recognized that GW detection would be one potential use of the instrument. 60) Many factors contribute to the feasibility of the approach, including the precision and long duration of the astrometric measurements. Gaia will observe about a billion stars over 5–10 years, locating each one of them at least 80 times during that period. Observing so many stars is the major advance provided by Gaia, says Moore.
- To this end, Moore and his colleagues simulated gravitational waves produced by a binary SMBH (SuperMassive Black Hole) – i.e. two SMBHs orbiting one another. What they found was that by compressing the data sets by a factor of more than 106 (measuring 100,000 stars instead of a billion at a time), GWs could be recovered from Gaia data with an only 1% loss of sensitivity.
- This method would be similar to that used in Pulsar Timing Arrays, where a set of millisecond pulsars are examined to determine if gravitational waves modify the frequency of their pulses. However, in this case, stars are being monitored to see if they are oscillating with a characteristic pattern, rather than pulsing. By looking at a field of 100,000 stars at a time, researchers would be able to detect induced apparent motions (Figure 54).
- Success is not guaranteed, however. "It could be that all the waves at these ultralow frequencies are too weak even for Gaia to detect," says Moore. He says that the most likely source of GWs visible in the Gaia data will be a pair of supermassive black holes bound in a tight orbit with a period of roughly a year and located in the center of some large, relatively nearby galaxy. Such objects could have between 10 million and 100 million times the Sun's mass.
- "This is a nifty idea and is worth an effort," says astrophysicist Carl Gwinn of the University of California at Santa Barbara, although he says that it will be challenging to eliminate conflicting signals from instrumental effects such as fluctuations in the spacecraft orientation.
- Jos de Bruijne, deputy project scientist for the Gaia mission at ESA, confirms that the proposals and results of simulations are consistent with the capabilities of the instrument. According to Gwinn, a space-based instrument is required to see such effects, as refraction in the Earth's atmosphere would prevent observation by ground-based telescopes.
- De Bruijne says the approach might reveal GW sources not easily visible to interferometric detectors like LIGO, including primordial GWs produced in the inflationary epoch of the big bang. Gwinn adds that Gaia should also be able to see GWs emitted when stars from a host galaxy merge with the central supermassive black hole, which should be a fairly common occurrence.
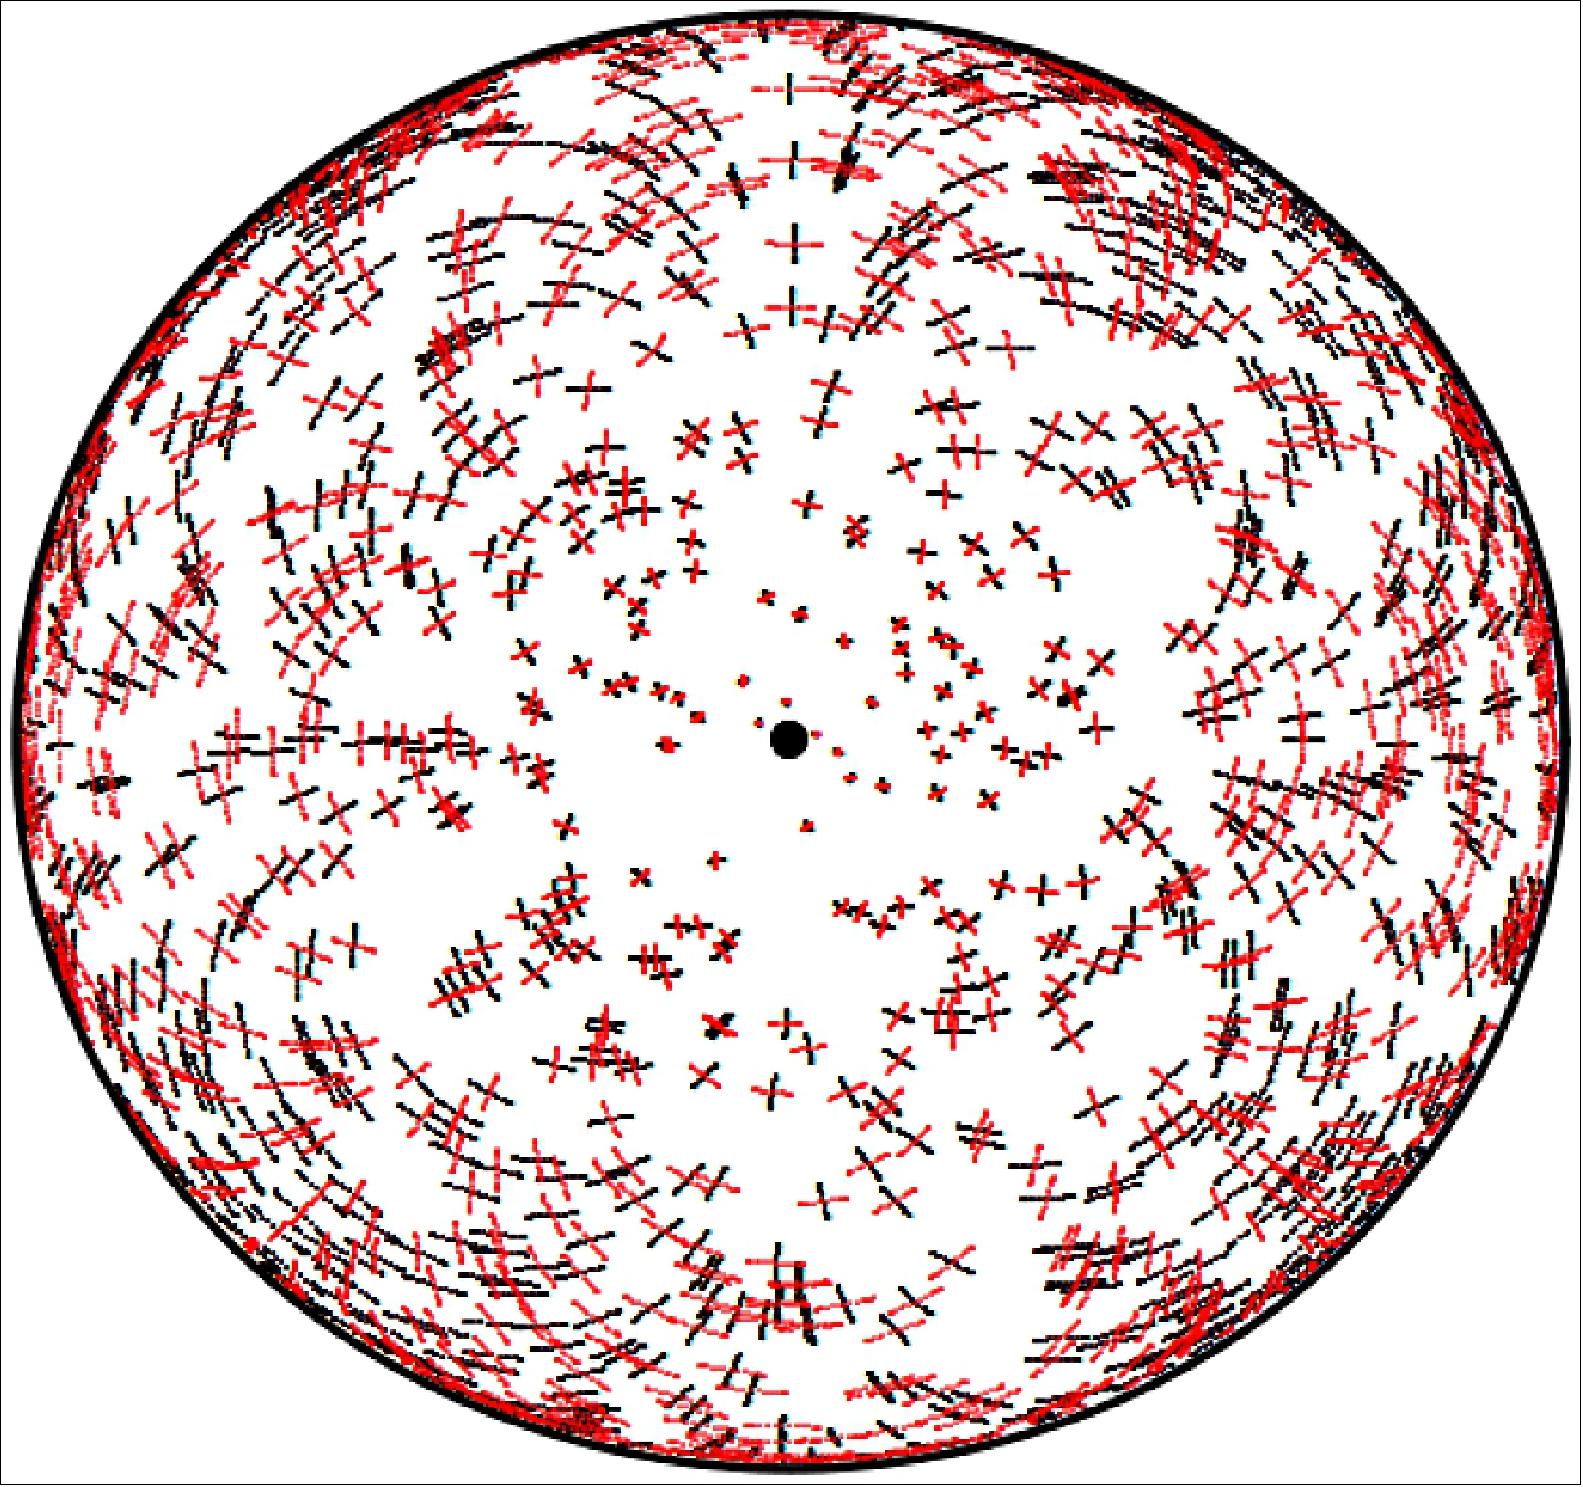
• December 20, 2017: Four years ago, on 19 December 2013, Gaia was launched from Europe's Spaceport in Kourou, French Guiana. The mission's operations teams led by Spacecraft Operations Manager David Milligan (Figure 55), followed the event from the control room in Darmstadt, Germany. 61)
- Measuring stellar positions and motions to the required accuracy is not easy, requiring extreme precision in the stability of the spacecraft, detailed knowledge of its position and unprecedented accuracy in timing.
- This marvel of technology has executed over 1.6 million commands, completed 29 maneuvers, performed some 1108 billion total measurements, made more than 3100 ground-station contacts and accumulated 47.5 TB of science data.

• December 18, 2017: This colorful streamer is created from real data that represents the viewing direction of ESA's Gaia satellite as it scans across the sky (Figure 56). 62)
- Gaia's mission is to make the largest, most precise 3D map of our Galaxy by surveying more than a thousand million stars. This goal relies on the systematic and repeating observation of star positions in two fields of view to detect any changes in an object's motion through space. As such, Gaia is rotating slowly, sweeping its two telescopes, which are separated by 106.5º, across the entire celestial sphere to make four complete rotations per day.
- At the same time, its spin axis changes orientation around the Sun with a period of about 63 days, allowing different parts of the sky to be scanned. This approach builds up an interlocking grid of stellar positions and motions.
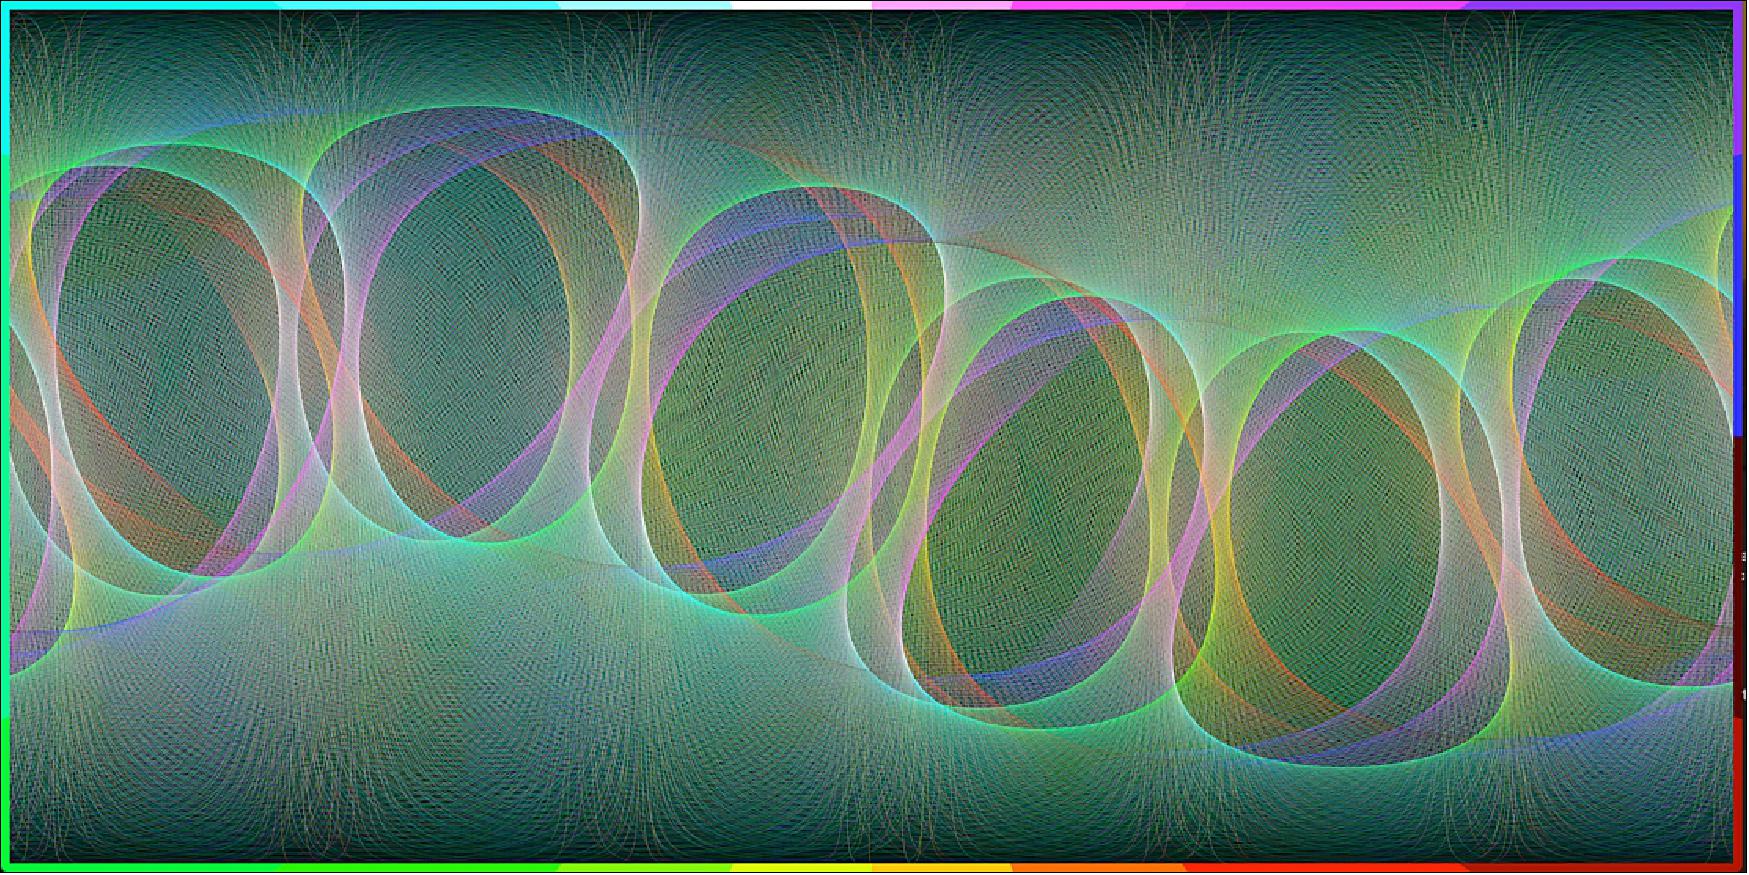
- Gaia's attitude is plotted every second with two dots: one to represent each of the two telescopes at that moment in time. The positions are plotted in celestial coordinates: right ascension (horizontal axis) and declination (vertical axis), which can be imagined as lines of longitude and latitude printed on the inside of the celestial sphere.
- The colors indicate the direction of the scan, the key for which is indicated in the border of the image. The direction of the scan with respect to north (up) can be found by starting in the center of the image and moving towards the border to the appropriate color. Each color around the border covers a range of 18º.
- Zooming in reveals first a cross weave-like pattern, and ultimately the individual dots. The highest density of overlapping pattern represents the areas of sky that have been scanned multiple times in different directions already, while the lower density regions were scanned fewer times and in fewer different directions. Eventually the gaps will close, as Gaia makes more and more repeated scans of the sky.
- Gaia was launched on 19 December 2013 and began routine operations in July 2014. The first catalogue of more than a billion stars, based on the first 14 months of scanning, was published in September 2016. The image shown here was created from Gaia's movements between 1 October 2014 and 31 May 2016. This corresponds to the period that includes the second data release, which is scheduled for April 2018.
• December 13, 2017: Measuring the positions and motions of more than a billion stars, ESA's Gaia mission will refine our knowledge about our place in the Universe, providing the best ever star chart of our Milky Way and its neighboring galaxies. 63)
- One of the nearest galaxies to our Galaxy is the LMC (Large Magellanic Cloud), located around 166,000 light-years away and visible to the naked eye at intermediate and southern latitudes.
- With a mass roughly equivalent to ten billion times the mass of our Sun – about one tenth of the Milky Way – the LMC is home to an intense star-forming activity, forming stars five time faster than in our Galaxy. Different aspects of the galaxy's stellar population are depicted in these two images, based on data collected by the Gaia satellite during its first 14 months of operations.
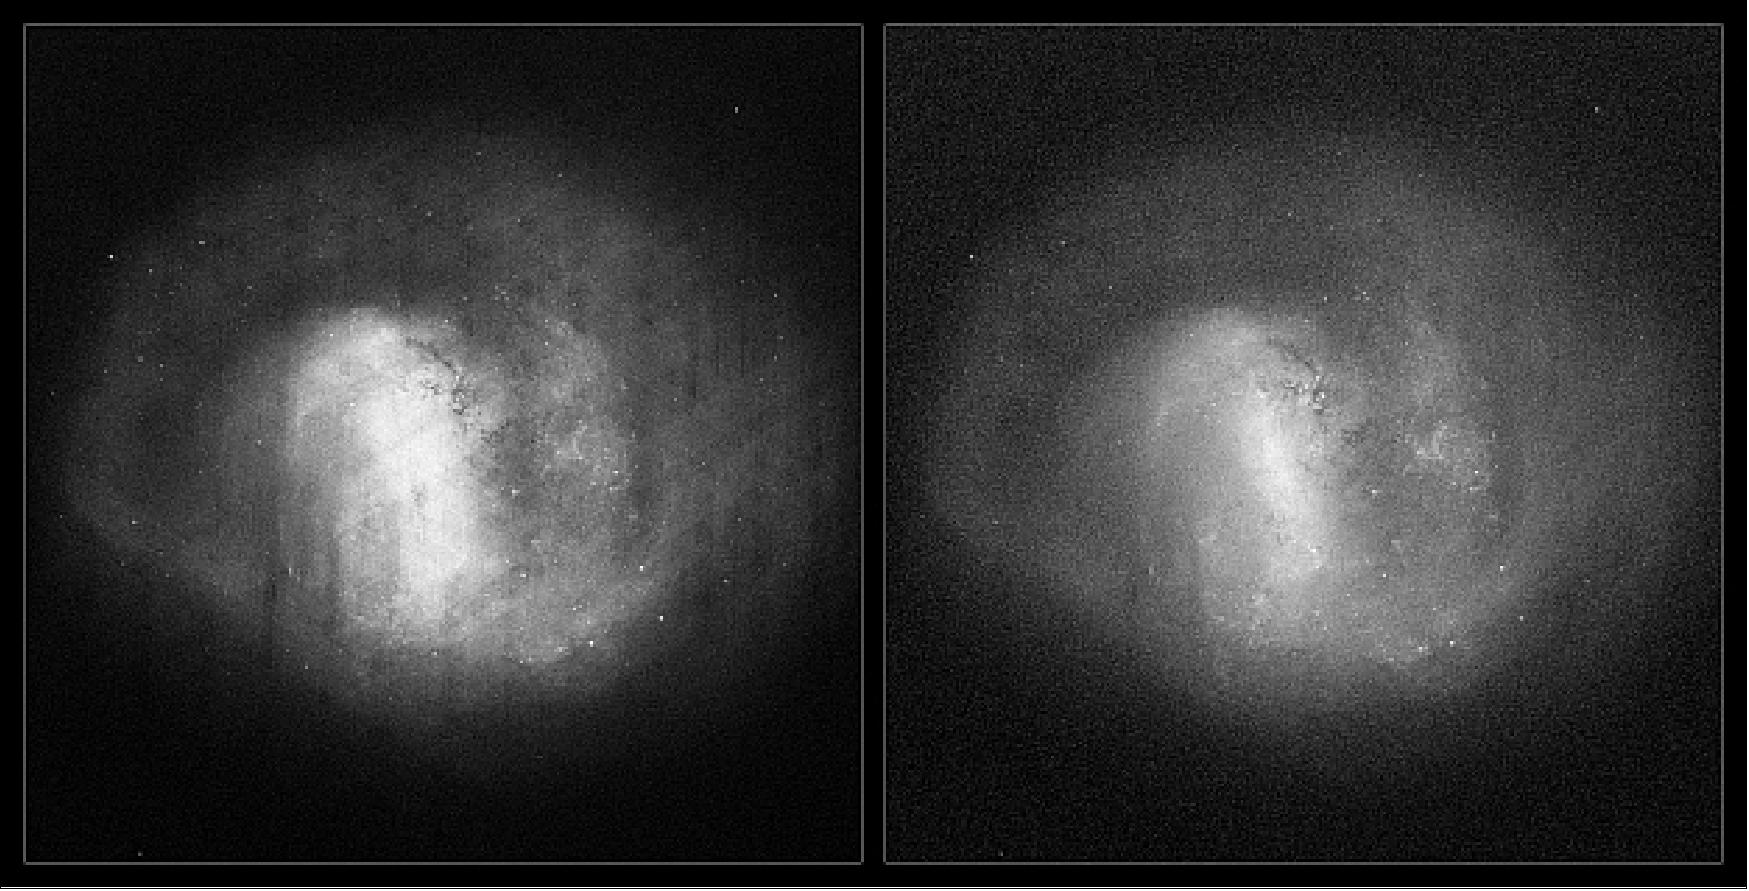
- The view on the left, compiled by mapping the total density of stars detected by Gaia in each pixel of the image, shows the large-scale distribution of stars in the LMC, delineating the extent of the spiral arms. The image is peppered with bright dots – these are faint clusters of stars. A series of diagonal stripes, visible along the central thick structure, or bar, are an artefact caused by Gaia's scanning procedure. These will gradually decrease as more data are gathered throughout the lifetime of the mission.
- On the right, a different image provides a complementary view that reveals other aspects of this galaxy and its stars. Created by mapping the total amount of radiation, or flux, recorded per pixel by Gaia, this image is dominated by the brightest, most massive stars, which greatly outshine their fainter, lower-mass counterparts. In this view, the bar of the LMC is more clearly delineated, alongside individual regions of star formation like the sparkling 30 Doradus, visible just above the center of the galaxy.
- The images of Figure 58, also obtained using data from the first 14 months of Gaia science operations, depict two nearby spiral galaxies: Andromeda (also known as M31), which is slightly more massive than the Milky Way and, at roughly 2.5 million light-years away, the largest galaxy in our vicinity; and its neighbor, the Triangulum galaxy (also known as M33, Figure 59) home to some fifty billion stars and located about 2.8 million light-years away.
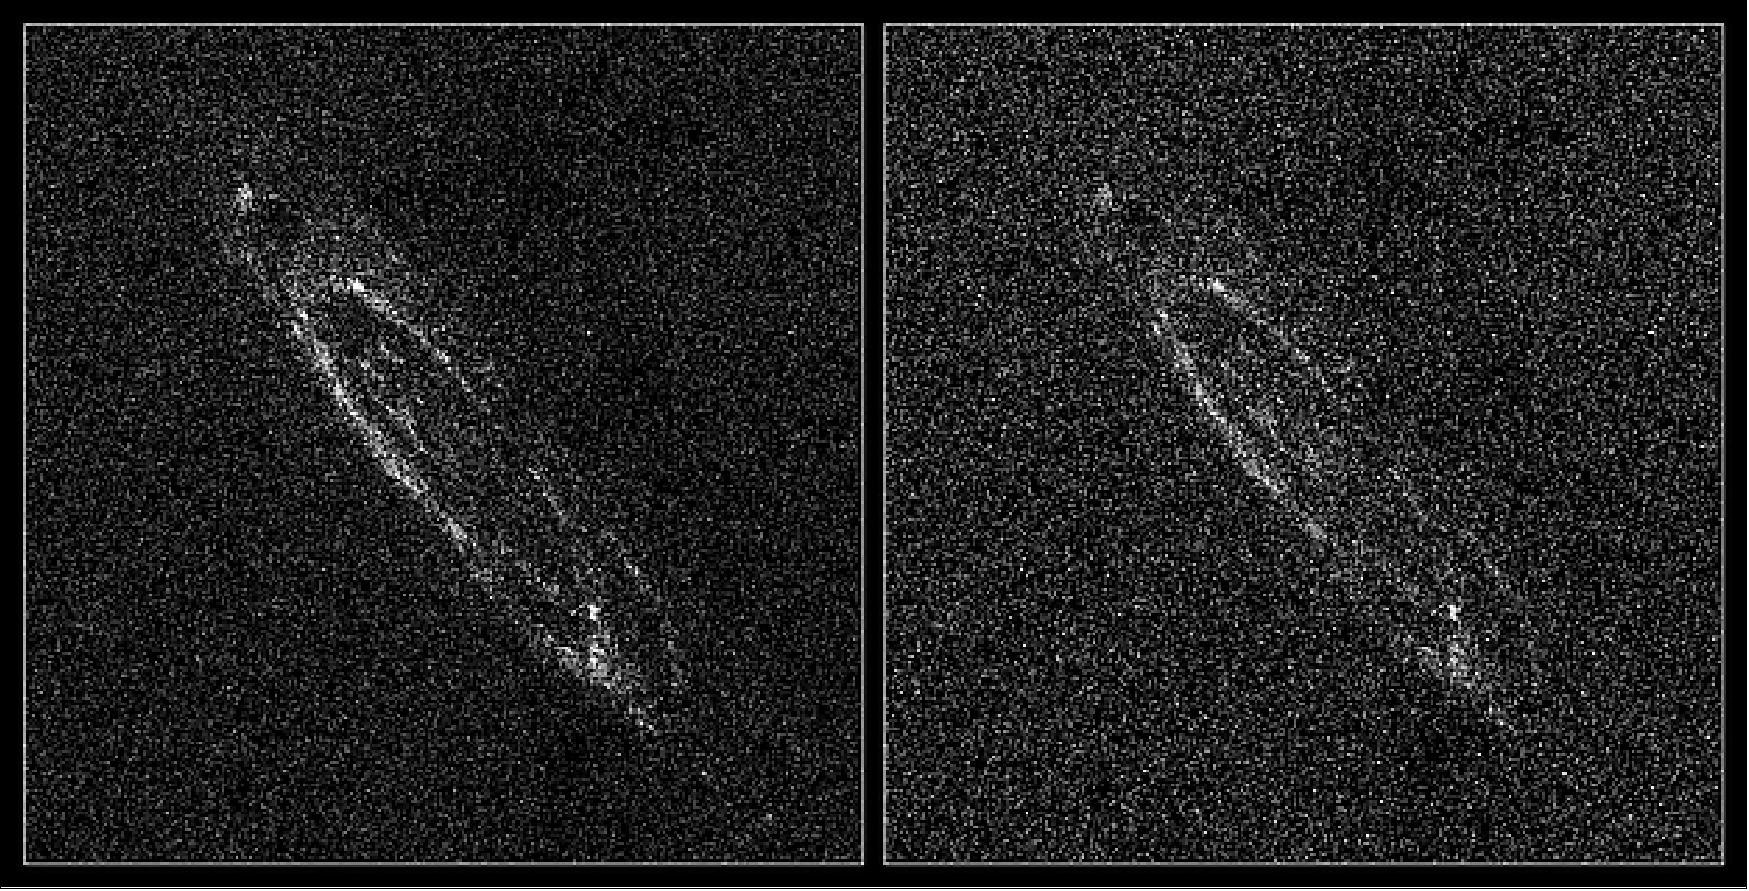
- On the left of Figure 58, the image based on the stellar density shows where stars of all types are located within the galaxy. - On the right, the image based on the total flux mainly depicts the bright end of the stellar population of the galaxy, tracing out the regions of most intense star formation.
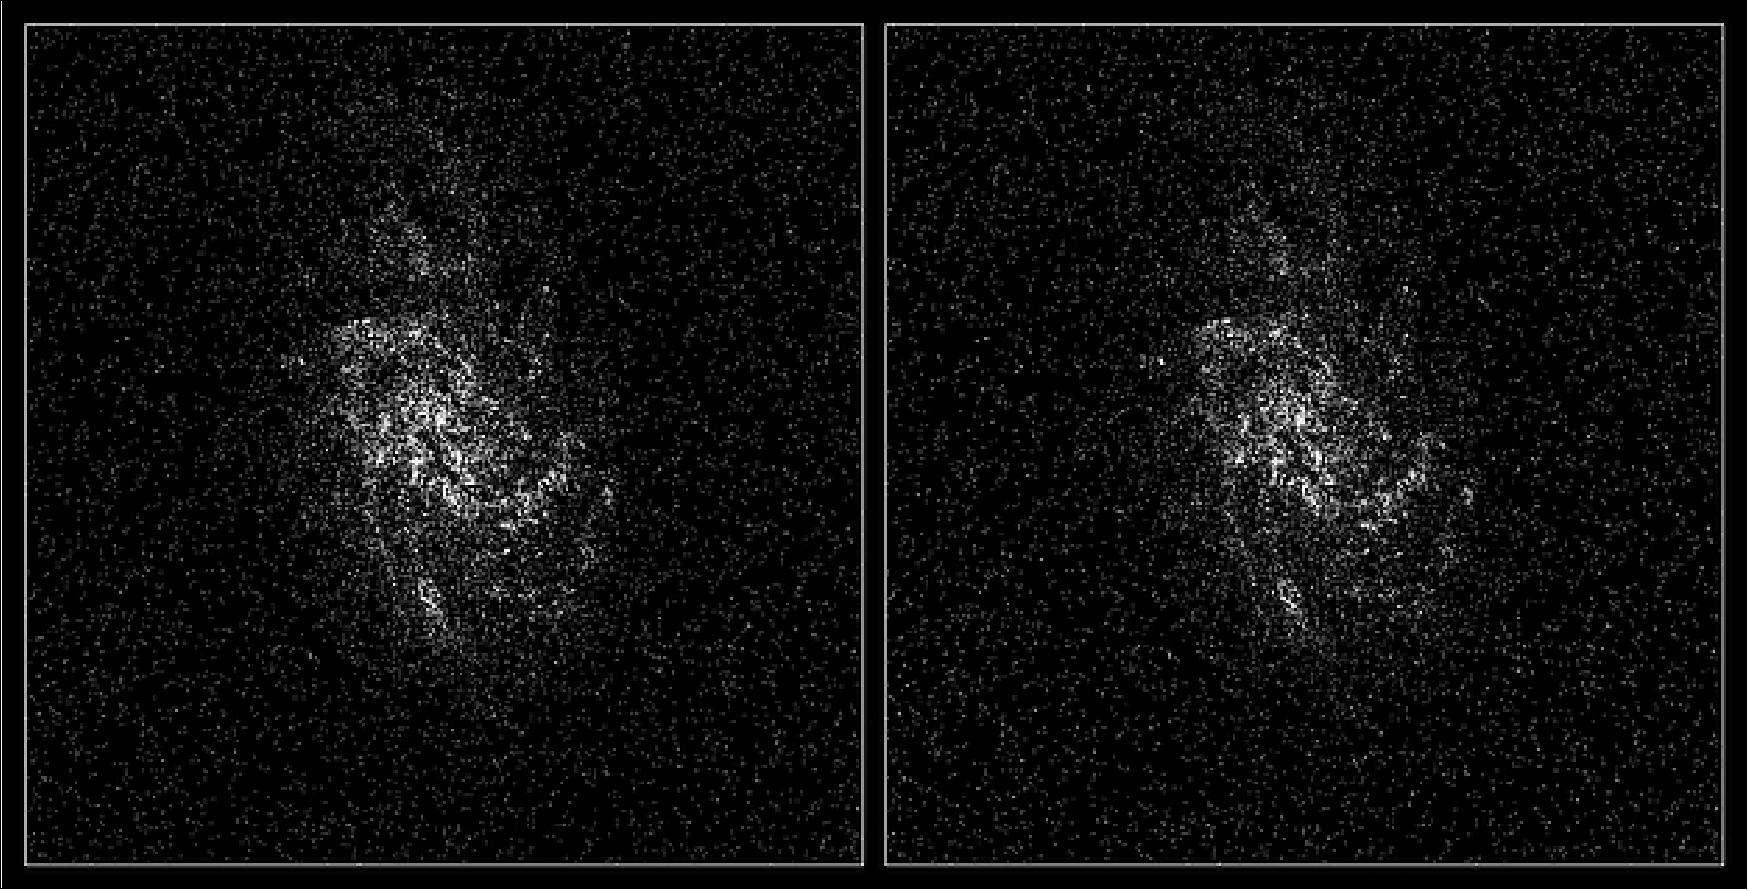
- For all these stars and more, the second release of Gaia data – planned for April 2018 – will also contain measurements of their parallax, which quantifies a star's distance from us, and of their motion across the sky. Astronomers are eagerly awaiting this unprecedented data set to delve into the present and past mysteries of our Galaxy and its neighbors.
- By analyzing the motions of individual stars in external galaxies like the LMC, Andromeda, or Triangulum, it will be possible to learn more about the overall rotation of stars within these galaxies, as well as the orbit of the galaxies themselves in the swarm they are part of, known as the Local Group.
- In the case of the LMC, a team of astronomers have already attempted to do so by using a subset of data from the first Gaia release, the TGAS (Tycho–Gaia Astrometric Solution), for which parallaxes and proper motions had also been provided by combining the new data with those from ESA's first astrometry mission, Hipparcos. In the TGAS data set, consisting of two million stars, they identified 29 stars in the LMC with good measurements of proper motions and used them to estimate the rotation of the galaxy, providing a taster of the studies that will become possible with future releases of Gaia data.
- Observations of the LMC and its neighbor, the SMC (Small Magellanic Cloud), with Gaia are extremely important also for studying variable stars like Cepheids and RR Lyrae. These stars can be used as indicators of cosmic distances in galaxies beyond our own as long as they are first calibrated in a 'local' laboratory, such as the LMC and SMC, where it is possible to obtain a more direct estimate of their distance using parallax determined with Gaia.
- Astronomers in the Gaia Data Processing and Analysis Consortium, or DPAC, tested this method on hundreds of LMC variable stars from the TGAS sample as part of the validation of the data from the first release. Their results, which are promising even though preliminary, are an exciting example of the rich scientific harvest that will be possible with future releases of the data that are being gathered by Gaia.
• December 7, 2017: ESA's SPC (Science Program Committee) has approved indicative extensions, up to 2019-2020, for the operation of eight scientific missions. 64)
- During its meeting at ESA Headquarters in Paris, on 21-22 November, the SPC approved indicative extensions for the continued operation of five ESA-led missions: Gaia, INTEGRAL, Mars Express, SOHO, and XMM-Newton. This followed a comprehensive review of the current operational status and outlook of the missions and their expected scientific returns during the extension period. The decision will be subject to confirmation towards the end of 2018.
- The lifetime of Gaia, ESA's billion star surveyor, was extended by eighteen months, from 25 July 2019 to 31 December 2020. This is the first time that Gaia, which was launched in 2013 and originally funded for a five-year mission, has been subject to the extension process. — Mars Express, SOHO, and XMM-Newton each received extensions of two years, so their operations will continue at least until the end of 2020.
- The SPC extended the operations of the high-energy observatory INTEGRAL by one year, until 31 December 2019. A proposal to extend INTEGRAL until the end of 2020, as well as a proposal concerning a two-year extension of the magnetospheric plasma mission, Cluster, will be presented to the next meeting of the SPC in February 2018.
- The go-ahead was also given to continue ESA's contributions to the operations of three international collaborative missions: the HST (Hubble Space Telescope), and IRIS (Interface Region Imaging Spectrograph), which are both led by NASA, as well as the Japanese-led mission Hinode.
- Every two years, all missions whose approved operations end within the following four years are subject to review by the advisory structure of the Science Directorate. Extensions are granted to missions that satisfy the established criteria for operational status and science return, subject to the level of financial resources available in the science program. These extensions are valid for the following four years, subject to a mid-term review and confirmation after two years. Extensions for operations in the period 2017-2018 were approved by the SPC in November 2016, but the indicative extension, for 2019-2020, had been deferred until the November 2017 meeting to allow the SPC to evaluate the outcome of the ESA Ministerial Council meeting in December 2016.
• November 27, 2017: By pinning down, for the first time, the three-dimensional motions of individual stars in the nearby Sculptor dwarf galaxy, astronomers have shed new light on the distribution of invisible dark matter that pervades the galaxy. This study combined the positions of stars measured by ESA's Gaia mission with observations from the NASA/ESA Hubble Space Telescope taken twelve years earlier. 65)
- Our Milky Way galaxy, home to hundreds of billions of stars, is orbited by more than a dozen smaller satellite galaxies. The best known in this swarm, the Large and Small Magellanic Clouds, are visible with the naked eye from middle and southern latitudes, while the others are much fainter and can only be observed with the aid of telescopes.
- These satellite galaxies are classed as dwarfs, since they contain only a small fraction of the stars hosted in regular galaxies. They are all engaged in gravitational interactions with the Milky Way, and these dynamical processes might leave telltale traces in their shape.
- These satellite galaxies are classed as dwarfs, since they contain only a small fraction of the stars hosted in regular galaxies. They are all engaged in gravitational interactions with the Milky Way, and these dynamical processes might leave telltale traces in their shape.
- A new study has now brought one of these galaxies, the dwarf Sculptor, into unprecedented focus.
- "For the first time, we've been able to determine how individual stars are moving through a dwarf satellite of our Milky Way," says Davide Massari from the Kapteyn Astronomical Institute in Groningen, The Netherlands, who is lead author of the paper published today in Nature Astronomy. 66) 67)
- "This was possible by combining the exceptionally accurate measurements of stellar positions from Gaia's first data release with equally outstanding observations taken over twelve years earlier by the Hubble Space Telescope."
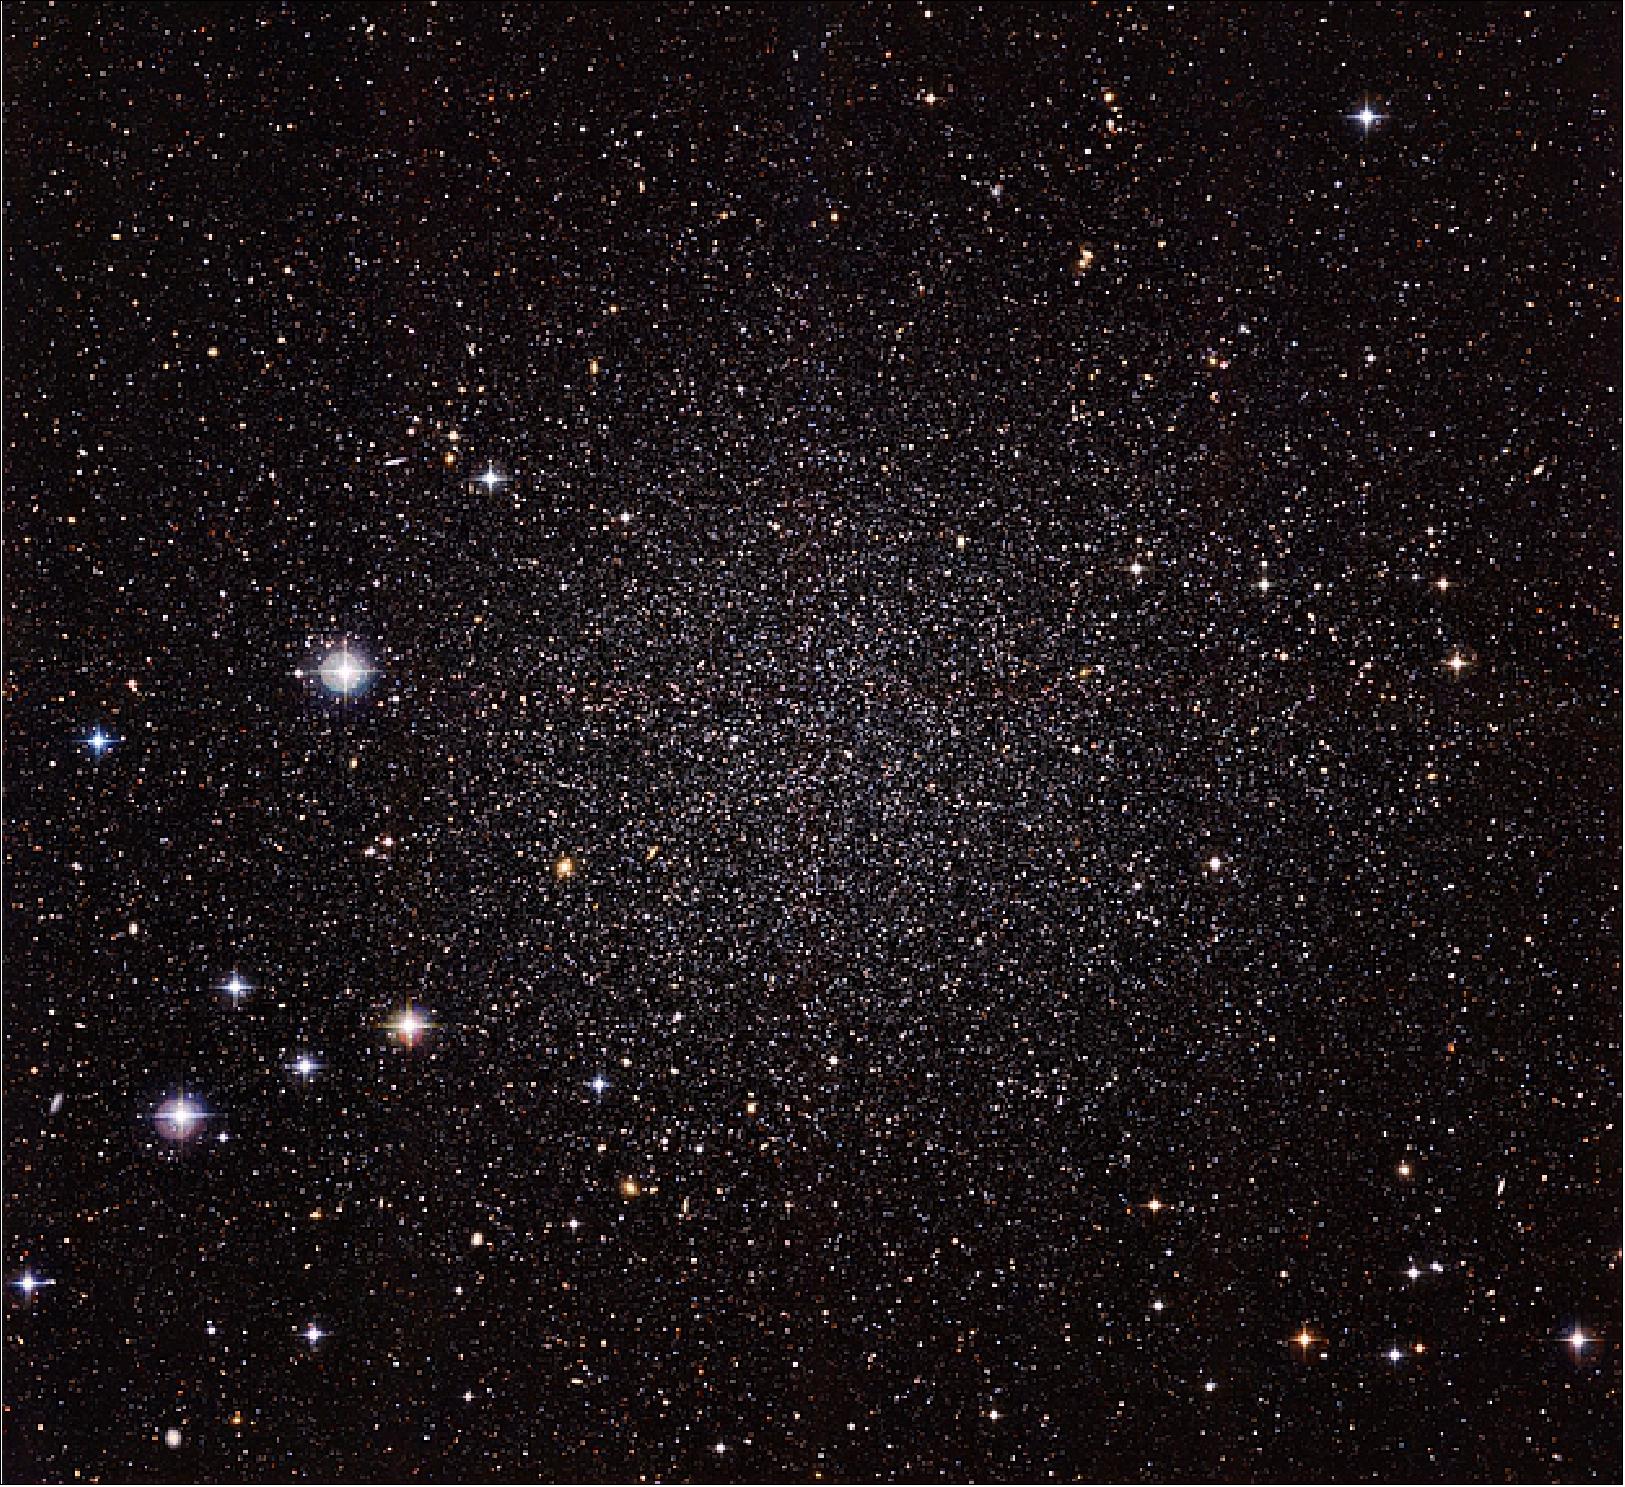
Legend to Figure 60: Located around 300,000 light years away, it was the first dwarf galaxy to be discovered around the Milky Way by astronomer Harlow Shapley in 1937. - Astronomers have been looking at stars in dwarf galaxies for decades, striving to reconstruct their origin and to uncover the past history of our Galaxy and its environment.
Based on the combination of data taken twelve years apart by ESA's Gaia mission and the NASA/ESA Hubble Space Telescope, a team of astronomers have pinned down for the first time the three-dimensional motions of individual stars in the Sculptor dwarf galaxy, shedding new light on the underlying distribution of invisible dark matter that pervades the galaxy.
- As expected, the shifts in the star positions as observed on the plane of the sky – called proper motions – are tiny, even over the long time baseline between 2002, when the Hubble observations were performed, and the first set of publicly released Gaia data, gathered between 2014 and 2015.
- "We couldn't wait to see whether the Gaia observations could be used to measure individual proper motions in another galaxy, so we were thrilled to see this was indeed possible," says Amina Helmi, a co-author of the study, also based at Kapteyn Astronomical Institute in Groningen.
- Massari, Helmi and colleagues measured the proper motions of roughly a hundred stars in the Sculptor dwarf galaxy. For a smaller subset of ten stars, chosen among those with the smallest errors, the astronomers could also retrieve from the literature an estimate of the radial velocity, which quantifies the stellar motion along the line of sight.
- Using the proper motion and radial velocity measurements, they were able to reconstruct how these stars move in three dimensions – the first time this was done for a dwarf galaxy.
- Last week, ESA approved an extension of Gaia operations for an additional 18 months, so it will keep scanning the sky until at least 2020. One of the key science drivers for the extension was the study of proper motions of stars in dwarf galaxies, which requires observations taken over as long a time baseline as possible.
- "With Gaia, we are looking at our Galaxy and its neighbors 'in action', delving into the motions of stars, and unveiling their secrets," says Timo Prusti, Gaia project scientist at ESA. "This study provides us with an amazing preview of the exciting science that can be done with the full Gaia catalog."
• November 15, 2017: It's the perfect meeting of old and new. Astronomers have combined the latest data from ESA's Gaia mission with a simple analysis technique from the 18th century to discover a massive star cluster that had previously escaped detection. Now, subsequent investigations are helping reveal the star-forming history of our Galaxy, the Milky Way. 68)
- In the latter years of the 18th century, astronomers William and Caroline Herschel began to count stars. William called the technique "star gaging" and his aim was to determine the shape of our Galaxy.
- Ever since 1609, when Galileo lifted his telescope to the misty patch of light known as the Milky Way and saw that it was composed of myriad faint stars whose light all blurred together, we have known that there are different numbers of stars in different directions throughout space. This means that our local collection of stars, the Galaxy, must have a shape to it. Herschel set out to find out what that shape was.
- He used a large telescope, 6.10 m in length, mounted between tall wooden frames to sweep out a large circle in the sky that passed through the Milky Way at right angles. He then split this circle into more than 600 regions and counted or estimated the number of stars in each.
- With this simple technique the Herschels produced the first shape estimate for the Galaxy. Fast-forward to the 21st century and now researchers use star counts to search for hidden star clusters and satellite galaxies. They look for regions where the density of stars rises higher than expected. These patches are called stellar over-densities.
- Back in 1785, Herschel's circular track passed close to the brightest star in the night sky Sirius. Now, scientists mining the first data released from the ESA spacecraft Gaia have revisited that particular area of the sky and made a remarkable discovery.
- They have revealed a large star cluster that could have been discovered more than a century and a half ago had it not been so close to Sirius.
- The cluster was spotted by Sergey E. Koposov, then at the University of Cambridge (UK) and now at Carnegie Mellon University in Pittsburgh, PA, USA, and his colleagues. They have been looking for star clusters and satellite galaxies in various surveys for the past decade. It was natural for them to do this with the Gaia mission's first data release.
- Gaia is the European Space Agency's astrometric mission. Collecting positions, brightnesses and additional information for more than a billion sources of light, its data allows nothing less than the most precise 'star gaging' ever.
- These days the laborious task of counting the stars is done by computers but the results still have to be scrutinized by humans. Koposov was combing the list of over-densities when he saw the massive cluster. At first it seemed too good to be true.
- "I thought it must be an artefact related to Sirius," he says. Bright stars can create false signals, termed artefacts, that astronomers must be careful not to mistake for stars. An early paper from the Gaia team had even discussed artefacts around Sirius using a nearby patch of sky to the one Koposov was looking at.
- Although he moved on and found another over-density that looked promising, his mind kept wanting to return to the first one. "I thought, 'That's strange, we shouldn't have that many artefacts from Sirius.' So I went and looked at it again. And I realized that it too was a genuine object," he says.
- These two objects were named: Gaia 1 for the object located near Sirius, and Gaia 2, which is close to the plane of our Galaxy, and both were duly published. 69) Gaia 1 in particular contains enough mass to make a few thousand stars like the Sun, is located 15 thousand light years away, and spread across 30 light years. This means it is a massive star cluster.
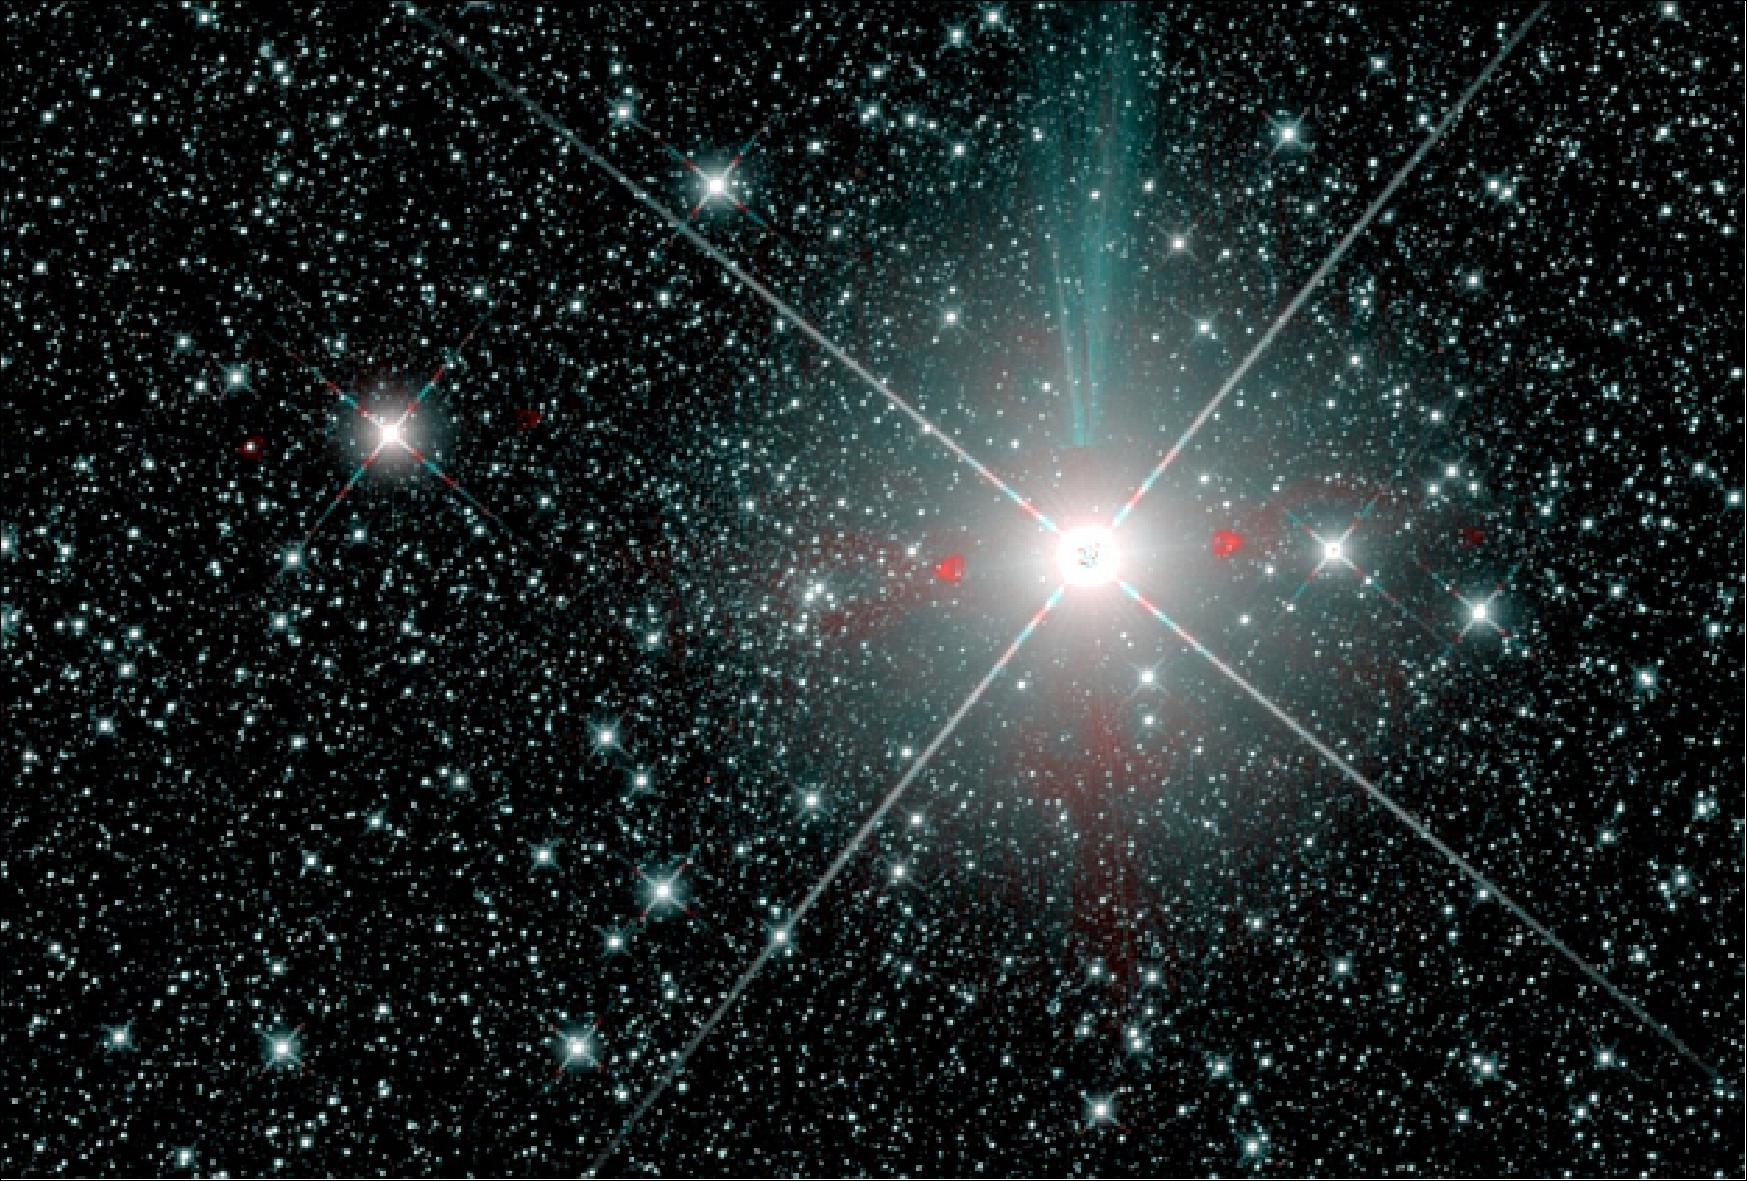
- Collections of stars like Gaia 1 are called open clusters. They are families of stars that all form together and then gradually disperse around the Galaxy. Our own Sun very likely formed in an open cluster. Such assemblies can tell us about the star formation history of our Galaxy. Finding a new one that can be easily studied is already paying dividends.
- "The age is of great interest," says Jeffrey Simpson, Australian Astronomical Observatory, who conducted follow-up observations with colleagues using the 4 m-class Anglo-Australian telescope at Siding Springs Observatory, Australia.
- Identifying 41 members of the cluster, Simpson and colleagues found that Gaia 1 is unusual in at least two ways. Firstly, it is about 3 billion years old. This is odd because there are not many clusters with this age in the Milky Way.
- Typically clusters are either younger than a few hundred million years – these are the open clusters – or older than 10 billion years – these are a distinct class called globular clusters, which are found beyond the main bulk of stars in our Galaxy. Being of intermediate age, Gaia 1 might represent an important bridge in our understanding between the two populations.
- Secondly, its orbit through the galaxy is unusual. Most open clusters lie close to the plane of the Galaxy but Simpson found that Gaia 1 flies high above it before ducking down and passing underneath. "It might go as much as a kiloparsec (more than 3000 light years) above and below the plane," he says. About 90% of clusters never go more than a third of this distance.
- Simulations of clusters with orbits like Gaia 1 find that they are stripped of stars and dispersed by these high velocity 'plane passages'. That puts it at odds with the age estimate.
- "Our finding that Gaia 1 is three billion years old is curious as the models would have it not surviving anywhere near as long. More research is required to try and reconcile this," says Simpson.
- The next Gaia data release will give accurate proper motions and distances to an unprecedented number of stars, which can be used to more efficiently find star clusters that were buried too deep in the stellar field or were too diffuse or too distant to be seen before.
- For the astronomers ready to explore the Gaia data, the adventure has only just begun. Gaia's second data release is scheduled for April 2018. Subsequent data releases are scheduled for 2020 and 2022.
• October 26, 2017: ESA's Gaia mission, in orbit since December 2013, is surveying more than a thousand million stars in our Galaxy, monitoring each target star about 70 times over a five-year period and precisely charting their positions, distances, movements and brightness. 70)
- Although Gaia is not equipped with a dedicated radiation monitor, it can provide information about the space weather – and the solar particles and radiation – that it encounters at its unique orbital position at L2 (Lagrangian Point 2), about 1.5 million km from Earth.
- In September, Gaia unexpectedly detected a large quantity of protons – subatomic particles – emitted by a solar flare as shown in Figure 63.
- This proton storm was also reported by NOAA's GOES weather satellite, which is equipped with a particle-sensing instrument.
- The solar flare that gave rise to these protons took place on 10 September 2017, and the peak flow of protons streaming past Gaia occurred at about midnight on 11 September.
- "Gaia is designed to withstand these space weather storms and it was able to continue as normal throughout the period of increased radiation," says spacecraft operations engineer Ed Serpell. "During the days of the increased radiation, the amount of ground contact with the ESA deep-space network was increased to provide more realtime information about the spacecraft performance. This additional visibility confirmed how well Gaia was performing and no intervention was necessary."
- The storm had some minor, temporary effect on Gaia's attitude and orbit control system. The excess protons also caused the main science instrument to generate much more data than usual, which had to be offloaded from the onboard memory.
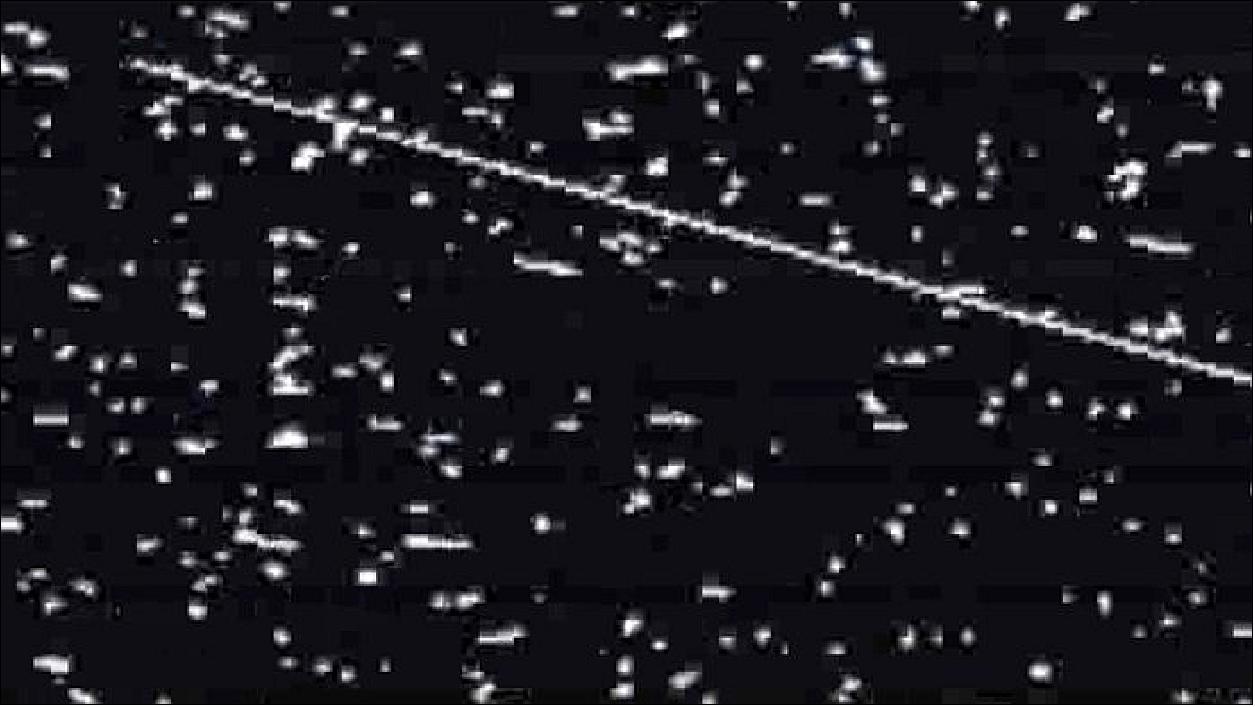
• On October 5, 2017, the largest moon of Neptune will pass in front of a distant star. This rare event will temporarily block the star's light from Earth and provide an excellent opportunity to study the moon's intriguing atmosphere. Data from ESA's Gaia mission is allowing astronomers to precisely plan their observations. 71)
- Alignments of this kind are called occultations. This particular one will be visible from Earth along a track that just skims the southern states of the USA, crosses the Atlantic and then passes through Europe. Observations are planned from Belgium, France, Germany, Greece, Italy, Spain, Switzerland and the UK, by both professional and amateur observers.
- Triton is the largest moon of Neptune. In terms of size it is an almost identical twin to Pluto. Also like Pluto, Triton possesses a tenuous nitrogen atmosphere, which the astronomers are keen to study.
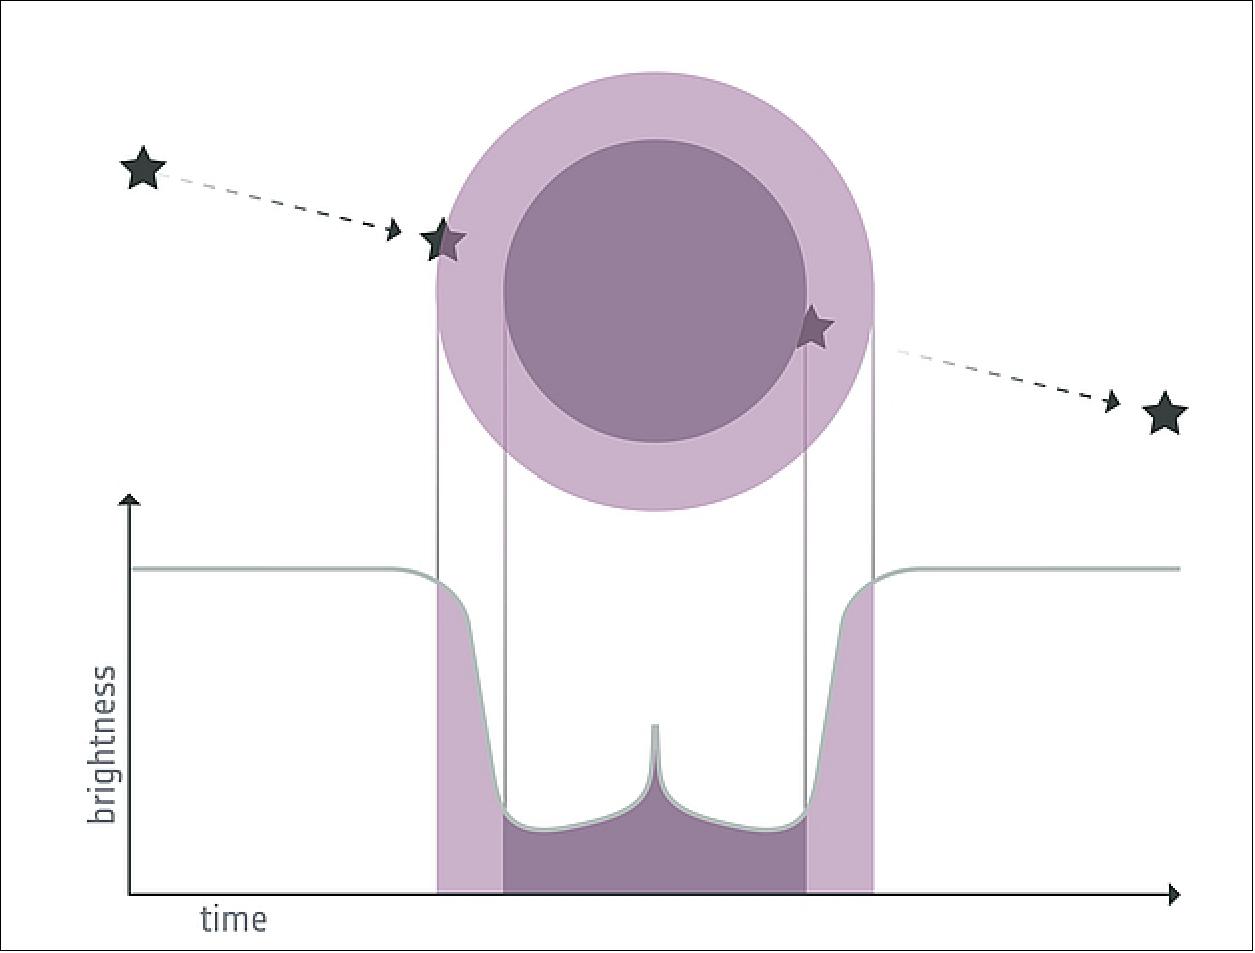
- As the moon drifts in front of the star, some of the starlight passes through the atmosphere and is diverted through a process called refraction. This results in a dimming of the star, from which density, pressure and temperature profiles of the atmosphere can be derived.
- To get the best data from the occultation, astronomers have to be on the central track. This is where the alignment between the Earth, Triton and the star is perfect. At this point, astronomers get to see a 'central flash'. This momentary brightening occurs because the atmosphere of Triton acts like a lens that focuses the starlight to Earth. This gives access to the deepest possible atmospheric layers, just a few kilometers above the surface.
- However, from the initial prediction of the occultation, the central path's track across the Earth's surface was uncertain by about 1200-1500 km. This made it easy to be in the wrong place and miss the flash completely. This is where Gaia came in.
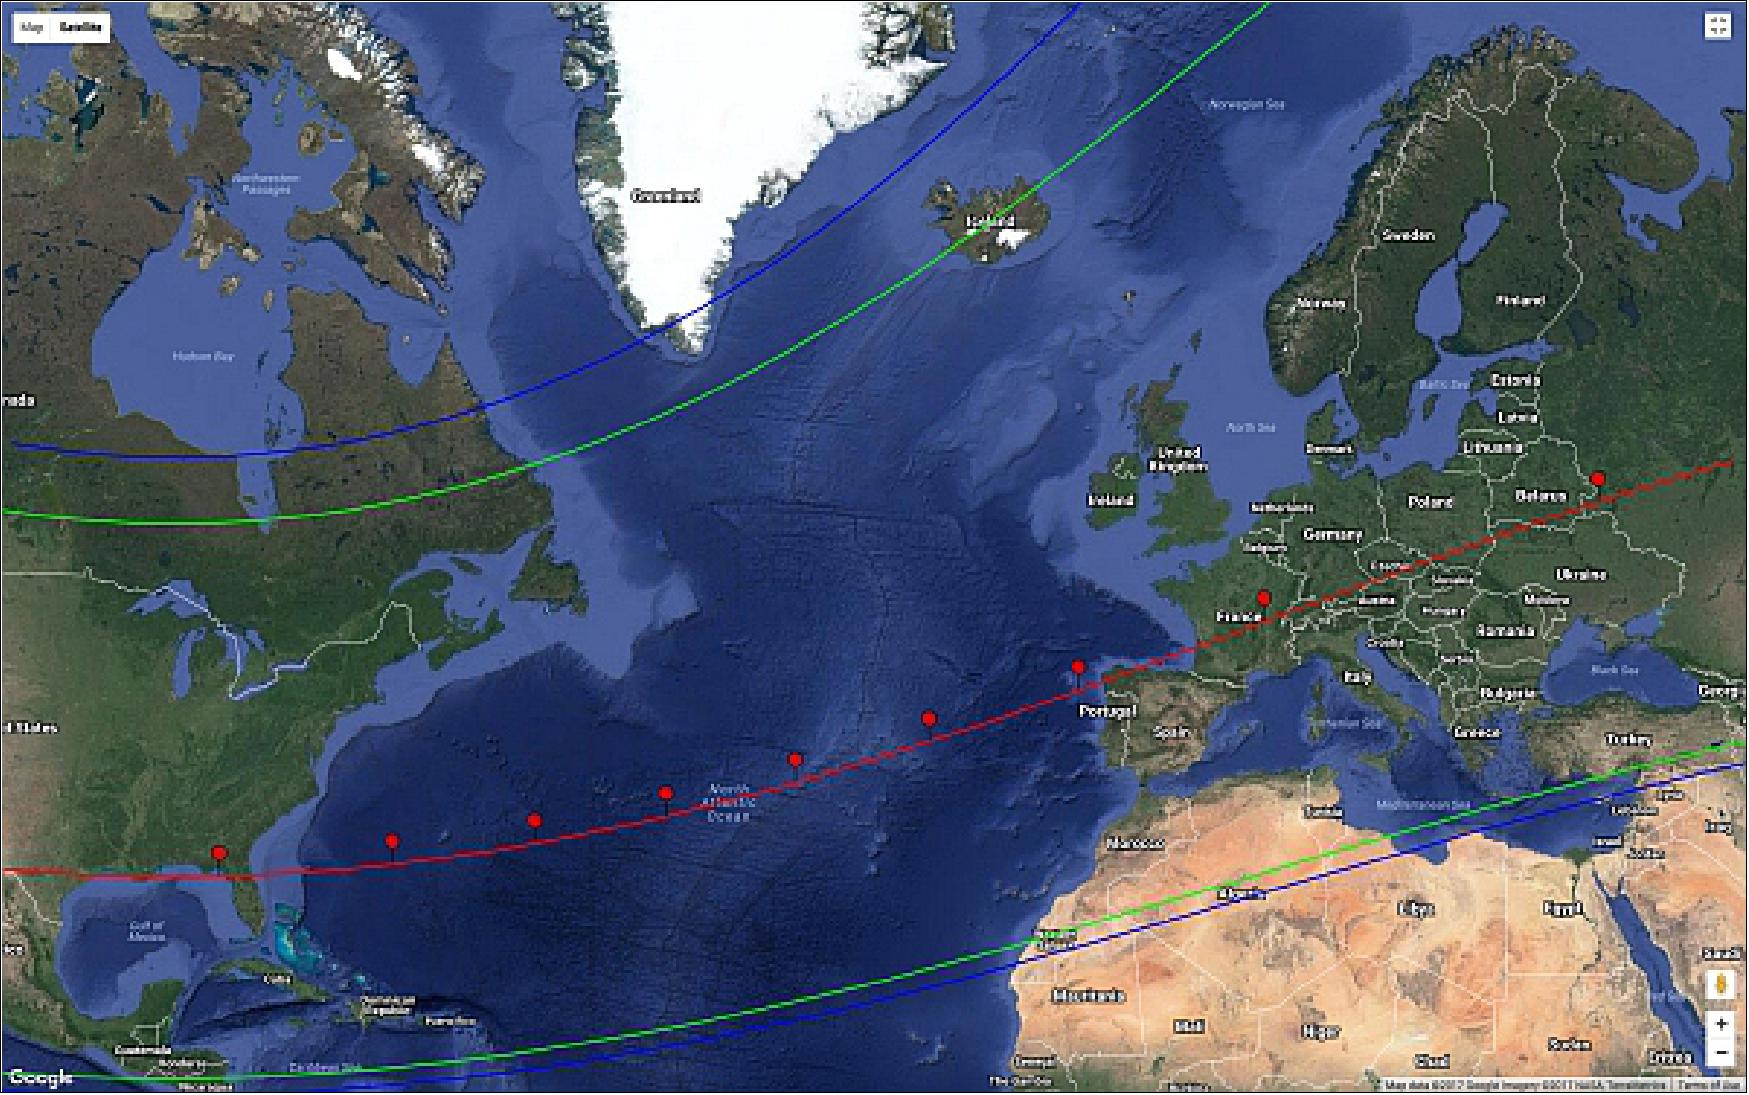
- Data from the publicly available first Gaia release (Gaia DR1) could already give a more accurate ground track but Gaia DR1 only provides this star's position. Knowing its motion on the sky, a quantity called the proper motion, would help to improve the accuracy even more. However, despite Gaia DR1 containing 2 million proper motions, this particular star's motion would only become available in April 2018 with the Gaia second data release (Gaia DR2).
- Since the forthcoming Triton occultation presents a rare opportunity to study the atmosphere, Josselin Desmars, an astronomer from the Observatoire de Paris in France, decided to approach the Gaia team and make a special request on behalf of the ERC Lucky Star project. The project, led by Bruno Sicardy from Université Pierre et Marie Curie and Observatoire de Paris, studies the poorly-known, but important, Trans-Neptunian Objects. Desmars coordinates the predictions of this Triton event using recent astrometric measurements of Neptune's moon made in Brazil.
- "In April 2017, we asked the Gaia team if we could get some stars from their upcoming second data release in order to refine the prediction and gather observing stations along the central flash," says Desmars. The Gaia team agreed on the importance of the observation and released the preliminary Gaia DR2 position and proper motion to help the campaign.
- Armed with this information, a much more accurate track has been calculated. Now the various observing stations across Europe can be placed at well-defined offsets to ensure that at least one of them sees the central flash.
- The first definitive measurements of Triton's atmosphere were made in 1989 by the Voyager 2 spacecraft during its flyby. It discovered that the atmosphere was extremely tenuous (just one 70, 000th of the surface pressure of Earth), extended up to 800 km from the moon's surface, and possessed a temperature of around 38 Kelvin (-235°C).
- Eight years later, an occultation took place that allowed astronomers using the Hubble Space Telescope to measure the atmosphere again. They saw something surprising. Triton's atmospheric temperature had increased by 5%, which could indicate that Triton was warming during the Neptunian summer.
- The occultation on 5 October is the first favorable one since 1997 and astronomers want to see if the warming trend has continued. "We hope to get a lot of observations from professionals and amateurs to let us really study the atmosphere," says Desmars.
- This is not the first time Gaia data have been provided for such an event. Desmars also used preliminary Gaia DR2 data for occultations of Chariklo, a distant asteroid. This asteroid is known to have a ring system surrounding it, like a mini Saturn. The Gaia data helped to improve the predicted occultation paths, leading to very successful observational campaigns in the summer of this year.
- In May, the Gaia team released the preliminary data for the star that will be occulted by Triton. This week, the Gaia team made public preliminary astrometric data for an additional few hundred stars in the field surrounding Triton to allow astronomers to further improve the occultation predictions. The team cautions that for all of these preliminary data full validation is not yet done and therefore some caution is required when interpreting the results.
• September 25, 2017: A team of astronomers led by Andreas Koch of the Lancaster University, U.K., has recently conducted a detailed chemical abundance study of the recently discovered star cluster Gaia 1. The research, published Sept. 12 on arXiv.org, offers new insights into the nature of this newly found cluster. 72) 73)
- Gaia 1 is a large, massive, nearby star cluster first identified in May 2017 in the Data Release 1 (DR1) from the Gaia space observatory operated by ESA (European Space Agency). Located some 15,000 light years away from the Earth, this cluster has a half-light radius of about 29 light years and a mass of approximately 22,000 solar masses.
- Although fundamental parameters of Gaia 1 are known, the researchers are still uncertain about its age, metallicity and origin. The cluster was initially classified as an intermediate-age (6.3 billion years old), and moderately metal-rich system. However, further studies found that Gaia 1 is about 3.3 billion years younger and more metal-rich than previously thought. Moreover, some astronomers have suggested the possibility of extragalactic origin for Gaia 1, given that its orbit leads it up to 5,500 light-years above the Milky Way's disk.
- Now, Koch's team has performed a new chemical analysis of Gaia 1 with the aim of clarifying these uncertainties. The researchers have measured detailed chemical abundances of 14 elements in four red giant members of the cluster.
- "This work focuses on a detailed chemical abundance analysis of four red giant members of Gaia 1, based on high-resolution spectroscopy, which we complement by an investigation of the orbital properties of this transition object," the authors wrote in the paper.
- The four stars were observed with the Echelle spectrograph at the 2.5 m Du Pont telescope at the Las Campanas Observatory, Chile. Besides the previously estimated iron content, this instrument allowed the researchers to obtain abundances of lithium, carbon, oxygen, magnesium, aluminum, silicon, calcium, titanium, scandium, vanadium, chromium, cobalt, nickel and zinc.
- The analysis revealed that Gaia 1 is associated with the Milky Way's thick disk and is more metal-poor than previously estimated. Moreover, they suggest that the system is a massive open cluster rather than a low-mass globular cluster.
- "Our abundance analysis revealed alpha abundances that are consistent with the thick disk (...) Despite the presence of mild light element variations in Na, Mg, and Al no obvious (anti-) correlations are seen between those elements as would be expected in galactic globular clusters. Since its stellar mass of a few ten thousand solar masses places Gaia 1 at the boundary between very low-mass globular clusters and very luminous open clusters, our analysis rather comforts the latter view," the paper reads.
• September 4, 2017: Gaia, ESA's billion-star surveyor, is detecting stars and measuring their properties in order to build up the most precise 3D map of the Milky Way. By accurately measuring the motion of each star, astronomers will be able to peer back in time to understand the Milky Way's history, its evolution and its destiny. 74)
- In general, as Gaia registers stars, only data covering the object of interest are transmitted to the ground. However, in the densest regions on the sky there are more stars close to each other than the detection and processing system of Gaia can cope with, which could result in a less complete census in these crowded areas.
- To help mitigate this, a scientific selection of high-density regions is made to cover them in a special imaging mode, as illustrated here. These types of observations are carried out routinely every time Gaia scans over these regions.
- The image of Figure 66, taken on 7 February 2017, covers part of the Sagittarius I Window (Sgr-I) located only two degrees below the Galactic Center. Sgr-I has a relatively low amount of interstellar dust along the line of sight from Earth, giving a ‘window' to stars close to the Galactic Center.
- The stellar density here is an incredible 4.6 million stars per square degree. The image covers about 0.6 square degrees, making it conceivable that there are some 2.8 million stars captured in this image sequence alone.
- The image appears in strips, each representing a sky mapper CCD). The image has been lightly processed to bring out the contrast of the bright stars and darker traces of gas and dust. Zooming in reveals some imaging artifacts relating to the CCDs, including some vertical striping, as well as short bright streaks indicating cosmic rays. Analysis of these images will only start once the effort required by the routine data processing allows.
- Gaia's first catalog of more than a billion stars, based on the first 14 months of data collection, was released in September 2016. The next release is targeting April 2018, with subsequent releases foreseen for 2020 and 2022.
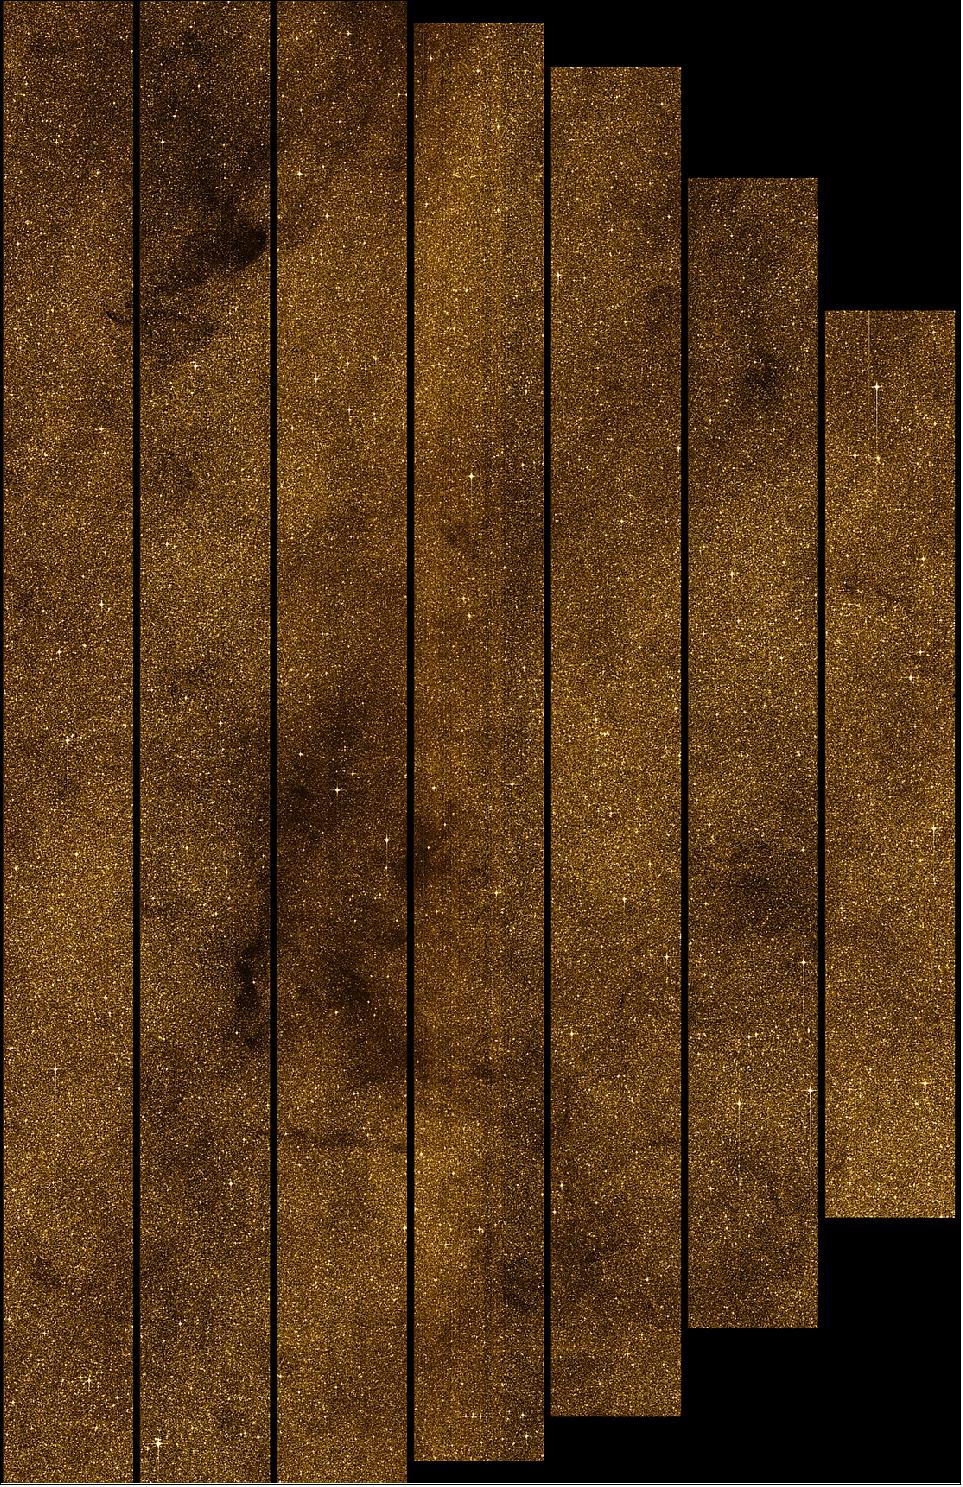
• August 31, 2017: The movements of more than 300,000 stars surveyed by ESA's Gaia satellite reveal that rare close encounters with our Sun might disturb the cloud of comets at the far reaches of our Solar System, sending some towards Earth in the distant future. 75)
- As the Solar System moves through the Galaxy, and as other stars move on their own paths, close encounters are inevitable – though ‘close' still means many trillions of kilometers.
- A star, depending on its mass and speed, would need to get within about 60 trillion kilometers before it starts to have an effect on the Solar System's distant reservoir of comets, the Oort Cloud, which is thought to extend out to 15 trillion kilometers from the Sun, 100 000 times the Sun–Earth distance. — For comparison, the outermost planet Neptune orbits at an average distance of about 4.5 billion kilometers, or 30 Sun–Earth distances.
- The gravitational influence of stars that pass near the Oort Cloud could perturb the paths of comets residing there, jolting them onto orbits that bring them in to the inner Solar System. While this is thought to be responsible for some of the comets that appear in our skies every hundred to thousand years, it also has the potential to put comets on a collision course with Earth or other planets.
- Understanding the past and future motions of stars is a key goal of Gaia as it collects precise data on stellar positions and motions over its five-year mission. After 14 months, the first catalogue of more than a billion stars was recently released, which included the distances and the motions across the sky for more than two million stars.
- By combining the new results with existing information, astronomers began a detailed, large-scale search for stars passing close to our Sun. So far, the motions relative to the Sun of more than 300,000 stars have been traced through the Galaxy and their closest approach determined for up to five million years in the past and future. Of them, 97 stars were found that will pass within 150 trillion kilometers, while 16 come within about 60 trillion km.
- While the 16 are considered reasonably near, a particularly close encounter of one star, Gliese 710, in 1.3 million years' time, stands out. It is predicted to pass within just 2.3 trillion km or about 16,000 Earth–Sun distances, well within the Oort Cloud.
- The star is already well-documented, and thanks to the Gaia data, the estimated encounter distance has recently been revised. Previously, there was a 90% degree of certainty that it would come within 3.1–13.6 trillion kilometers. Now, the more accurate data suggest that it will come within 1.5–3.2 trillion km, with 2.3 trillion km most likely.
- Furthermore, although Gliese 710 has a mass of 60% that of our Sun, it travels much slower than most stars: nearly 50,000 km/h at closest approach, compared with the average 100,000 km/h. The speed of its passage means it will have plenty of time to exert its gravitational influence on bodies in the Oort Cloud, potentially sending showers of comets into the Solar System. - Despite its slower pace, it will still appear as the brightest, fastest object in the night sky at closest approach.
- Importantly, the latest study used Gaia measurements to make a general estimate of the rate of stellar encounters, taking into account uncertainties such as stars that might not have been observable in the existing catalog. 76)
• August 16, 2017: While surveying the positions of over a billion stars, ESA's Gaia mission is also measuring their color, a key diagnostic to study the physical properties of stars. A new image provides a preview of Gaia's first full-color all-sky map, which will be unleashed in its highest resolution with the next data release in 2018. 77)
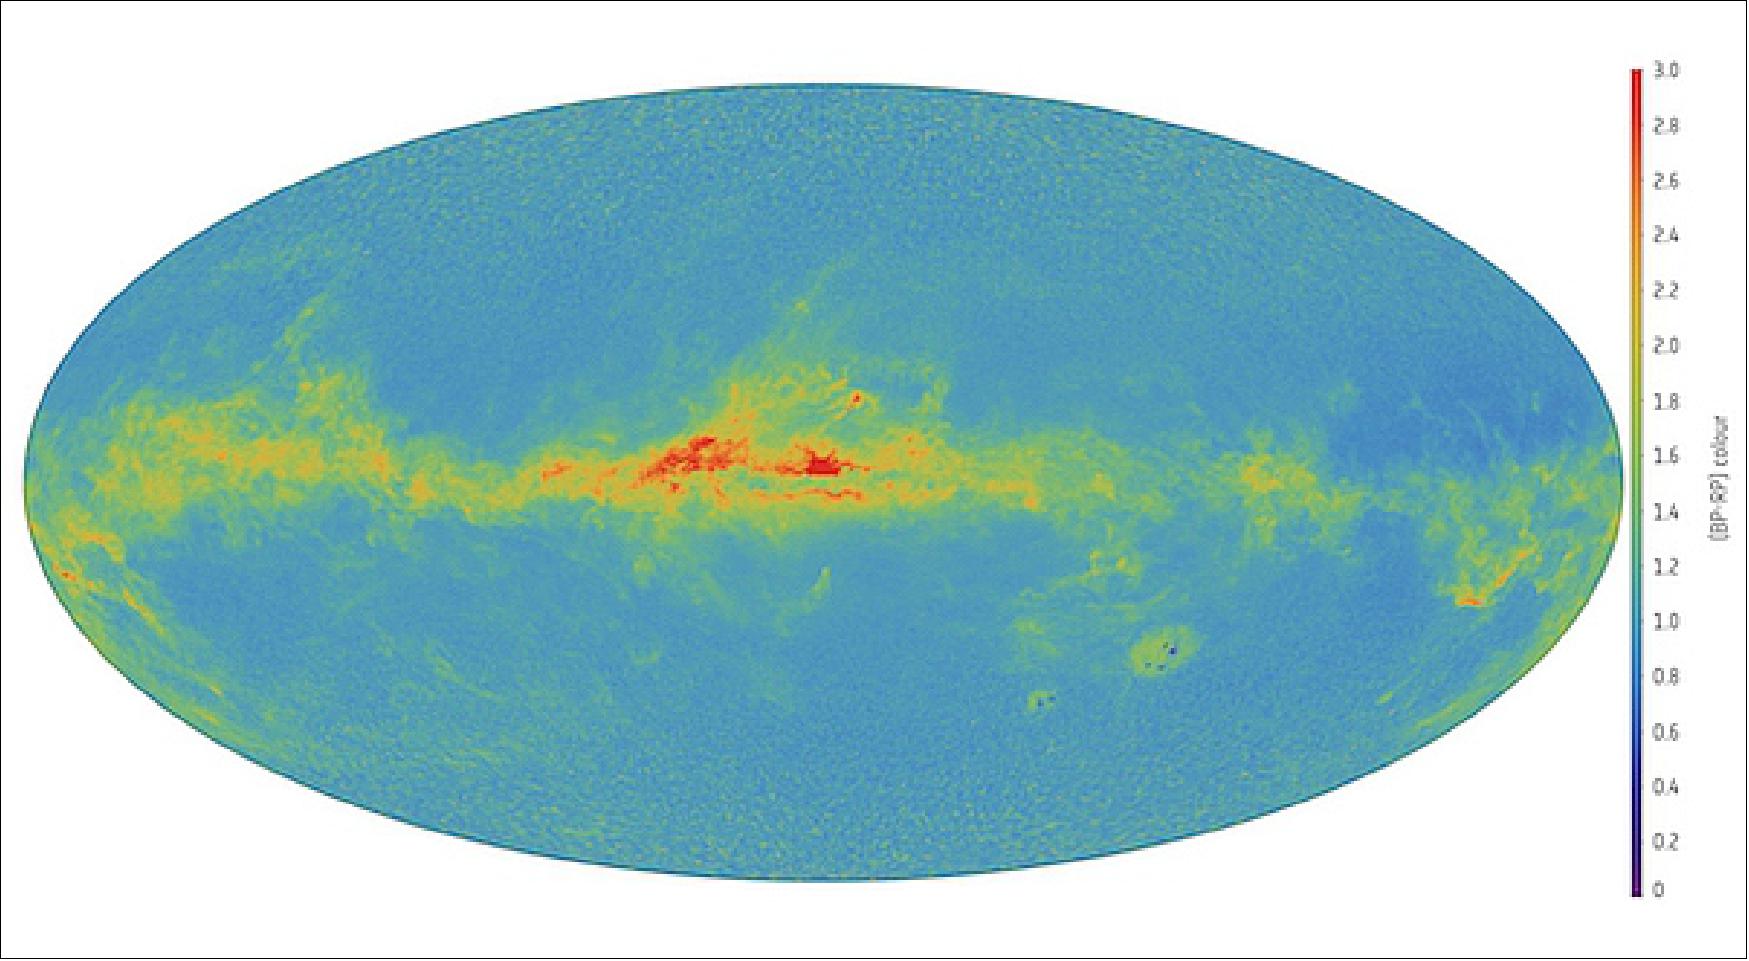
- Stars come in a variety of colors that depend on their surface temperature, which is, in turn, determined by their mass and evolutionary stage. Massive stars are hotter and therefore shine most brightly in blue or white light, unless they are approaching the end of their life and have puffed up into a red supergiant. Lower-mass stars, instead, are cooler and tend to appear red.
- Measuring stellar colors is important to solve a variety of questions, ranging from the internal structure and chemical composition of stars to their evolution.
- Gaia, ESA's astrometry mission to compile the largest and most precise catalogue of stellar positions and motions to date, has also been recording the color of the stars it observes. The satellite was launched in December 2013 and has been collecting scientific data since July 2014.
- A special effort in the Gaia DPAC (Data Processing and Analysis Consortium) is dedicated to the challenging endeavour of extracting stellar colors from the satellite data. While these measurements will be published with Gaia's second data release in April 2018, a preview of the Gaia sky map in color demonstrates that the ongoing work is progressing well.
- The new map, based on preliminary data from 18.6 million bright stars taken between July 2014 and May 2016, shows the middle value (median) of the colors of all stars that are observed in each pixel. It is helpful to look at it next to its companion map, showing the density of stars in each pixel, which is higher along the Galactic Plane – the roughly horizontal structure that extends across the image, corresponding to the most densely populated region of our Milky Way galaxy – and lower towards the poles.
Note: The preliminary color map shows a sample of stars that have been selected randomly from all Gaia stars with G-band magnitudes brighter than 17 and for which both color measurements (from the blue and the red channels of Gaia's photometric instrument) are available.
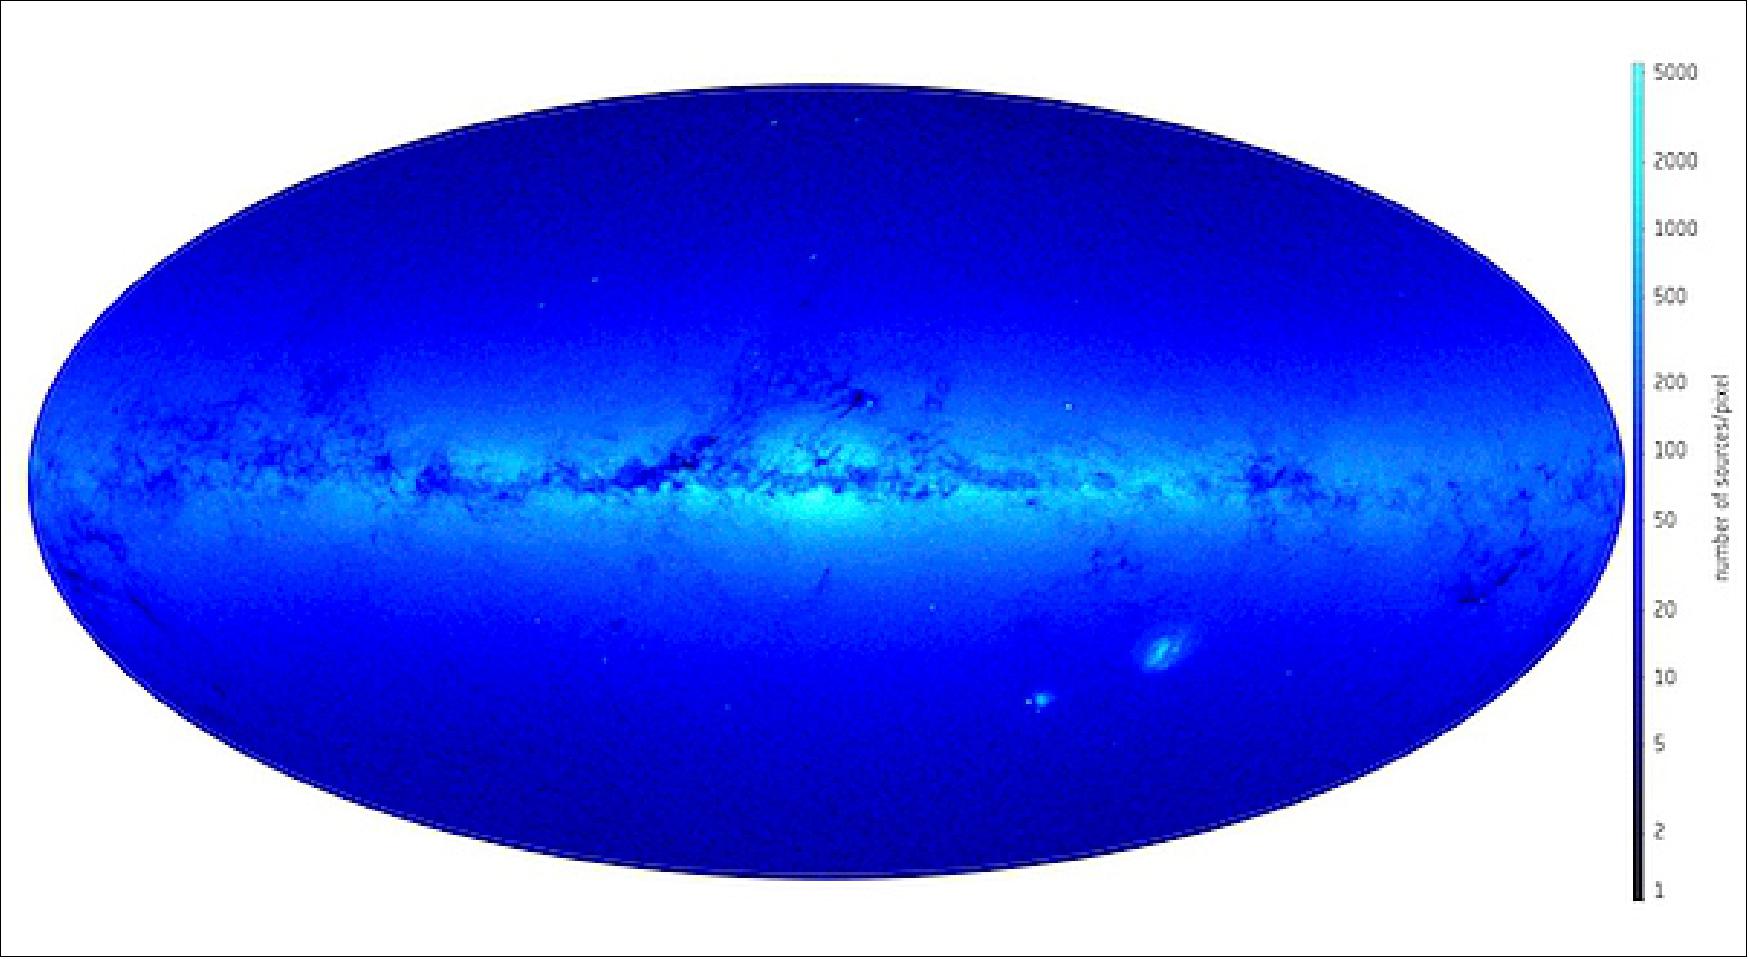
- Even though this map is only meant as an appetizer to the full treat of next year's release, which will include roughly a hundred times more stars, it is already possible to spot some interesting features.
- The reddest regions in the map (Figure 67), mainly found near the Galactic Center, correspond to dark areas in the density map: these are clouds of dust that obscure part of the starlight, especially at blue wavelengths, making it appear redder – a phenomenon known as reddening.
- It is also possible to see the two Magellanic Clouds – small satellite galaxies of our Milky Way – in the lower part of the map.
- The task of measuring colors is performed by the photometric instrument on Gaia. This instrument contains two prisms that split the starlight into its constituent wavelengths, providing two low-resolution spectra for each star: one for the short, or blue, wavelengths (330-680 nm) and the other for the long, or red, ones (640-1050 nm). Scientists then compare the total amount of light in the blue and red spectra to estimate stellar colors.
- To precisely calibrate these spectra, however, it is necessary to know the position of each source on Gaia's focal plane to very high accuracy – in fact, to an accuracy that only Gaia itself can provide.
- As part of the effort to extract physical parameters from the data sent back by the satellite, scientists feed them to an iterative algorithm that compares the recorded images of stars to models of how such images should look: as a result, the algorithm provides a first estimate of the star's parameters, such as its position, brightness, or color. By collecting more data and feeding them to the algorithm, the models are constantly improved and so are the estimated parameters for each star.
- The first Gaia data release, published in September 2016, was based on less than a quarter of the total amount of data that will be collected by the satellite over its entire five-year mission, which is expected to observe each star an average of 70 times. This first release, listing unprecedentedly accurate positions on the sky for 1.142 billion stars, along with their brightness, contained no information on stellar colors: by then, it had not been possible to run enough iterations of the algorithm to accurately estimate additional parameters.
- As the satellite continues to observe more stars, scientists have now had more time to feed data to the iterative algorithm to obtain estimates of stellar colors, like the ones shown in the new map. These estimates will be validated, over the coming months, as part of the overall data processing effort leading to the second Gaia data release.
- Since the first data release, scientists across the world have been using Gaia's brightness measurements – which are obtained over the full G-band, from 330 to 1050 nm – along with datasets from other missions to estimate stellar colors. These studies have been applied to a variety of subjects, from variable stars and stellar clusters in our Galaxy to the characterization of stars in the Magellanic Clouds.
- Next year, the second release of Gaia data will include not only the position and G-band brightness, but also the blue and red color for over a billion stars – in addition to the long-awaited estimates of stellar parallaxes and proper motions based on Gaia measurements for all the observed stars. This extraordinary dataset will allow scientists to delve into the secrets of our Galaxy, investigating its composition, formation and evolution to an unparalleled degree of detail.
Note: Gaia's goal is to measure the parallax (a small, periodic change in the apparent position of a star caused by Earth's yearly revolution around the Sun, which depends on the star's distance from us) and proper motion (the motion of stars across the plane of the sky caused by their physical movement through the Galaxy) for over one billion stars. In the process, Gaia will measure also the brightness and color of these stars, take spectra for a subset of them, and observe a variety of other celestial objects, from asteroids in our own Solar System to distant galaxies beyond the Milky Way.
• June 26, 2017: With the help of software that mimics a human brain, ESA's Gaia satellite spotted six stars zipping at high speed from the center of our Galaxy to its outskirts. This could provide key information about some of the most obscure regions of the Milky Way. 78)
- Our galactic home, the Milky Way, houses more than a hundred billion stars, all kept together by gravity. Most are located in a flattened structure – the Galactic disc – with a bulge at its center, while the remaining stars are distributed in a wider spherical halo extending out to about 650,000 light-years from the center.
- Stars are not motionless in the Galaxy but move around its center with a variety of velocities depending on their location – for example, the Sun orbits at about 220 km/s, while the average in the halo is of about 150 km/s.
- Occasionally, a few stars exceed these already quite impressive velocities.
- Some are accelerated by a close stellar encounter or the supernova explosion of a stellar companion, resulting in runaway stars with speeds up to a few hundred km/s above the average.
- A new class of high-speed stars was discovered just over a decade ago. Swooping through the Galaxy at several hundred of km/s, they are the result of past interactions with the supermassive black hole that sits at the center of the Milky Way and, with a mass of four million Suns, governs the orbits of stars in its vicinity.
- "These hypervelocity stars are extremely important to study the overall structure of our Milky Way," says Elena Maria Rossi from Leiden University in the Netherlands, who presented Gaia's discovery of six new such stars today at the European Week of Astronomy and Space Science in Prague, Czech Republic. 79)
- "These are stars that have travelled great distances through the Galaxy but can be traced back to its core – an area so dense and obscured by interstellar gas and dust that it is normally very difficult to observe – so they yield crucial information about the gravitational field of the Milky Way from the center to its outskirts."
- Unfortunately, fast-moving stars are extremely difficult to find in the stellar haystack of the Milky Way, as current surveys list the speed of at most a few hundred thousand stars.
- To find them, scientists have been looking for young, massive stars that would stand out as interlopers in the old stellar population of the Galactic halo. Given away by their out-of-place age, these stars are likely to have received an extra kick to reach the halo. Further measurements of their speeds and estimates of their past paths can confirm if they are indeed hypervelocity stars that were shoved away from the center of the Milky Way.
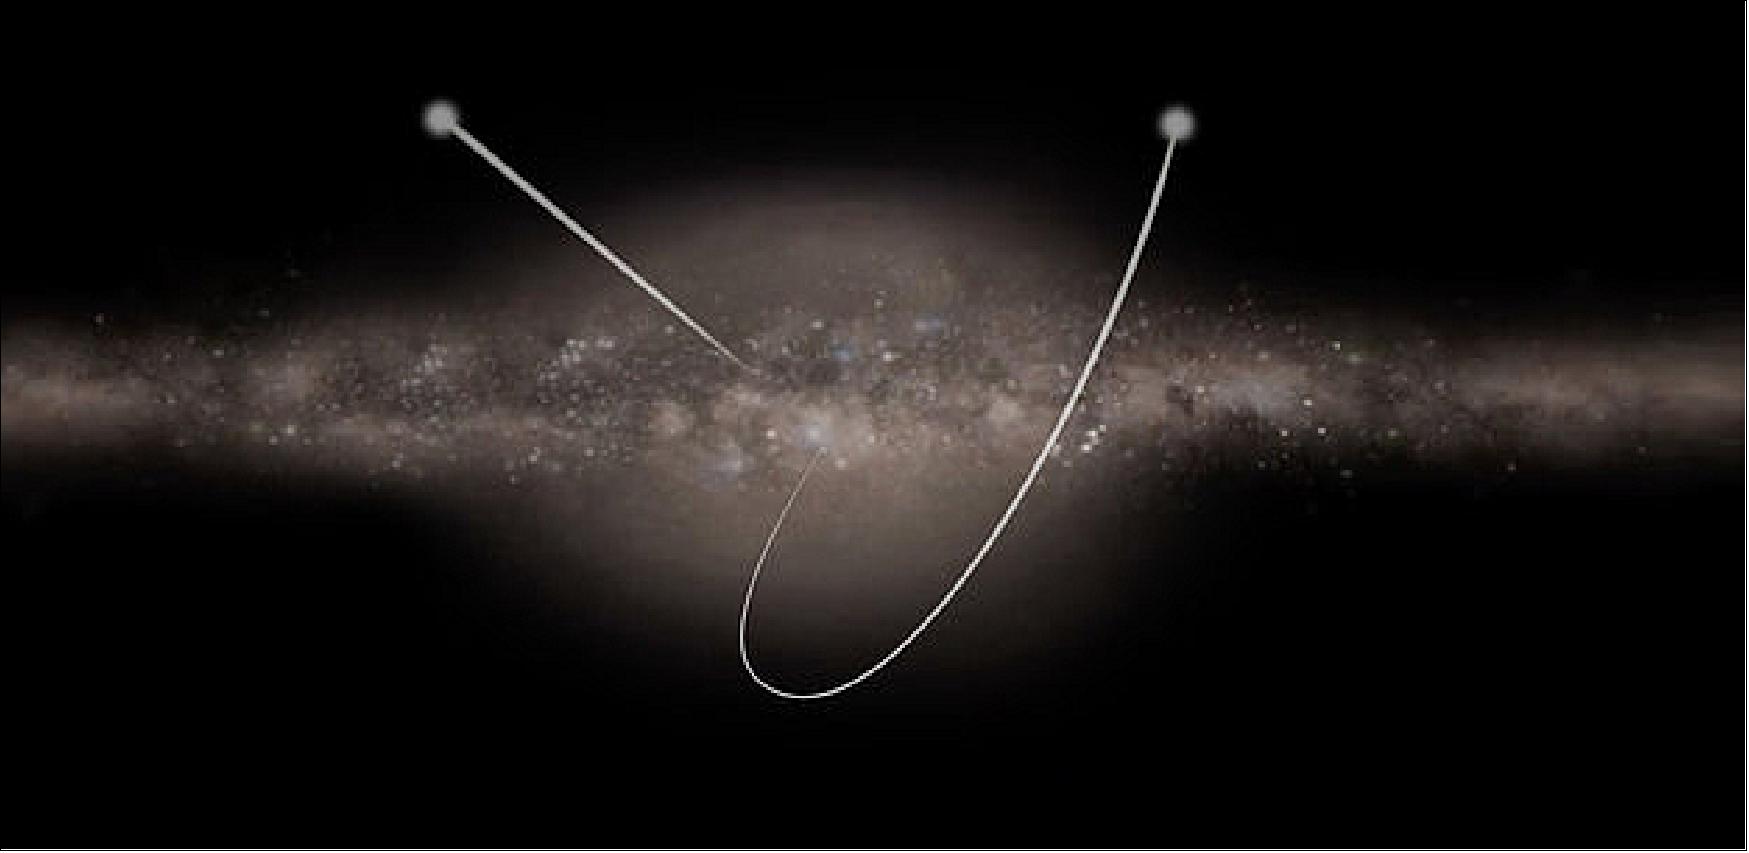
• April 20, 2017: While compiling an unprecedented census of one billion stars in our Galaxy, ESA's Gaia mission is also surveying stars beyond our Milky Way. A new image of M33, also known as the Triangulum galaxy, shows tens of thousands of stars detected by Gaia, including a small stellar census in its star-forming region NGC 604. This is a striking example of the mission's potential to detect and characterize stars in nearby galaxies (Figure 70). 80)
- Even though the majority of objects detected by Gaia are Milky Way stars, the satellite has also been observing a wealth of stars that belong to other galaxies, providing an important database to study the stellar populations of galaxies beyond our own. Observations of the M33 galaxy provide a clear demonstration of Gaia's prospects for extragalactic studies. — In addition to stars in the Milky Way and nearby galaxies, Gaia has been detecting distant galaxies and quasars – the bright cores of distant galaxies with an active black hole at their center – as well as hundreds of thousands of asteroids and other small bodies in the Solar System.
- Located some 2.4 million light-years away, M33 is one of our neighboring galaxies and is part of the Local Group, the assembly of galaxies that includes our Milky Way and the Andromeda galaxy. A spiral galaxy with less than one tenth the mass of the Milky Way or Andromeda, M33 is the third largest member of the Local Group and is thought to be a satellite galaxy of Andromeda.
- Gaia's detections correspond to about 40 000 of the galaxy's brightest stars, a small fraction of the total stellar population of M33, which amounts to roughly 40 billion stars. The high stellar density of this region means that Gaia can only detect a fraction of these extragalactic stars each time it scans this portion of the sky.
- Very dense stellar fields – like external galaxies, as well as the densest portions of our Galaxy, such as Baade's Window (Note: Baade's Window is an area on the sky toward the center of the Milky Way with little contamination by interstellar dust, where the density of stars reaches up to three million per square degree) — are particularly challenging for Gaia. Even if very powerful, the data processing units on the satellite have a limit to the number of objects that can be observed per second without saturating the onboard computer. As time goes by, Gaia will survey these regions on many more occasions and with different scanning configurations, eventually recording more of the detected stars.
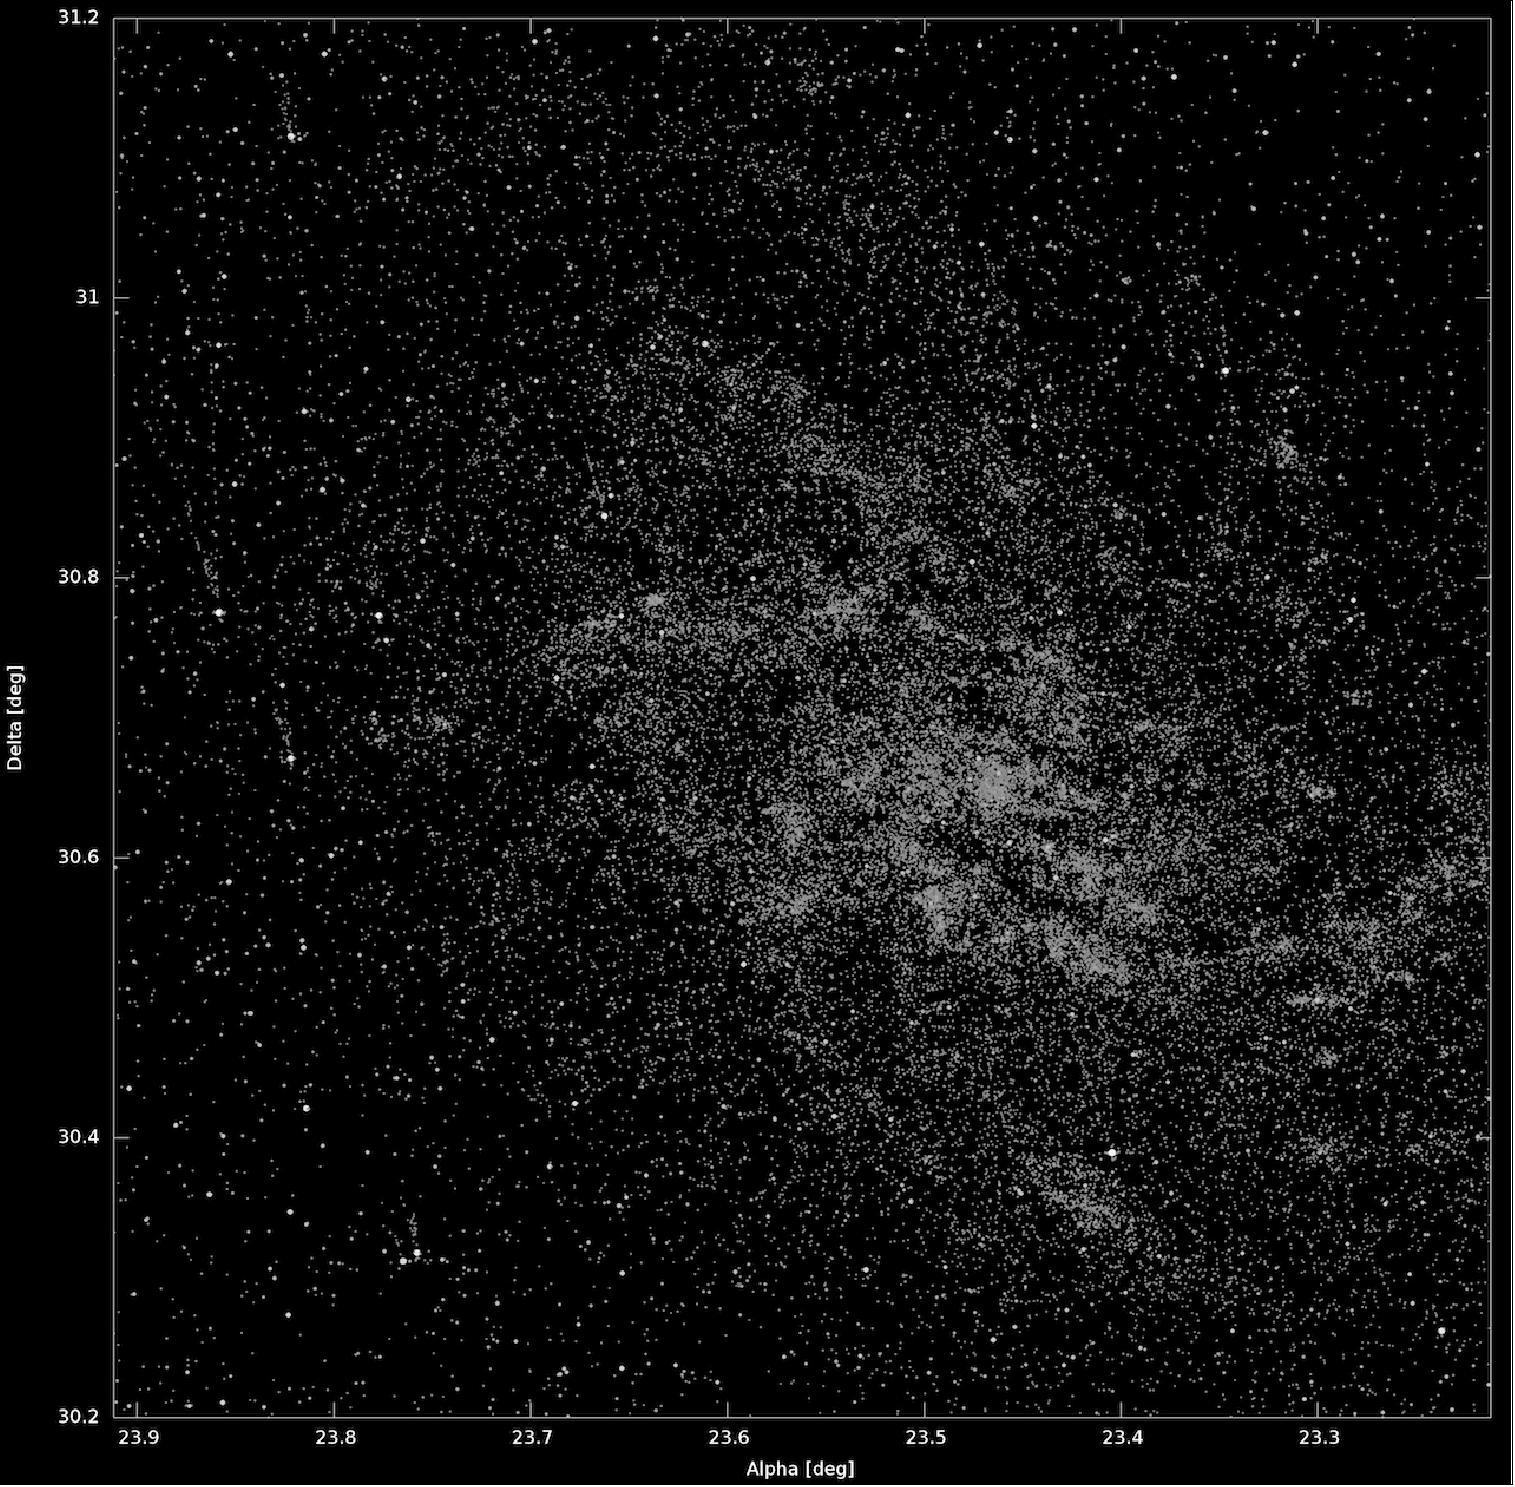
- M33 hosts a well-known star-forming region, NGC 604, which is home to many newborn stars. With a density of about one million stars per square degree, NGC 604 is one such challenging region to observe (Figure 71).
- A comparison between the Gaia detections in that region and a high-resolution image of this stellar nursery from the NASA/ESA Hubble Space Telescope shows that Gaia has detected about 150 individual stars in the NGC 604 region, which spans only about 0.55 square arcminutes in the sky. This number might not sound big in absolute terms, but it is impressive when considering that the observed field is about 2000 times smaller than the area covered by the full Moon in the sky, revealing that Gaia is able to detect a significant number of extragalactic stars.
- This is even more remarkable given that Gaia's observed stars are automatic detections obtained by the satellite's onboard computing system while scanning over the region, whereas the stars detected in astronomical images, such as those from Hubble, are the result of dedicated observations obtained by pointing at specific regions on the sky, which are later analyzed by scientists.
- With this quality of data, observations of stellar fields in Local Group galaxies like M33 will yield estimates of the position, parallax, and proper motion for a wealth of extragalactic stars – these will be published in the future Gaia data releases (Note: Due to the great distance of these extragalactic stars, they are mostly among the faintest sources detected by the satellite, requiring an especially meticulous analysis of the data in order to interpret them correctly).
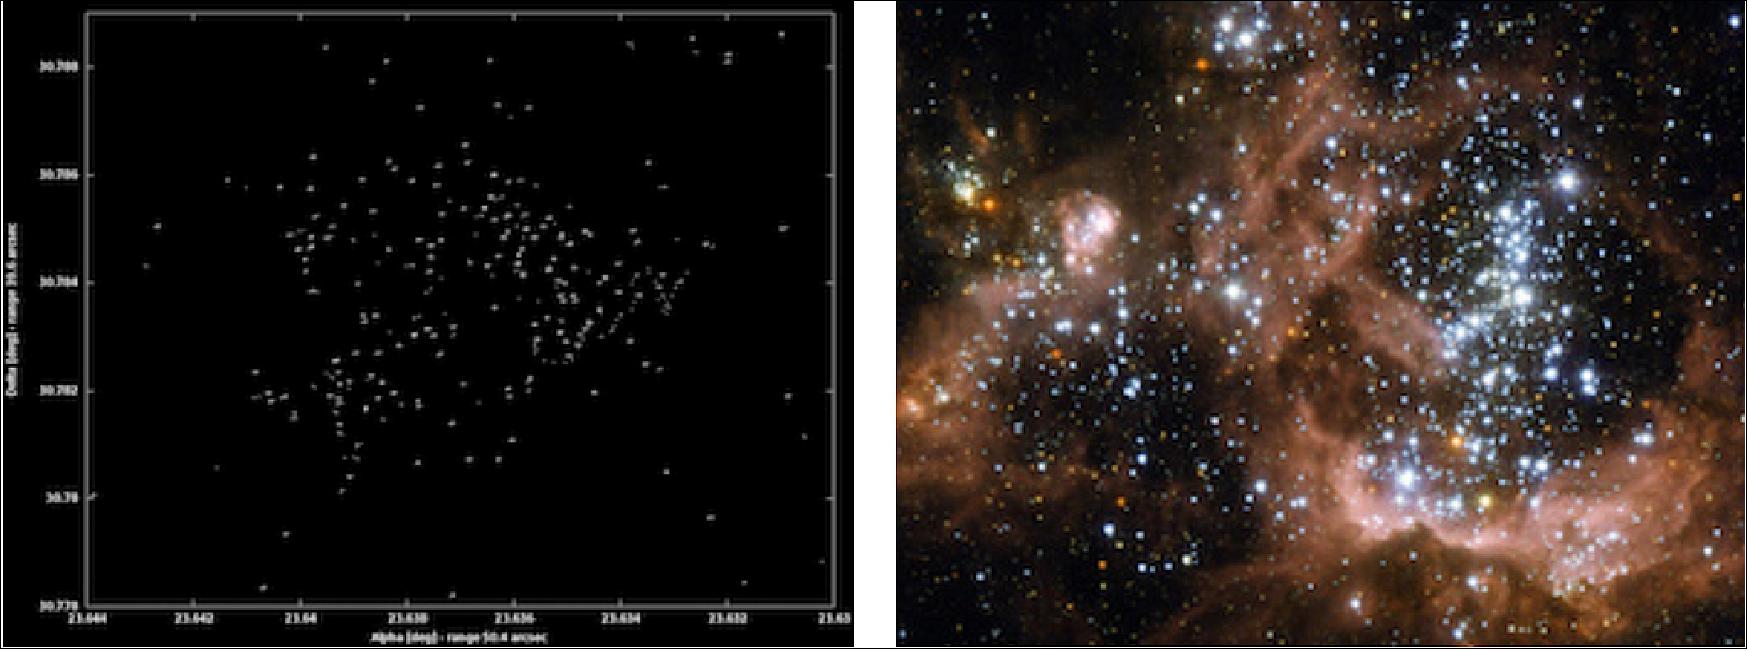
• April 10, 2017: Figure 72 may look like a brightly decorated Easter egg wrapping, but it actually represents how ESA's Gaia satellite scanned the sky during its first 14 months of science operations, between July 2014 and September 2015. 81)
- The oval represents the celestial sphere, with the colors indicating how frequently the different portions of the sky were scanned. Blue represents the regions scanned most frequently in that time period; the lighter colors lesser so.
- The satellite scans great circles on the sky, with each lasting about six hours. During the first month, the scanning procedure was such that the ecliptic poles were always included. This meant that Gaia observed the stars in those regions many times, providing an invaluable database for the initial calibration of the observations.
- Then, the satellite started its main survey, scanning in such a way to achieve the best possible coverage of the whole sky.
- Over its five-year mission, Gaia will survey one billion stars in our Galaxy and local galactic neighborhood, measuring their position and motion at unprecedented accuracy, in order to build the most precise 3D map of the Milky Way and answer questions about its structure, origin and evolution.
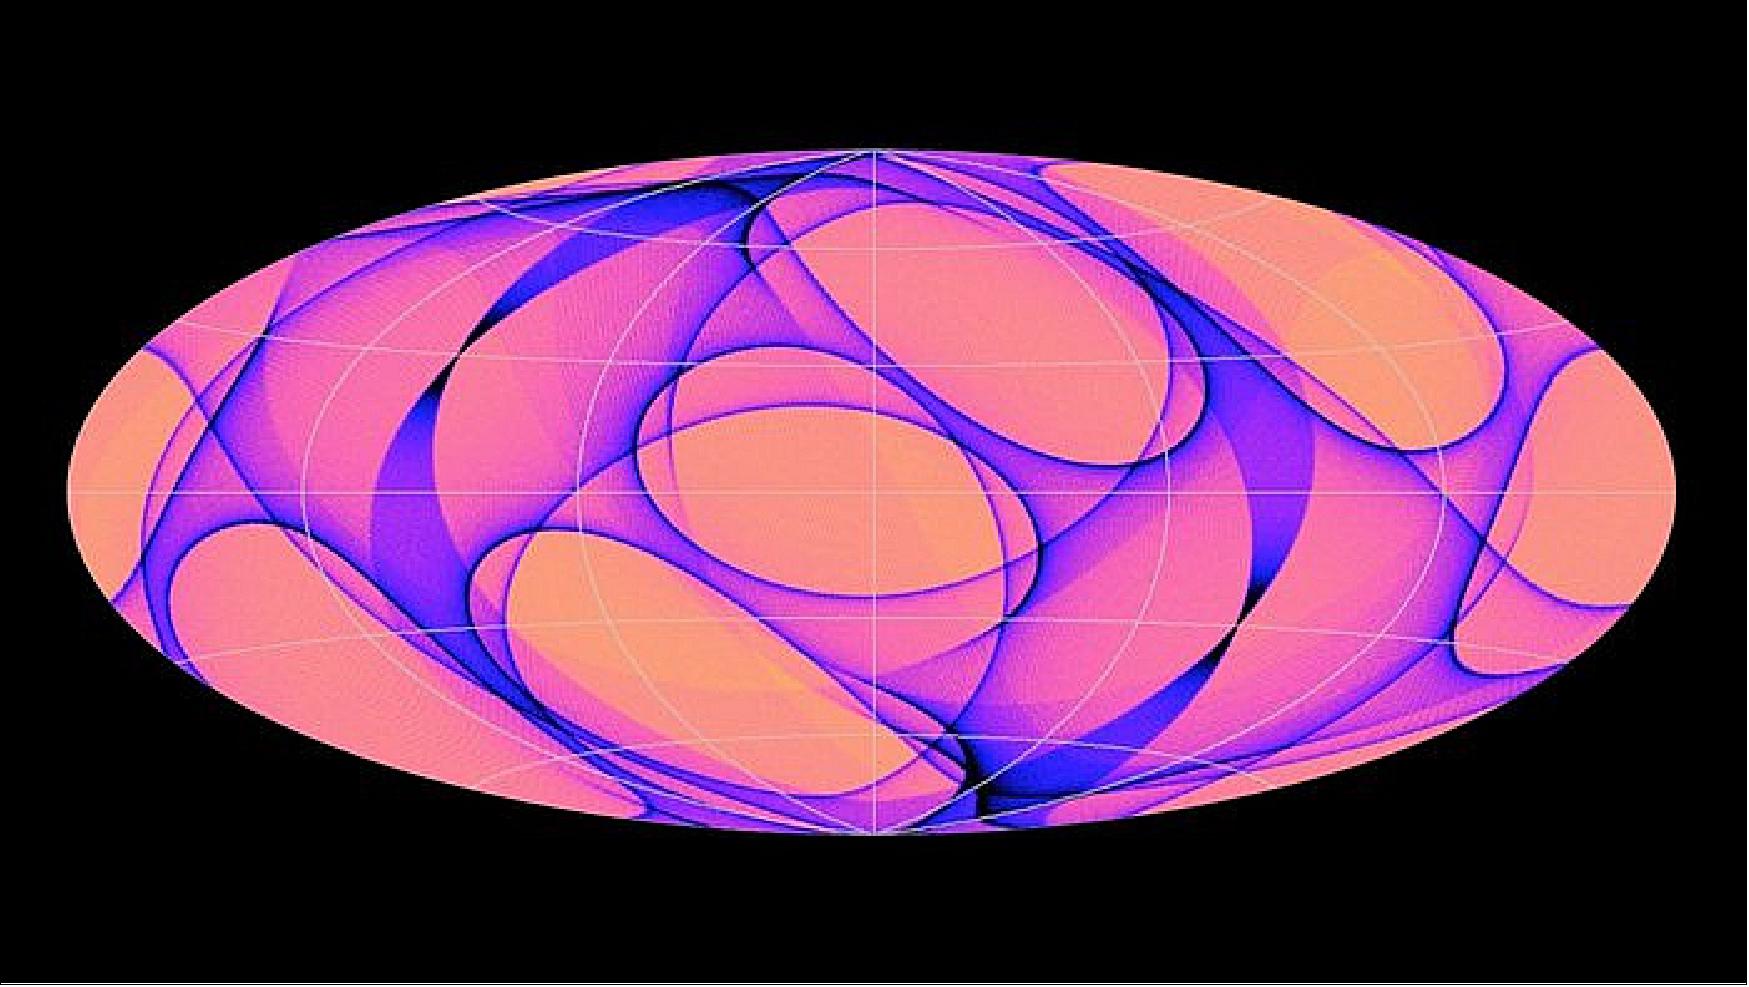
• February 13, 2017: Using a novel method and Gaia data, University of Toronto astronomers have estimated that the speed of the Sun and its distance from the center of the Milky Way Galaxy is approximately 240 km/second. In turn, they have used that result to calculate that the Sun is approximately 7.9 kiloparsec from the Galaxy's center — or almost 26,000 light-years. 82)
- Using data from the Gaia space telescope and the RAVE (RAdial Velocity Experiment) survey 83), Jason Hunt and his colleagues determined the velocities of over 200,000 stars relative to the Sun. Hunt is a Dunlap Fellow at the Dunlap Institute for Astronomy & Astrophysics, University of Toronto. The collaborators found an unsurprising distribution of relative velocities: there were stars moving slower, faster and at the same rate as the Sun.
- But they also found a shortage of stars with a Galactic orbital velocity of approximately 240 km/s slower than the Sun's. The astronomers concluded that the missing stars had been stars with zero angular momentum; i.e. they had not been circling the Galaxy like the Sun and the other stars in the Milky Way Galaxy. "Stars with very close to zero angular momentum would have plunged towards the Galactic center where they would be strongly affected by the extreme gravitational forces present there," says Hunt. "This would scatter them into chaotic orbits taking them far above the Galactic plane and away from the Solar neighborhood. ...By measuring the velocity with which nearby stars rotate around our Galaxy with respect to the Sun," says Hunt, "we can observe a lack of stars with a specific negative relative velocity. And because we know this dip corresponds to 0 km/sec, it tells us, in turn, how fast we are moving."
- Hunt and his colleagues then combined this finding with the proper motion of the supermassive blackhole known as Sagittarius A* ("A-star") that lies at the center of the Galaxy to calculate the 7.9 kiloparsec distance. 84)
- Proper motion is the motion of an object across the sky relative to distant background objects. They calculated the distance in the same way a cartographer triangulates the distance to a terrestrial landmark by observing it from two different positions a known distance apart. The result was published in Astrophysical Journal Letters in December 2017. 85)
- The method was first used by Hunt's co-author, current chair of the Department of Astronomy & Astrophysics at the University of Toronto, Prof. Ray Calberg, and Carlberg's collaborator, Prof. Kimmo Innanen. But the result Carlberg and Innanen arrived at was based on less than 400 stars.
- Gaia is creating a dynamic, three-dimensional map of the Milky Way Galaxy by measuring the distances, positions and proper motion of stars. Hunt and his colleagues based their work on the initial data release from Gaia which included hundreds of thousands of stars. By the end of its 5 year mission, the space mission will have mapped well over 1 billion stars.
- The velocity and distance results are not significantly more accurate than other measurements. But according to Hunt, "Gaia's final release in late 2017 should enable us to increase the precision of our measurement of the Sun's velocity to within approximately one km/sec, which in turn will significantly increase the accuracy of our measurement of our distance from the Galactic center."
• January 24, 2017: While best known for its surveys of the stars and mapping the Milky Way in three dimensions, ESA's Gaia has many more strings to its bow. Among them, its contribution to our understanding of the asteroids that litter the Solar System. Now, for the first time, Gaia is not only providing information crucial to understanding known asteroids, it has also started to look for new ones, previously unknown to astronomers. 86)
- Since it began scientific operations in 2014, Gaia has played an important role in understanding Solar System objects. This was never the main goal of Gaia — which is mapping about a billion stars, roughly 1% of the stellar population of our Galaxy — but it is a valuable side effect of its work. Gaia's observations of known asteroids have already provided data used to characterize the orbits and physical properties of these rocky bodies more precisely than ever before.
- "All of the asteroids we studied up until now were already known to the astronomy community," explains Paolo Tanga, Planetary Scientist at Observatoire de la Côte d'Azur, France, responsible for the processing of Solar System observations.
- These asteroids were identified as spots in the Gaia data that were present in one image and gone in one taken a short time later, suggesting they were in fact objects moving against the more distant stars.
![Figure 74: Gaia's asteroid detections [ESA/Gaia/DPAC/CU4, L. Galluccio, F. Mignard, P. Tanga (Observatoire de la Côte d'Azur)]](/api/cms/documents/163813/5389966/Gaia2019_Auto15.jpeg)
- Once identified, moving objects found in the Gaia data are matched against known asteroid orbits to tell us which asteroid we are looking at. "Now," continues Tanga, "for the first time, we are finding moving objects that can't be matched to any cataloged star or asteroid."
- The process of identifying asteroids in the Gaia data begins with a piece of code known as the IDT (Initial Data Processing) software – which was largely developed at the University of Barcelona and runs at the Data Processing Center at ESAC (European Space Astronomy Center), ESA's establishment in Spain.
- This software compares multiple measurements taken of the same area and singles out objects that are observed but cannot be found in previous observations of the area. These are likely not to be stars but, instead, Solar System objects moving across Gaia's field of view. Once found, the outliers are processed by a software pipeline at the CNES (Centre National d'Etudes Spatiales) data center in Toulouse, France, which is dedicated to Solar System objects. Here, the source is cross matched with all known minor bodies in the Solar System and if no match is found, then the source is either an entirely new asteroid, or one that has only been glimpsed before and has never had its orbit accurately characterized.
- Although tests have shown Gaia is very good at identifying asteroids, there have so far been significant barriers to discovering new ones. There are areas of the sky so crowded that it makes the IDT's job of matching observations of the same star very difficult. When it fails to do so, large numbers of mismatches end up in the Solar System objects pipeline, contaminating the data with false asteroids and making it very difficult to discover new ones.
- "At the beginning, we were disappointed when we saw how cluttered the data were with mismatches," explains Benoit Carry, Observatoire de la Côte d'Azur, France, who is in charge of selecting Gaia alert candidates. "But we have come up with ways to filter out these mismatches and they are working! Gaia has now found an asteroid barely observed before."
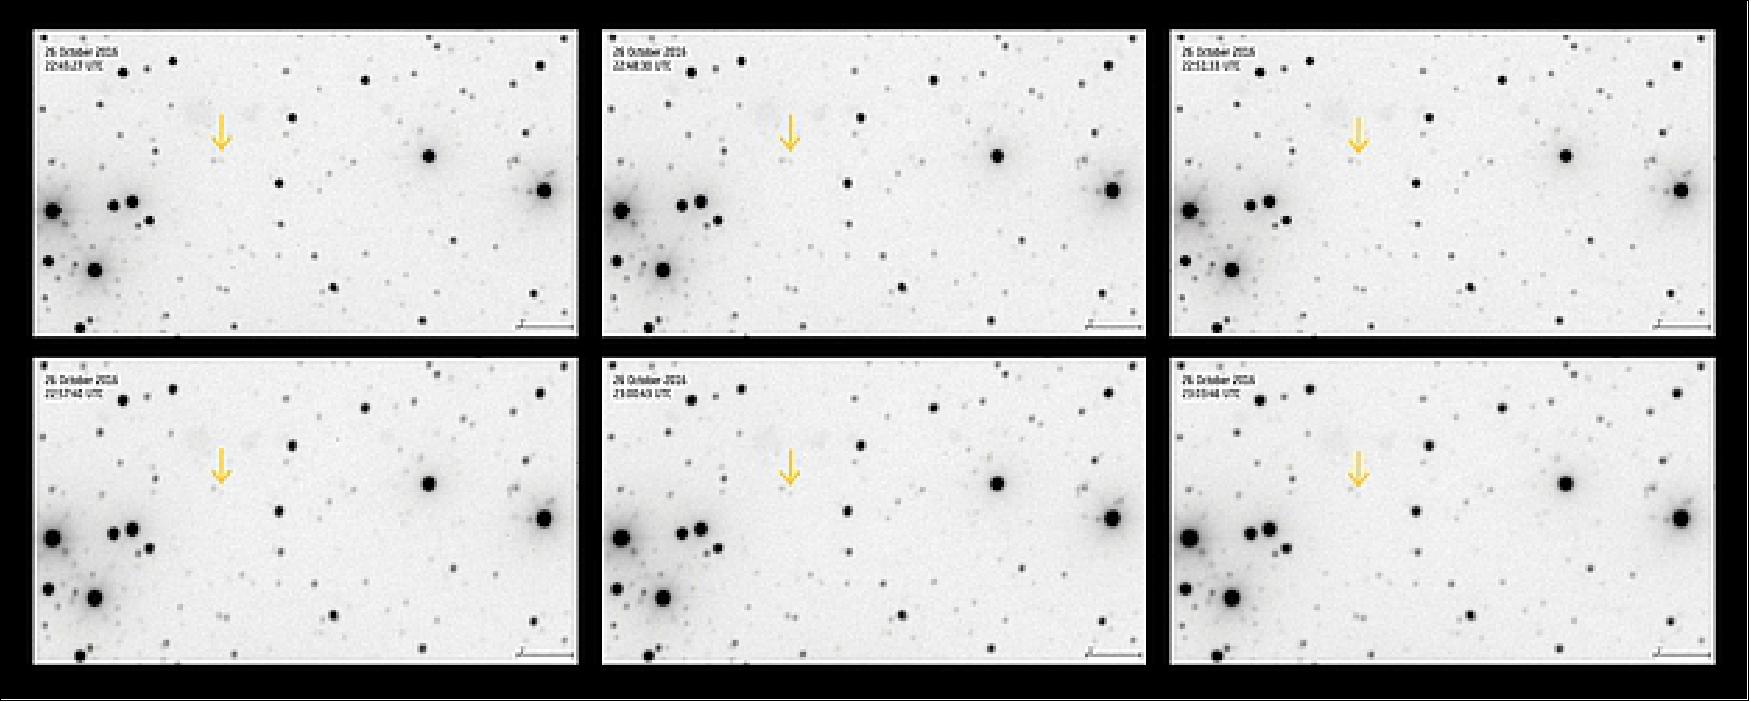
Legend to Figure 75: These six images show the asteroid Gaia-606 (indicated by an arrow) on 26 October 2016. The images, spanning a period of a little more than 18 minutes, were taken at the Observatoire de Haute Provence in southern France by William Thuillot, Vincent Robert and Nicolas Thouvenin (Observatoire de Paris/IMCCE).
- The asteroid in question, nicknamed Gaia-606, was found in October 2016 when Gaia data showed a faint, moving source. Astronomers immediately got to work and were able to predict the new asteroid's position as seen from the ground over a period of a few days. Then, at the Observatoire de Haute Provence (southern France), William Thuillot and his colleagues Vincent Robert and Nicolas Thouvenin (Observatoire de Paris/IMCCE) were able to point a telescope at the positions predicted and show this was indeed an asteroid that did not match the orbit of any previously catalogued Solar System object.
- However, despite not being present in any catalog, a more detailed mapping of the new orbit has shown that some sparse observations of the object do already exist. This is not uncommon with new discoveries where, as with Gaia-606 (now renamed 2016 UV56), objects that first appear entirely new transpire to be re-sightings of objects whose previous observations were not sufficient to map their orbits.
- Gaia-606 was found in the main asteroid belt, which is not surprising given how many asteroids exist there. However, Gaia also provides data from swathes of the sky not extensively observed by existing ground-based surveys giving it the potential to find asteroids in areas where others would not look. One such area is a region close to the Sun as seen from Earth. Observations are made from the Earth during the night when the angle between any source and the Sun is fairly large, whilst Gaia can make observations at any time and so observe objects much closer to the Sun. This gives Gaia the exciting potential to observe asteroids that orbit within Earth's orbit – these are known as Atira asteroids and only sixteen are currently known.
- Gaia also has the potential to make discoveries at high ecliptic latitudes. Not because ground-based surveys of Solar System objects cannot observe there, but because they tend not to. The vast majority of asteroids exist in the ecliptic plane and, as a result, it is here that most surveys concentrate their efforts. Gaia has no such prejudices and scans the entire sky, giving it the potential to discover new asteroids in the less crowded areas missed by other surveys (Ref. 86).
• December 23, 2016: The size of the Gaia DR1 (Data Release 1) datasets requires sophisticated analysis and plotting tools. For example, a simple plot of the positions of the stars on the sky in Gaia DR1 miserably fails, even if only 10 000 points or 1 000 000 points (top left and right panels of Figure 76, respectively) are shown. However, a density plot as that in the bottom adequately reveals the rich structure of the data, including all 1 142 679 769 sources in Gaia DR1, and can be generated in less than a second with VAEX. This density plot reveals, for example, structure in the galactic disk and artefacts due to the scanning nature of the observations performed with Gaia. 87)
With the arrival of large catalogs such as the Gaia DR1, which contains more than a billion objects, new methods of handling and visualising these data volumes are needed. For many science cases, as well as for quality checks of the data, one needs to visualise all or large parts of the data. While scatter plots would suffice for small catalogues, it would not work for the full Gaia catalog. Apart from the long time it takes to render each individual point as a glyph, overplotting makes the plot useless, as demonstrated in Figure 76, presented by Maarten Breddels at the Astro-informatics IAU Symposium in 2016 at Sorrento, Italy. 88)
This figure demonstrates how plotting a random subset of 10,000 stars (0.001% of the data, top left panel) shows structure in the galactic disk, while plotting just a million stars (0.1% of the data, top right panel), already starts to hide many of the structures present in the data. Instead, in the bottom panel of this figure, showing all data (more than a billion stars) in the form of a density plot reveals much more structure: dust lanes are clearly visible in the disk, our neighboring galaxies (the Large and Small Magellanic Clouds) stand out clearly against the background, but also artefacts in the data due to the scanning law of the satellite become visible. In this plot, low densities correspond to black, and high densities to white, where the scaling is logarithmic.
To visualize and explore large catalogues such as Gaia DR1, Maarten Breddels from the Kapteyn Astronomical Institute (University of Groningen, The Netherlands) developed a software package to perform the calculations needed for these visualizations efficiently. The calculations to compute the number of stars in each pixel take only about a second on a high-end desktop machine. Statistics, such as minimum, maximum, mean, moments, etc., can also be calculated efficiently in any number of dimensions.
The software packaged ,called VAEX, exists of two parts. The first is a Python package, allowing fast calculations of statistics for any property of the data (or any mathematical operations on them), and their visualization in, for instance, the Jupyter notebook. Built on top of this, is a graphical program for Linux and Mac OS X, enabling interactive exploration of the data including zooming, panning, and screen selections. VAEX is open source, available under a MIT License.
This work has been carried out in collaboration with Amina Helmi. It has been funded by a grant from the Netherlands Research School for Astronomy (NOVA), and a Vici grant from the Netherlands Organization for Scientific Research (NWO).
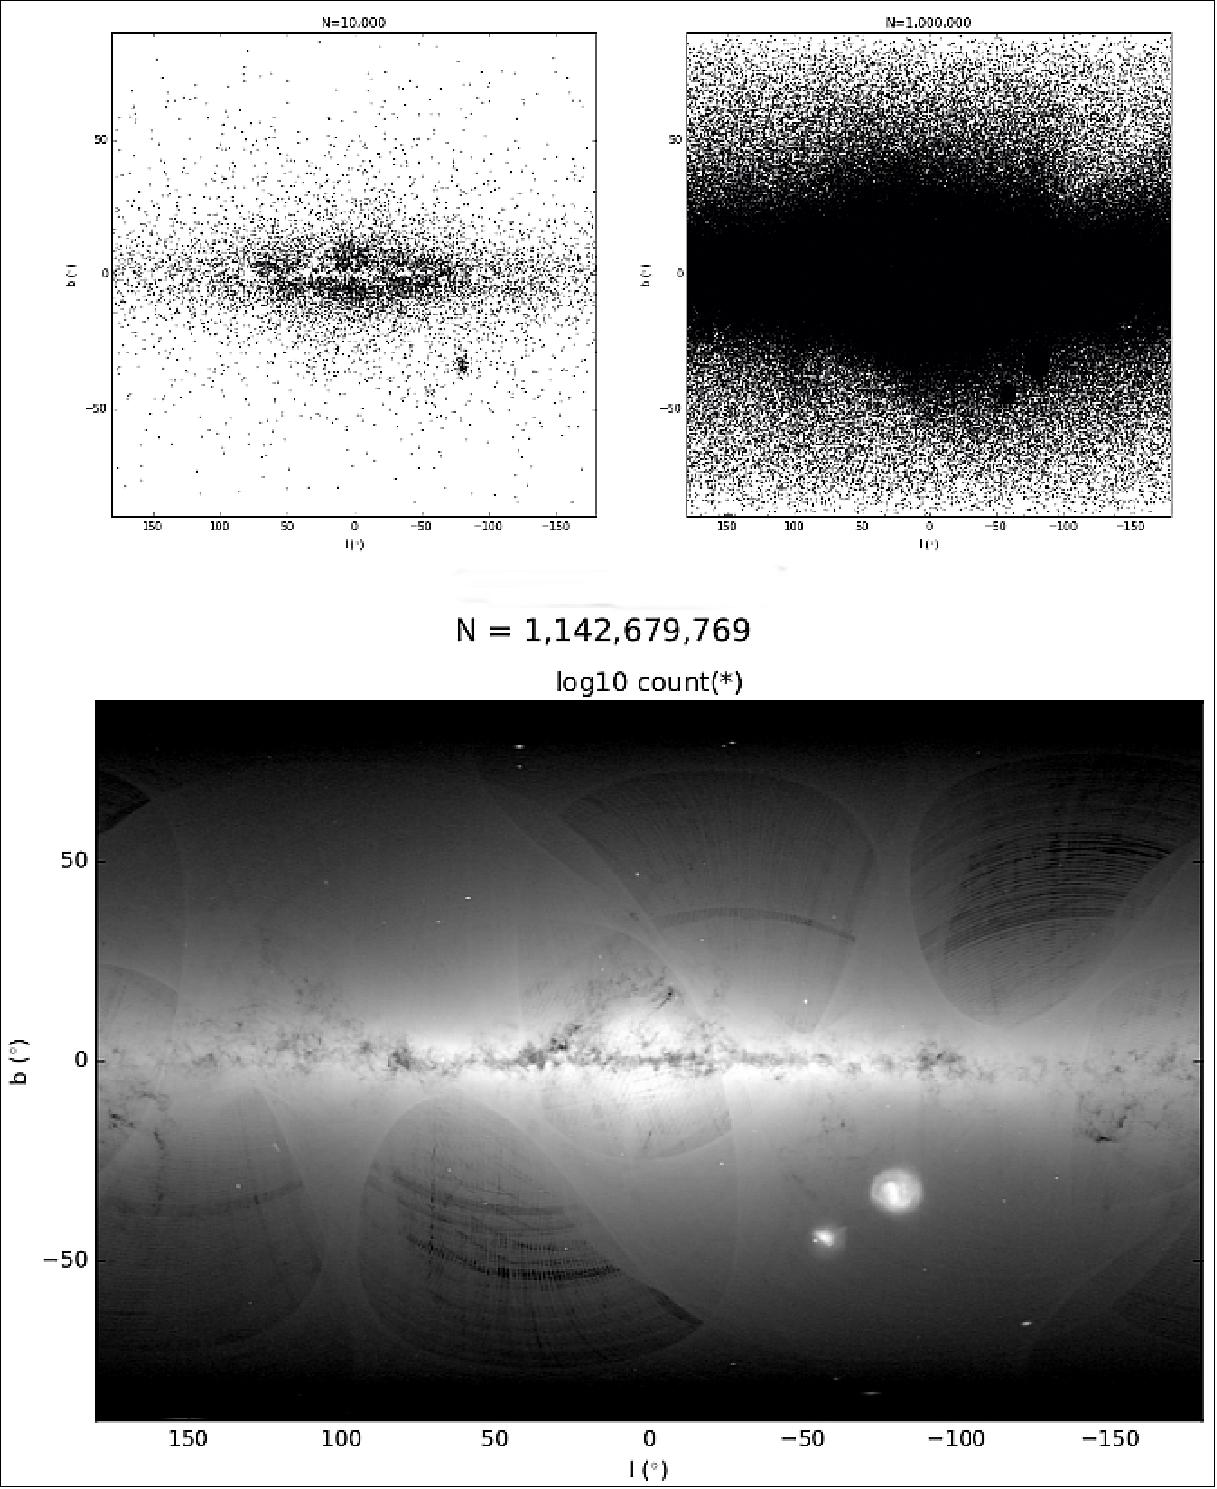
• December 19, 2016: Since the launch of Gaia on 19 December 2013 Gaia performed an impressive number of astrometric, photometric and spectroscopic measurements. More than 60 billion times an object moved through the Gaia focal plane. 89)
• November 10, 2016: ESA's Gaia is surveying stars in our Galaxy and local galactic neighborhood in order to build the most precise 3D map of the Milky Way and answer questions about its structure, origin and evolution. 90)
- Where there are more stars, as in the Galactic center, the map is brighter; where there are fewer, the map is darker. The map includes brightness data corresponding to several million stars.
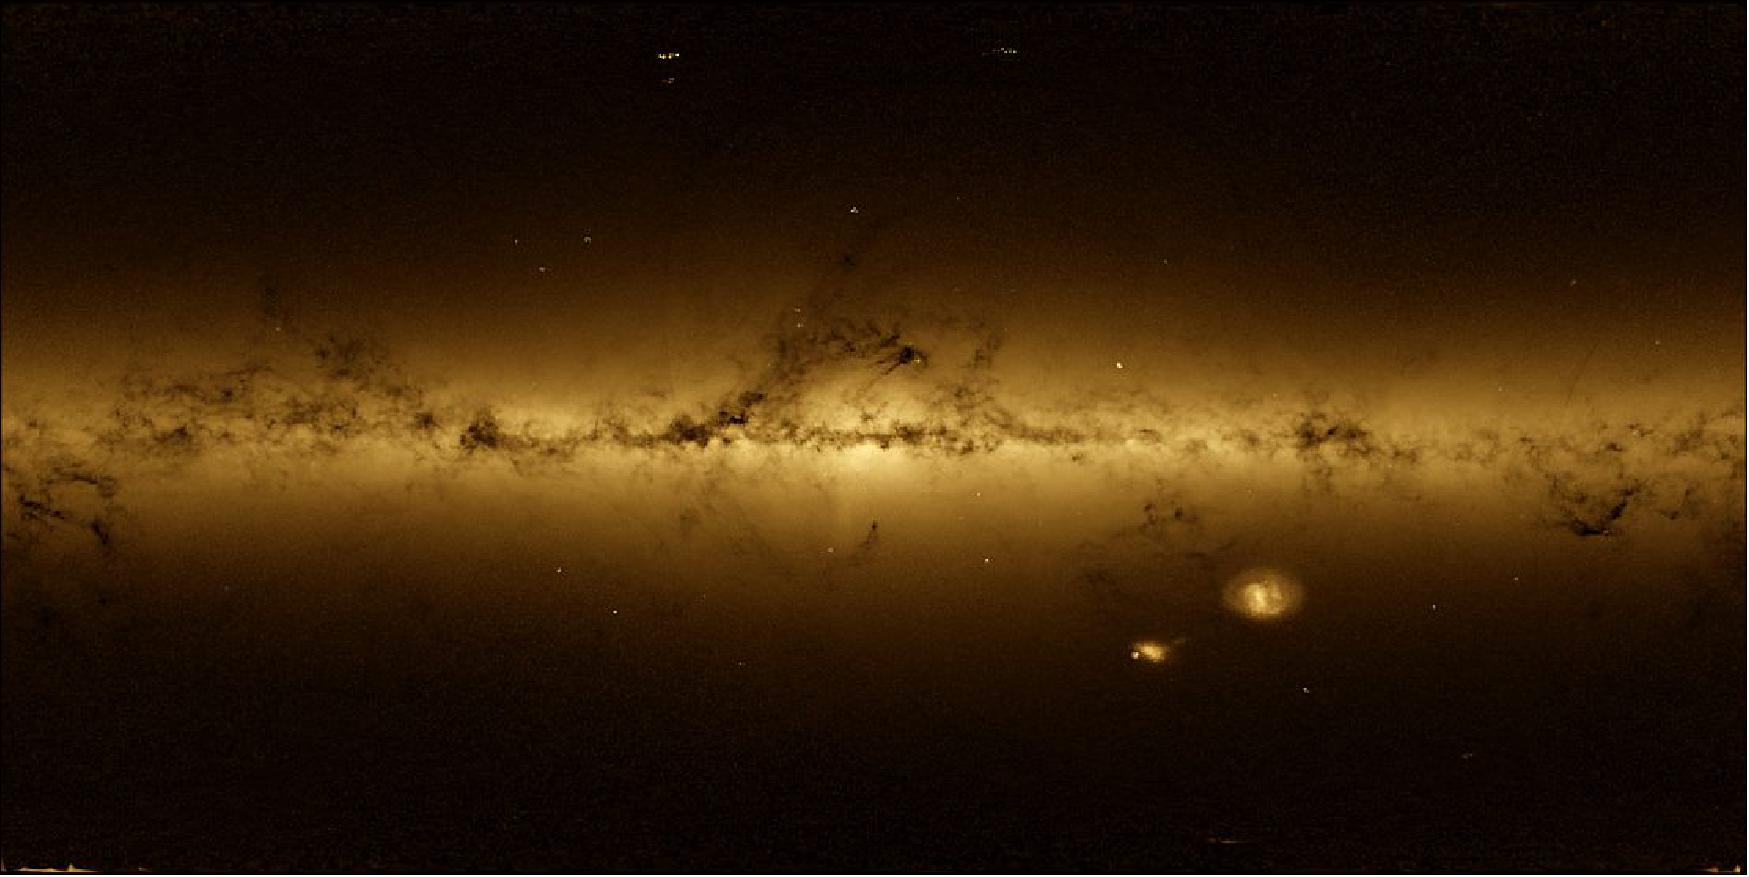
• October 27, 2016: While scanning the sky to measure the position of over one billion stars in our Galaxy, ESA's Gaia satellite has detected two rare instances of stars whose light was temporarily boosted by other celestial objects passing across their lines of sight. One of these stars is expected to brighten again soon. Gaia's measurements will be instrumental to learn more about the nature of these 'cosmic magnifying glasses'. 91)
![Figure 78: Variations of brightness of the star Gaia 16aye caused by a microlensing event, as a massive object passed across its line of sight. The Gaia Photometric Science Alerts Team nicknamed this star Ayers Rock, after the famous landmark in Australia [image credit: ESA/Gaia/DPAC, P. Mroz, L. Wyrzykowski, K. A. Rybicki (Warsaw)]](/api/cms/documents/163813/5389966/Gaia2019_Auto11.jpeg)
- After the initial discovery of this magnitude 14.5 star with Gaia (dark circles), astronomers started observing it with different telescopes on the ground (colored circles), revealing a rather peculiar pattern of brightness variations.
- Instead of a single rise and fall, the star has undergone two consecutive brightness peaks of roughly two magnitudes, then became fainter for a few weeks. It later exhibited a sharp increase to magnitude 12 and rapidly declined again.
- The intricate pattern of variations suggests that the star is not being lensed by a single object but rather by a binary system. The black line shows the expected brightness variation from a microlensing model with a binary lens, which most likely consists of two stars, but might also involve a planet or even a black hole.
• Sept. 14, 2016: An all-sky view of stars in our Galaxy – the Milky Way – and neighboring galaxies, based on the first year of observations from ESA's Gaia satellite, from July 2014 to September 2015.The annotated map (Figure 79) shows the density of stars observed by Gaia in each portion of the sky. Brighter regions indicate denser concentrations of stars, while darker regions correspond to patches of the sky where fewer stars are observed. 92)
- The Milky Way is a spiral galaxy, with most of its stars residing in a disc about 100,000 light-years across and about 1000 light-years thick. This structure is visible in the sky as the Galactic Plane – the brightest portion of this image –which runs horizontally and is especially bright at the center. Darker regions across the Galactic Plane correspond to dense clouds of interstellar gas and dust that absorb starlight along the line of sight.
- Many globular and open clusters – groupings of stars held together by their mutual gravity – are also sprinkled across the image. Globular clusters, large assemblies of hundreds of thousands to millions of old stars, are mainly found in the halo of the Milky Way, a roughly spherical structure with a radius of about 100,000 light-years, and so are visible across the image. Open clusters are smaller assemblies of hundreds to thousands of stars and are found mainly in the Galactic Plane.
- The two bright objects in the lower right of the image are the Large and Small Magellanic Clouds, two dwarf galaxies orbiting the Milky Way. Other nearby galaxies are also visible, most notably Andromeda (also known as M31), the largest galactic neighbor to the Milky Way, in the lower left of the image. Below Andromeda is its satellite, the Triangulum galaxy (M33).
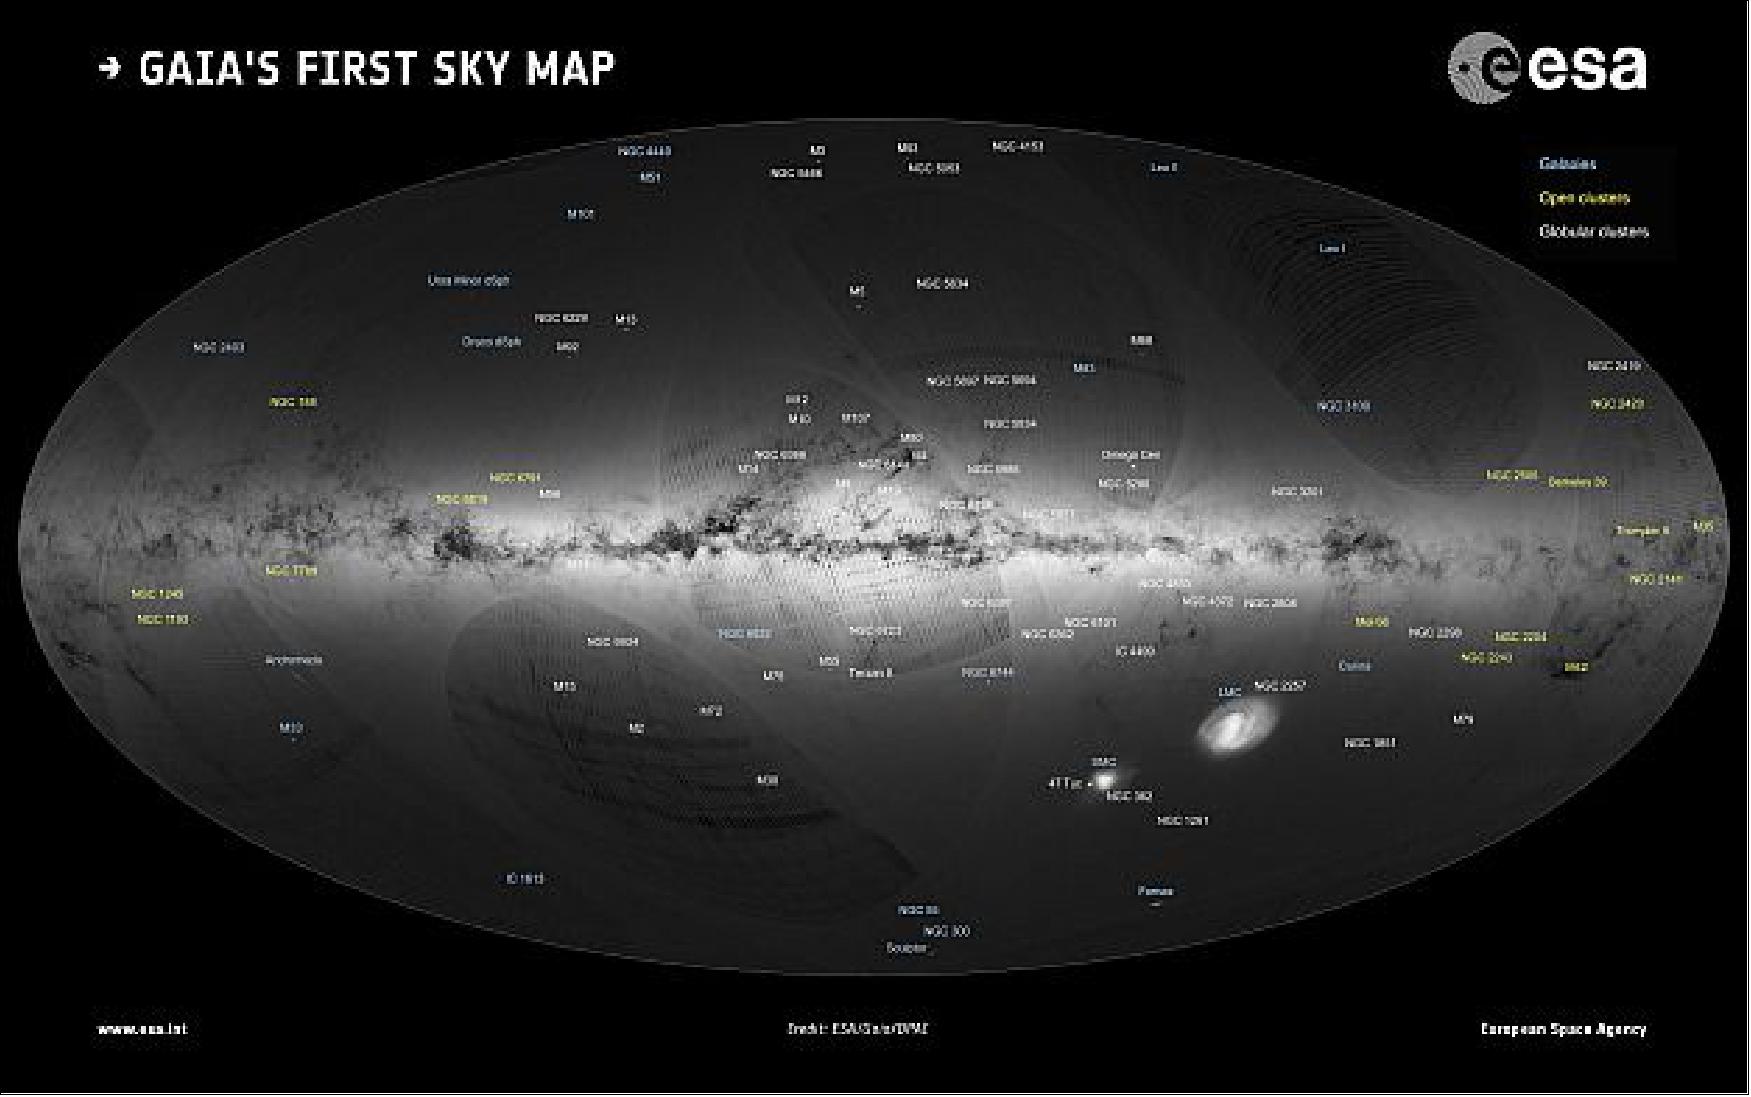
• Sept. 13, 2016: The first catalog of more than a billion stars from ESA's Gaia satellite was published today – the largest all-sky survey of celestial objects to date (Figure 80). 93)
- On its way to assembling the most detailed 3D map ever made of our Milky Way galaxy, Gaia has pinned down the precise position on the sky and the brightness of 1142 million stars. As a taster of the richer catalog to come in the near future, today's release also features the distances and the motions across the sky for more than two million stars.
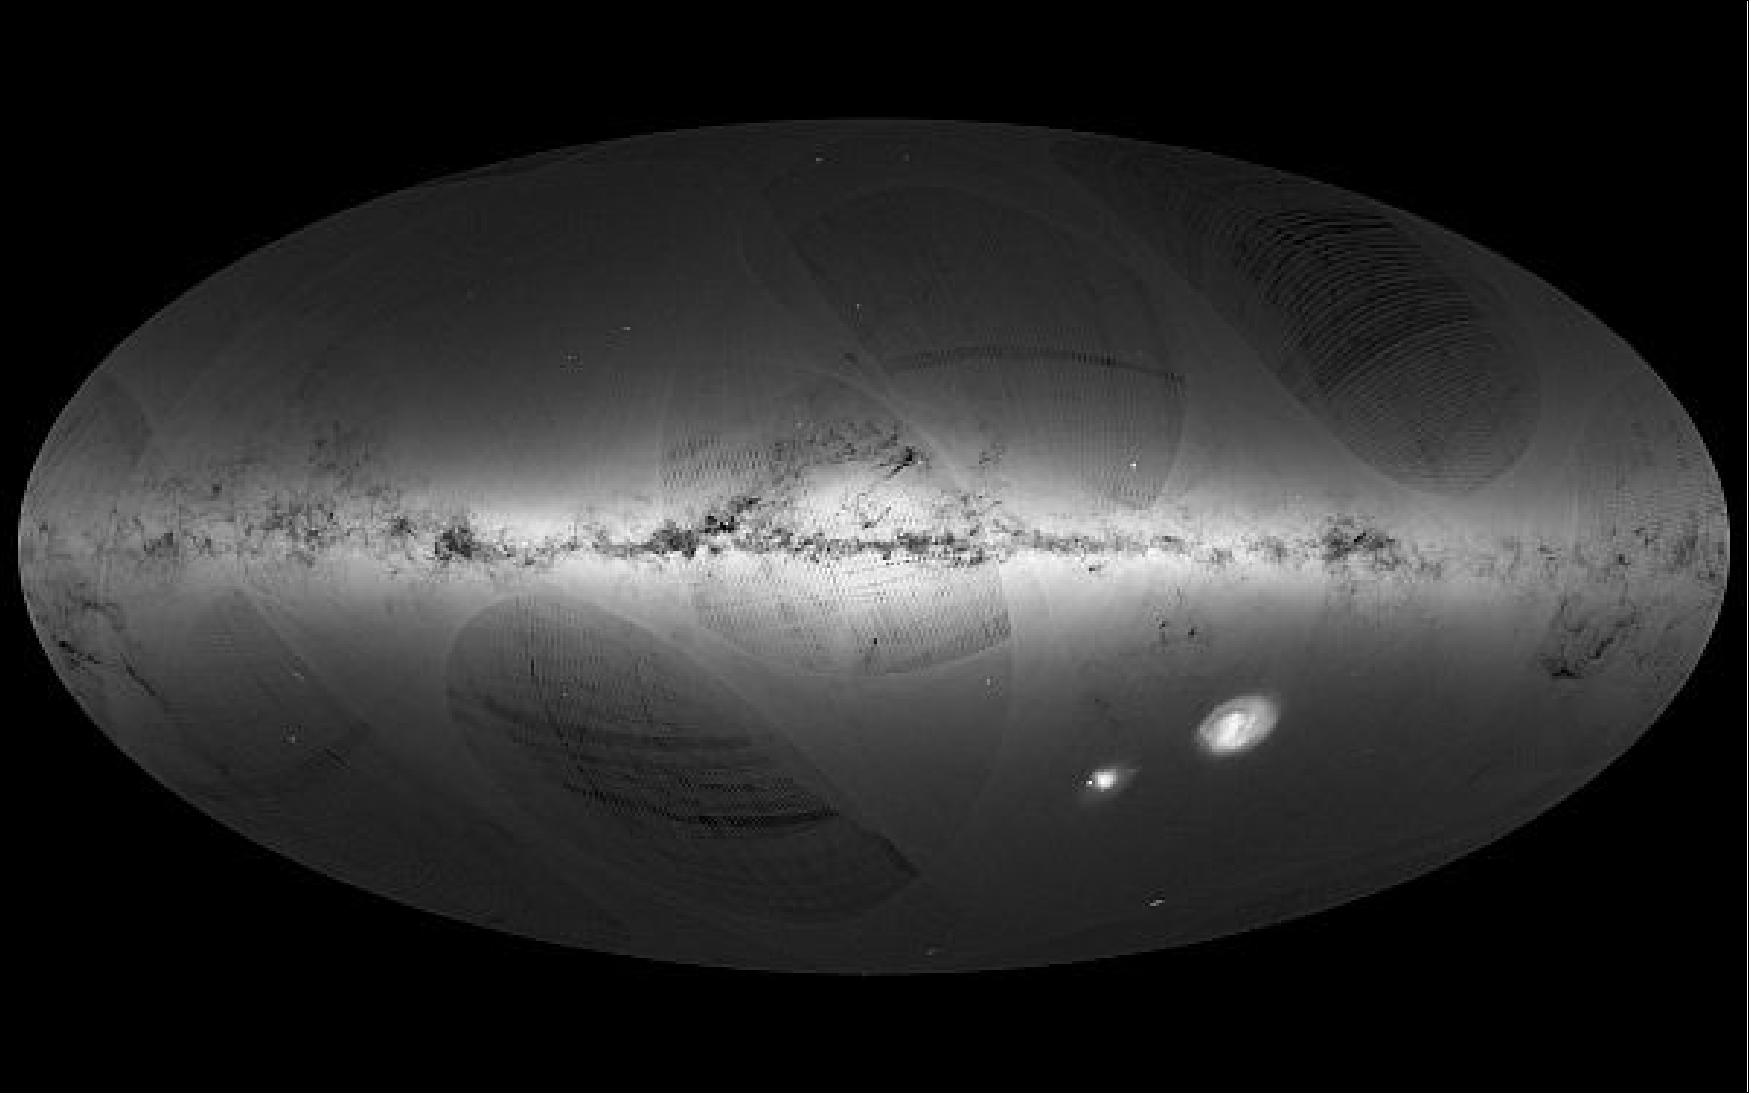
- "Gaia is at the forefront of astrometry, charting the sky at precisions that have never been achieved before," says Alvaro Giménez, ESA's Director of Science. "Today's release gives us a first impression of the extraordinary data that await us and that will revolutionize our understanding of how stars are distributed and move across our Galaxy."
- Launched 1000 days ago, Gaia started its scientific work in July 2014. This first release is based on data collected during its first 14 months of scanning the sky, up to September 2015. "The beautiful map we are publishing today shows the density of stars measured by Gaia across the entire sky, and confirms that it collected superb data during its first year of operations," says Timo Prusti, Gaia project scientist at ESA.
- The stripes and other artefacts in the image reflect how Gaia scans the sky, and will gradually fade as more scans are made during the five-year mission. "The satellite is working well and we have demonstrated that it is possible to handle the analysis of a billion stars. Although the current data are preliminary, we wanted to make them available for the astronomical community to use as soon as possible," adds Timo Prusti.
- Transforming the raw information into useful and reliable stellar positions to a level of accuracy never possible before is an extremely complex procedure, entrusted to a pan-European collaboration of about 450 scientists and software engineers: the Gaia DPAC (Data Processing and Analysis Consortium). "Today's release is the result of a painstaking collaborative work over the past decade," says Anthony Brown from Leiden University in the Netherlands, and consortium chair.
- "Together with experts from a variety of disciplines, we had to prepare ourselves even before the start of observations, then treated the data, packaged them into meaningful astronomical products, and validated their scientific content."
- In addition to processing the full billion-star catalog, the scientists looked in detail at the roughly two million stars in common between Gaia's first year and the earlier Hipparcos and Tycho-2 Catalogs, both derived from ESA's Hipparcos mission, which charted the sky more than two decades ago.
- By combining Gaia data with information from these less precise catalogs, it was possible to start disentangling the effects of 'parallax' and 'proper motion' even from the first year of observations only. Parallax is a small motion in the apparent position of a star caused by Earth's yearly revolution around the Sun and depends on a star's distance from us, while proper motion is due to the physical movement of stars through the Galaxy.
- This new catalog is twice as precise and contains almost 20 times as many stars as the previous definitive reference for astrometry, the Hipparcos Catalog. As part of their work in validating the catalog, DPAC scientists have conducted a study of open stellar clusters – groups of relatively young stars that were born together – that clearly demonstrates the improvement enabled by the new data.
- The data from Gaia's first release can be accessed at http://archives.esac.esa.int/gaia. The content of this first release was presented today during a media briefing at ES/ESAC (European Space Astronomy Center) in Villanueva de la Cañada, Madrid, Spain. Fifteen scientific papers describing the data contained in the release and their validation process will appear in a special issue of Astronomy & Astrophysics.
• August 16, 2016: Operating in the depths of space, far beyond the Moon's orbit, ESA's Gaia spacecraft has now completed two years of a planned five-year survey of the sky. Despite a series of unexpected technical challenges, the mission is on track to complete the most detailed and complex mapping of the heavens ever undertaken. 94)
- Located at the L2 Lagrange point, 1.5 million km from Earth, Gaia surveys the entire sky as it spins on its axis. By repeatedly measuring the positions of the stars with extraordinary accuracy, Gaia is providing a huge treasure trove of data that enables scientists to tease out their distances and motions through our Galaxy.
- "More than 50 billion focal plane transits, 110 billion photometric observations and 9.4 billion spectroscopic observations have been successfully processed to date," notes Fred Jansen, ESA's mission manager for Gaia. The immense volume of data and their complex nature have required a huge effort from the scientists and software developers, distributed across Europe, who make up Gaia's DPAC (Data Processing and Analysis Consortium). The first product of their efforts will be a public data release scheduled for 14 September.
- "The spacecraft is working well and the data processing is on the right track," says Timo Prusti, ESA's project scientist for Gaia. "Most of the spacecraft systems that are crucial for the success of our mission have behaved as well as, or even better than, expected. "These include the focal plane assembly, onboard data handling system, onboard detection of sources, the phased array antenna, and the attitude control and micro-propulsion subsystems."
- Nevertheless, the first two years of Gaia operations have not been without their challenges. A few largely unforeseen problems have occurred, requiring detailed, ongoing investigations by teams from ESA, industry and the DPAC.
- One problem detected early in the commissioning phase was associated with water freezing on some parts of the optics, causing a reduction in the sensitivity of the telescopes. The mission team expected some water to be trapped in the spacecraft before launch, followed by freezing once the spacecraft reached orbit and started to outgas. Gaia's mirrors were already equipped with heaters to take care of this. However, the amount of ice was much more than expected and the ice deposits survived the heating procedure that took place early in the mission.
- A second complication is caused by stray light infiltrating into Gaia's focal plane at a level higher than predicted before launch. Light from very bright stars and the Milky Way is reflected onto the focal plane, but the more serious stray light is coming from sunlight being scattered by minute fibers around the edge of the insulating blanket that covers Gaia's 10 m diameter sunshield.
- "This results in higher background 'noise' in the data," explains Prusti. "This is irrelevant for observations of brighter stars, but more significant for fainter stars. We can still easily detect stars of magnitude 20, but the stray light means that we can pinpoint locations of faint stars to an accuracy of 500 µs instead of the planned 300 µs. However, it is important to stress that, despite this 'noise', Gaia is still the most accurate star mapper ever built."
- Another surprise is a series of minor mechanical vibrations which Timo Prusti dubs 'micro-clanks'. "Thermal expansion and contraction effects are seen on all spacecraft, which results in so-called 'clanks'," he says. "The mechanical changes on Gaia are much smaller than normal, and the only reason we can detect them is because its attitude control system is so sensitive. "We have discovered that the micro-clanks cause minute structural changes within the spacecraft which lead to tiny discontinuities in the rotation angle of the spacecraft. They result in small inaccuracies in the timing and positions of the stars as they pass across Gaia's array of CCDs. - "However, we are not too worried about this because we can see when it is happening and we know how to fix it. New software will be implemented next year to remove the effect from the data."
- A similar effect is caused by micrometeorites, specks of space dust that strike the spacecraft at high speed. However, this environmental hazard was well understood and predicted before launch. "Fairly large impacts may occur a few times each month," says Jansen. "If they change the spacecraft's rotation rate by more than 10 milliarcseconds per second, they can adversely affect the science data, but such events are rare and their impact on the overall science data return is very small."
- Finally, the Gaia team has been analyzing data from a laser device called the 'basic angle monitor'. The instrument is designed to measure, with an extremely high level of accuracy, any variations in the angle of separation between Gaia's two telescopes. This is necessary in order to correct for expected periodic variations in the separation angle caused by thermal changes in the payload as Gaia spins. — Knowing this basic angle to an accuracy of 0.5 microarcseconds every 15 minutes is crucial in order to achieve absolute global astrometry – mapping of stellar positions - and it is an essential requirement in the data analysis process. However, during commissioning, it was noted that the basic angle fluctuates periodically, at a level more than 100 times greater than expected. Careful investigation has concluded that the variation is probably caused by thermal expansion and contraction resulting from some solar heat reaching the payload via the service module.
- "Although the mission has experienced a number of technical challenges, all of these have either been mitigated by additional software and analysis, or the mitigating mechanism is known and tested but full implementation is pending," says Jansen. "Overall, through the extensive efforts of ESA, DPAC, and prime contractor Airbus Defence and Space, these effects have had a limited impact on our ability to achieve the mission's original science objectives." — "We are confident that we shall still be able to analyze more than one billion stars, measuring each star's position and motion up to 100 times more accurately than Gaia's predecessor Hipparcos," says Prusti.

• July 4, 2016: ESA's billion-star surveyor Gaia, launched on 19 December 2013, and in routine science operations since 25 July 2014, will release the first mission data on 14 September 2016. 95)
- Gaia is designed to map more than 1 billion stars in our Galaxy, and to provide positions, parallaxes and proper motions at an unprecedented accuracy level, far below a milliarcsecond. These accuracies can only be achieved after a complex data processing that requires observations taken throughout the 5-year nominal mission. For this reason, the final Gaia results will not be available until the early 2020s, but a number of early releases have been foreseen, based on increasingly longer stretches of observations.
- The first Gaia data release, which will be available online on 14 September, will include the positions and G magnitude for about one billion stars using observations taken between 25 July 2014 and 16 September 2015.
- In addition, for a subset of data – about 2 million stars in common between the Tycho-2 Catalog and Gaia – there will be a five-parameter astrometric solution, giving the positions, parallaxes, and proper motions for those objects. This is referred to as the TGAS ( Tycho-Gaia Astrometric Solution).
- Photometric data for RR Lyrae and Cepheid variable stars that were observed frequently during a special scanning mode that repeatedly covered the ecliptic poles will also be made public.
• May 2016: Automation is being gradually introduced into the Gaia mission in a stepwise fashion. - After commissioning and the first full sky survey it was seen that Gaia's Science return could be increased. This involved a significant increase of data volume (circa 45%) to be downlinked (due to various factors, but mainly since Gaia is able to observe stars fainter than the original magnitude 20 limit). In order to downlink this data in an efficient manner, a stepwise approach has been implemented involving taking unmanned ground station passes to downlink this extra science data. A simple solution using open loop automation was quickly implemented, and this has gradually been improved over time adding robustness and closed loop functionality. Gaia is also the first ESOC mission to use the new infrastructure closed loop automation software ‘MATIS'. 96)
- Early in the routine phase it became clear that Gaia was performing so well that the pre-launch data downlink estimates used to plan the ground station time were insufficient. A number of factors were at work, but the primary factor was that Gaia can reach fainter magnitudes than required. In order to recover this valuable extra science data, the ESOC FCT (Flight Control Team) quickly investigated the possibility of obtaining extra ground station time for the mission through ESA's 35 m network. Extra ground station time was possible but the increase in expected data was more than could be handled by the existing Spacecraft Controller team through shift work (i.e. the concept was for a single pass of ca. 8 hours with one human operator per day, with some extra shifts during galactic plane scans that occur approximately 20% of the time). Updated data estimates showed an increase of approximately 45%, which required two passes every day, with three passes during galactic plane scans.
- The operations concept was reviewed and a solution found that would allow all the data to be downlinked without increasing the team size. This concept, termed open loop ground automation, involved taking passes without human operators present via pre-planned science downlink operations. One pass per day is maintained with a human operator in control, with an additional pass dedicated purely to science downlink executed without an operator present. Science data is downlinked to the ground station and forwarded to ESOC automatically, via preprogrammed commanding sent from the mission control system to the ground stations (to enable the dedicated ground communication links for science data), and commanding executed from the spacecraft onboard timeline (to enable the transmission of science data on the spacelink).
- Although this system works well, there is increased risk of science data loss on the spacelink in comparison to a concept fully reliant on human operators, who have the possibility to intervene (e.g. by stopping the science downlink on-board in case of problems on the ground station downlink chain, or weather degrading the space to ground downlink). To mitigate this risk, an OBCP (On Board Control Procedure) was developed and activated onboard. This protects the Science downlink by only allowing it to continue in the presence of a good uplink carrier signal detected at spacecraft level from the ground station, i.e. if the uplink level is good at the spacecraft then generally the downlink level at the ground station is also good.
- This open loop automation concept was successfully validated and implemented in Q4 2014, becoming fully operational by November 2014 (ca. one month after the decision to investigate ways to increase ground station time was taken). Since then Science data return has been boosted by approximately 45%.
• March 7, 2016: While scanning the sky to measure the position and velocity of a billion stars, ESA's Gaia satellite also records many 'guest stars' – astronomical sources that, for a short period of time, are much brighter than usual. Some of these transient objects are stars undergoing major outburst events that suddenly boost their brightness, while others are supernovae, the powerful explosions at the end of a star's life. Among these detections, it is also possible to find entire galaxies, which might occasionally become brighter due to bursts of light caused by the accreting activity of the supermassive black holes at their core. 97)
- To further understand the physical properties of these transient sources, it is crucial to observe them for a longer period of time after the first detection. For this reason, the Gaia DPAC (Data Processing and Analysis Consortium) includes a team of scientists that are responsible of scrutinizing the data daily to look for unusual sources.
- Whenever they identify a transient object, the Gaia Science Alert Team, based at the Institute of Astronomy in Cambridge, UK, announces the detection to the astronomical community so that other scientists can follow up on the source with other telescopes, on Earth and in space.
- The team started to issue science alerts in September 2014, shortly after the beginning of the mission's routine scientific operations. However, the Science Alert Team was very soon overwhelmed with the number of potential transient sources, up to a million per day, which had to be heavily filtered to distinguish real guest stars from contaminants in the data stream. This data overload was due to the fact that, at the time, scientists in DPAC were still getting themselves acquainted with the complex nature of the observations performed by Gaia and the huge amount of information they contain.
- So, after about ten months and almost three hundred science alerts issued, publication of the alerts was paused for six months, in the second half of 2015. During this time, the Science Alert Team implemented a number of upgrades in the filtering and detection algorithms that are used to find transients. Eventually, the improved pipeline was switched on again in January 2016.
- The new filtering algorithm is now tuned to mask out very dense regions of the sky, especially towards the most crowded areas along the plane of our Galaxy, the Milky Way, where the false alarm rate is still too high. By combining this mask with an improved treatment of the Gaia data, the team managed to reduce the rate of potential transients from almost one million to a few hundreds per day.
- It still takes a lot of human work to identify the actual transient – about four per day – in the total number of candidate sources, but it is definitely more manageable.
- The team is looking forward to further improving the detection algorithms, and predictions suggest they might eventually find about ten transients per day. Many of these sources are being followed up on by observational programs in both the northern and southern hemispheres.
• November 3, 2015: A local cosmic celebrity was recently pictured among the multitude of stars and Solar System bodies surveyed by ESA's Gaia satellite: Comet 67P/Churyumov–Gerasimenko, currently accompanied by another ESA spacecraft, Rosetta. 98)
- While scanning the sky to map the positions and motions of a billion stars in our Galaxy, Gaia also picks up objects much closer to home, such as asteroids and comets in the Solar System. With its ability to detect faint and moving objects, Gaia has already identified tens of thousands of asteroids since routine science operations began in July 2014, and these data will be used to determine their orbits to unprecedented accuracy.
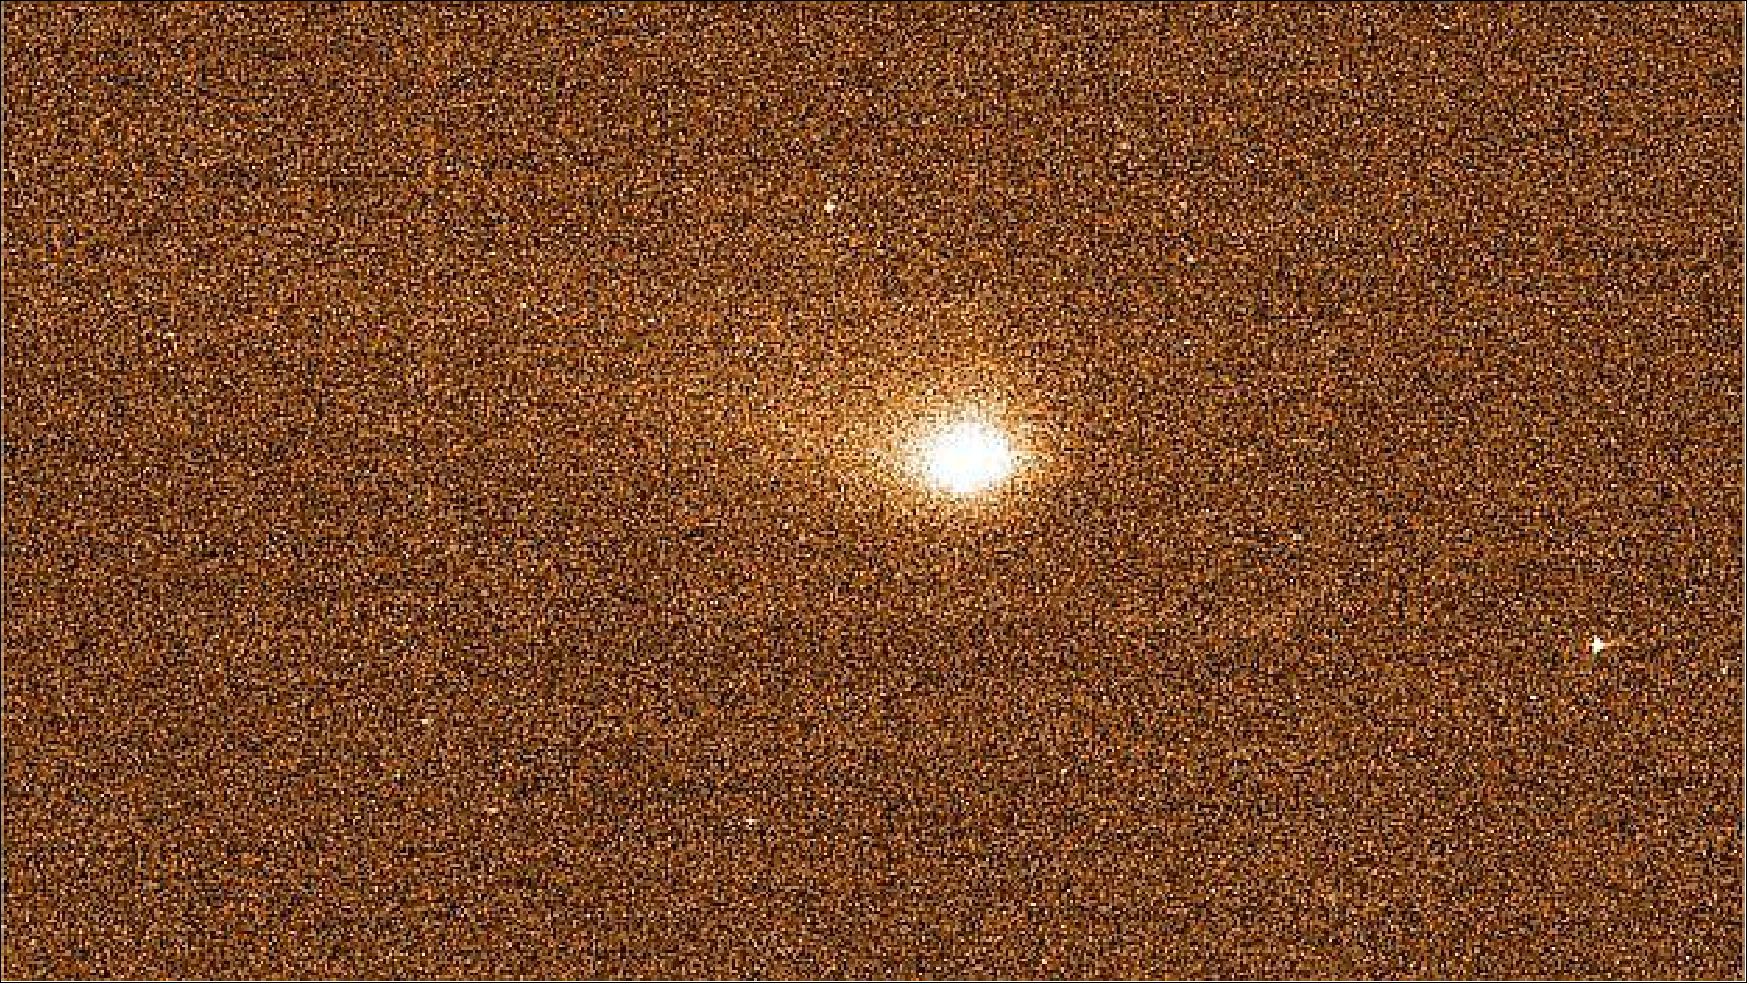
Legend to Figure 82: The image shows the comet's coma and tail. The nucleus and Rosetta, which was some 300 km from the surface at the time, are both hidden in the innermost pixel. A number of background stars are also sprinkled around the image, which measures about 4.5 arcminutes across – about one-seventh of the Moon's diameter. — While this image of Rosetta's comet has mainly a symbolic value – an ESA mission, 1.5 million km from Earth, looking at a fellow science mission and its object of study, both located over 260 million km away – scientific data were also collected during this observation. In fact, besides the special observing mode used to obtain the image, the comet was also caught by the onboard detection software as a ‘suspected moving object'. Over the three-second observation, it appeared to move by some 100 km with respect to the background stars, as seen from a distance of 260 million km.
Over its five-year mission, Gaia will observe hundreds of comets and repeatedly measure their positions to unprecedented accuracy. These data will allow scientists to improve the orbit determination of many comets well beyond the precision that can be achieved with ground-based observations alone. They will also use Gaia's observations to investigate their composition and surface properties.
Flight Operations Experience from Gaia's first 1.5 years (Oct. 2015). 99)
1) Telescope contamination by water ice: Almost immediately after the L2 insertion maneuver and upon first operation of the telescope, it was noticed that the laser light level from the BAM (Basic Angle Monitor) was dropping (the BAM contains a laser interferometer that precisely measures the basic angle between the two fields of view). In parallel, the expected magnitude of the imaged stars was checked and the same effect seen (ruling out a laser problem). It was soon understood that the root cause was water ice sublimating onto the optical surfaces. Experts at Airbus DS, SOC (Science Operations Center) and DPAC (Data Processing and Analysis Consortium) could narrow down the problem to specific mirrors in the payload and targeted re-activation of decontamination heaters (primarily around mirror M2) was able to completely clear the problem.
- The impact of ice contaminated mirrors is two-fold. Firstly the apparent magnitude of the imaged stars gradually falls, which eventually means that the faintestend stars drop below the onboard magnitude limit and fail to be recorded and downlinked. Secondly, if left over longer time scales, the point spread function is eventually degraded. For the first problem a magnitude buffer was included onboard to allow fainter stars (than magnitude 20) to also be downlinked. This was possible due to the excellent performance of the telescope and FPA that could be used below the required magnitude limit of 20.
- After this targeted decontamination had cleared the problem a full decontamination was again performed part way through the commissioning, since the ice contamination was seen to be returning and also to rule out any connection with the Straylight problem. This procedure was seen to successfully clear the contamination problem and confirmed no link to the Straylight phenomena. The effect of ice build up and decontaminating recovery operations can be seen in Figure 83, which covers the initial operations.
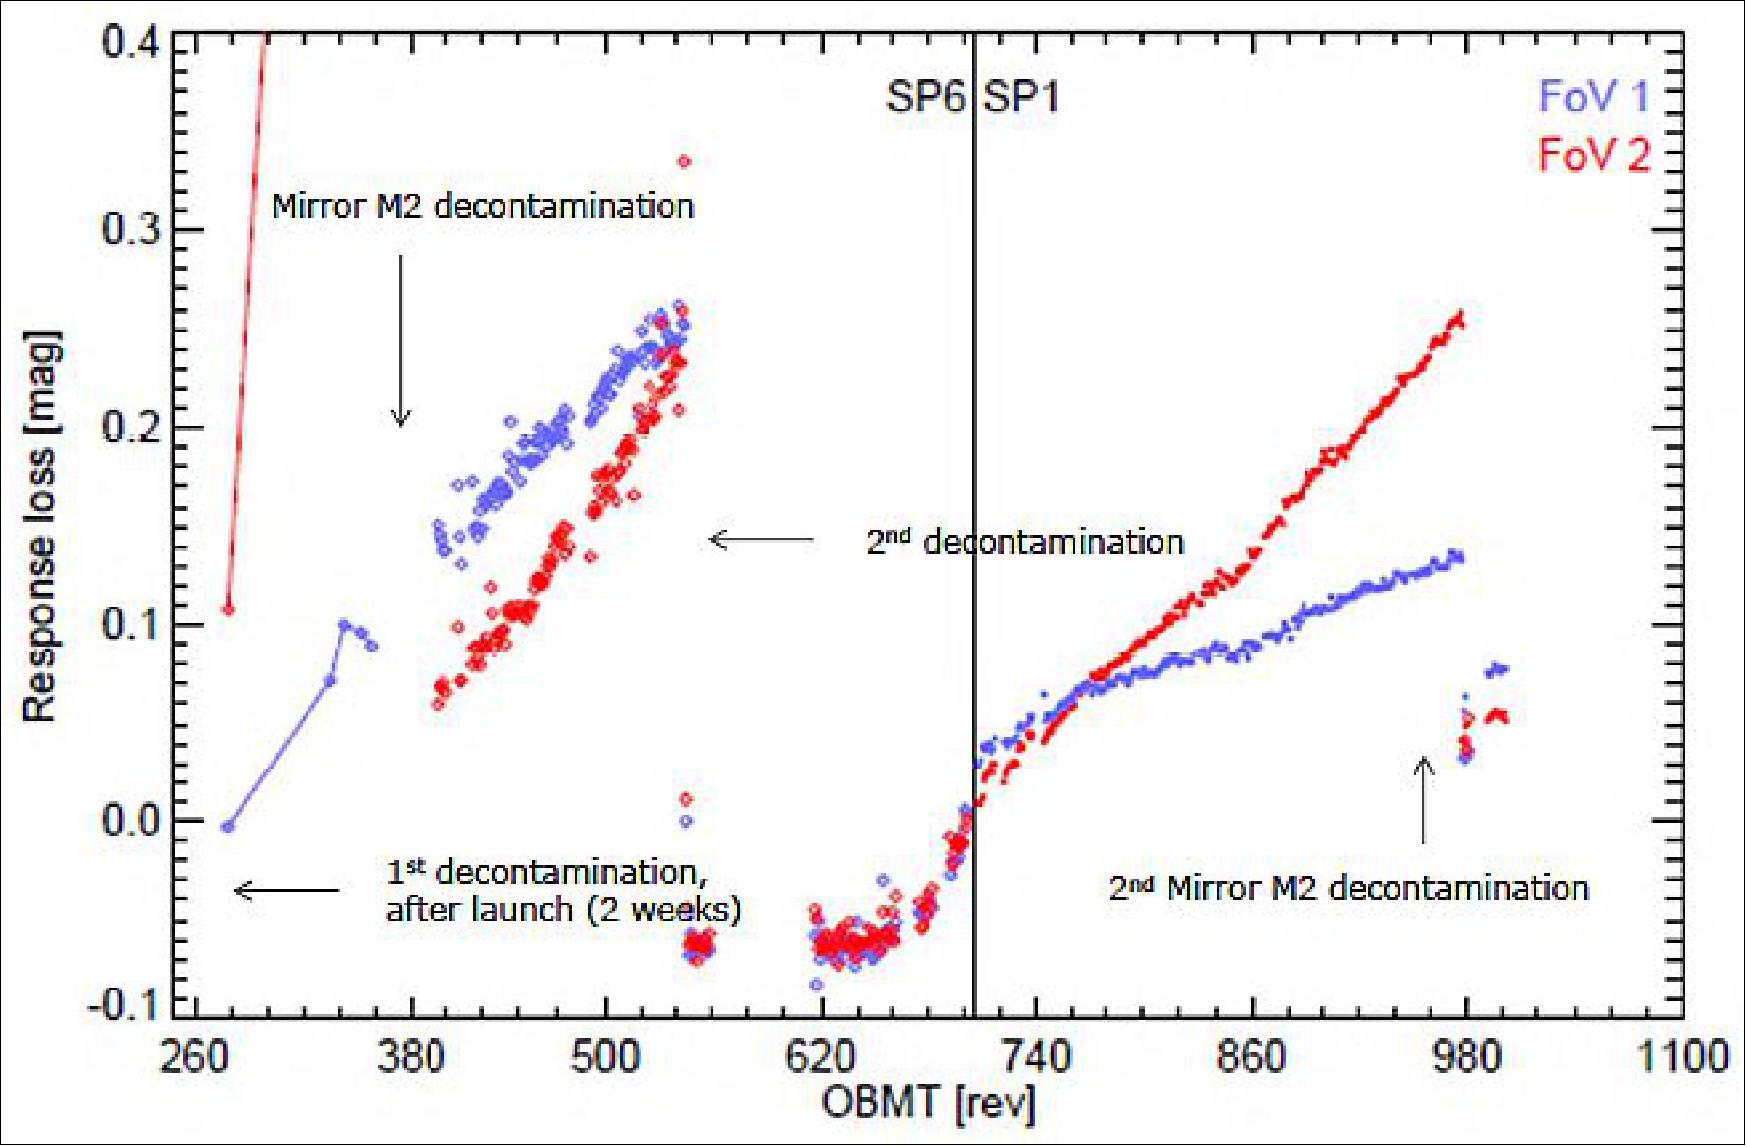
- The decontamination operations impact science due to the thermal disturbance and subsequent settling time required. Hysteresis implies that small mirror refocus operations may also need to be performed. These procedures have been optimized over time (to minimize science impact) and repeated three additional times in flight. Whilst the ice contamination has returned periodically, the rate at which it returns has dramatically reduced and the time between required decontamination operations has been increasing. The last decontamination was performed in June 2015, and since this time there has been no discernible return of the ice.
2) Telescope straylight: Also noticed early in the telescope commissioning, was an excess of straylight in particular parts of the FPA that varied with the spacecraft rotation phase. This data alone was not sufficient to disentangle the origin of the straylight (e.g. from diffracted sunlight or particular bright stellar/solar system objects), so it was decided to run two dedicated in-flight tests. In these tests, the spacecraft was reprogrammed to operate away from the nominal SAA (Sun Aspect Angle) of 45º (see Figure NO TAG#); with one test performed at 42º and one at 0º. Note that these attitudes could not be used for science due to the impact on end performance, but were purely for gathering engineering diagnostics. Additionally, operating at these non-nominal attitudes necessitated dedicated procedures to be developed and executed to perform various service module programming [e.g. the PAA (Phased Array Antenna) could not be used from this attitude].
- These tests were successful in that they unambiguously demonstrated the solar origin of the straylight, since it was dramatically reduced when operating at SAA= 0º.
- The Straylight and contamination problems occurred contemporaneously. At the time it was thought the two problems could be linked and that an ice layer may have formed on the inner tent roof, creating a bright surface that boosted straylight onto the FPA. This was disproved via the inflight full decontamination performed in commissioning (see above) and also via ground laboratory tests, which showed that thin ice layers on the roof would not be able increase straylight in line with the in-flight measurements.
- A working group was setup to investigate this issue and subsequently concluded that the extra straylight was caused by fibers protruding beyond the edge of the sunshield, which boosted diffracted light from the sun. - With the straylight understood and characterized, work commenced on developing a new onboard software version for the 7 VPUs (Video Processing Units). This new software contained updates from the commissioning phase, including functionality to mitigate the effect of straylight. This new software version was developed at Airbus DS during the second half of 2014 and delivered to ESOC Q1 2015. After validation campaign and coordination with the SOC/DPAC science segment, the new software was activated onboard and has been operational since April 2015.
3) Gaia's Big Data and Open Loop Ground Automation: With the commissioning successfully completed and recoveries and updates being worked on or in place, the routine phase of the mission started in June 2014. After an initial scanning law period where EPSL (Ecliptic Pole Scanning Law) was used, the nominal scan law was activated in September 2014. Since then the Gaia mission has been steadily acquiring the huge dataset required for the mapping products.
- Early in the routine phase it became clear that Gaia was performing so well that the pre-launch data downlink estimates used to plan the ground station time were insufficient. A number of factors were at work, but the primary factor was that Gaia can reach fainter magnitudes than required.
- In order to recover this valuable extra science data, the ESOC/FCT ( Flight Control Team) quickly investigated the possibility of obtaining extra ground station time for the mission through ESA's 35 m network. Extra ground station time was possible but the increase in expected data was more than could be handled by the existing Spacecraft Controller team through shift work (i.e. the concept was for a single pass with human operator per day, with some extra shifts during galactic plane scans that occur approximately 20% of the time). Updated data estimates showed an increase by around 45%, which required 2 passes every day, with three passes during galactic plane scans.
- The operations concept was reviewed and a solution found that would allow all the data to be downlinked without increasing the team size. This concept, termed open loop ground automation, involved taking passes without human operators present via pre-planned science downlink operations. One pass per day is maintained with a human operator in control, with an additional pass dedicated purely to science downlink executed without an operator present. Science data is downlinked to the ground station and forwarded to ESOC automatically, via pre-programmed commanding sent from the mission control system to the ground stations and commanding executed from the spacecraft onboard timeline.
- Although this system works well, there is increased risk of science data loss on the downlink in comparison to a concept fully reliant on human operators who have the possibility to intervene (e.g. by stopping the science downlink in case of problems on the ground station downlink chain or weather degrading the space to ground downlink). To mitigate this risk an OBCP (On Board Control Procedure) was developed and implemented onboard. This protects the science downlink by only allowing the downlink to continue in the presence of a good uplink carrier signal detected at spacecraft level from the ground station.
- This open loop automation concept was successfully validated and implemented in Q4 2014. Becoming fully operational by November 2014. Since then, science data return has been boosted by approximately 45%.
4) Outlook: After a successful commissioning campaign the Gaia mission is performing well and on course to deliver the expected dataset for the fields of Astrometry and Astronomy as a whole. The first map releases are planned for the summer of 2016. This time is required due to the enormous data processing task that is underway at SOC and DPAC and the necessity to obtain a minimum number of transits per star (Ref. 99).
• On August 21, 2015, ESA's billion-star surveyor, Gaia, completed its first year of science observations in its main survey mode. 100)
- After launch on 19 December 2013 and a six-month long in-orbit commissioning period, the satellite started routine scientific operations on 25 July 2014. Located at the Lagrange point L2, 1.5 million km from Earth, Gaia surveys stars and many other astronomical objects as it spins, observing circular swathes of the sky. By repeatedly measuring the positions of the stars with extraordinary accuracy, Gaia can tease out their distances and motions through the Milky Way galaxy.
- For the first 28 days, Gaia operated in a special scanning mode that sampled great circles on the sky, but always including the ecliptic poles. This meant that the satellite observed the stars in those regions many times, providing an invaluable database for Gaia's initial calibration.
- At the end of that phase, on 21 August 2014, Gaia commenced its main survey operation, employing a scanning law designed to achieve the best possible coverage of the whole sky.
- Since the start of its routine phase, the satellite recorded 272 billion positional or astrometric measurements 54.4 billion brightness or photometric data points, and 5.4 billion spectra.
- The Gaia team has spent a busy year processing and analyzing these data, en route towards the development of Gaia's main scientific products, consisting of enormous public catalogues of the positions, distances, motions and other properties of more than a billion stars. Because of the immense volumes of data and their complex nature, this requires a huge effort from expert scientists and software developers distributed across Europe, combined in Gaia's DPAC (Data Processing and Analysis Consortium).
- "The past twelve months have been very intense, but we are getting to grips with the data, and are looking forward to the next four years of nominal operations," says Timo Prusti, Gaia project scientist at ESA. "We are just a year away from Gaia's first scheduled data release, an intermediate catalogue planned for the summer of 2016. With the first year of data in our hands, we are now halfway to this milestone, and we're able to present a few preliminary snapshots to show that the spacecraft is working well and that the data processing is on the right track."
- As one example of the ongoing validation, the Gaia team has been able to measure the parallax for an initial sample of two million stars.
- The nearer a star is to the Sun, the larger its parallax, and thus the parallax measured for a star can be used to determine its distance. In turn, the distance can be used to convert the apparent brightness of the star into its true brightness or ‘absolute luminosity'. Astronomers plot the absolute luminosities of stars against their temperatures – which are estimated from the stars' colors – to generate a ‘Hertzsprung-Russell diagram', named for the two early 20th century scientists who recognized that such a diagram could be used as a tool to understand stellar evolution.
- The graph of Figure 84 shows the absolute luminosity of almost one million stars observed by Gaia as a function of their color. The diagram is based on a combination of data from Gaia's first year of observations and earlier data from ground-and space-based telescopes. Gaia has made an average of roughly 14 measurements of each star on the sky thus far, but this is generally not enough to disentangle the parallax and proper motions. To overcome this, the scientists have combined Gaia data with positions extracted from the Tycho-2 catalog, based on data taken between 1989 and 1993 by Gaia's predecessor, the Hipparcos satellite.
- The luminosity measurements are based on data from Hipparcos and ground-based telescopes, and the color information comes also from ground-based observations. This preliminary diagram provides a taste of what the mission will deliver in the coming years. Later it will be possible to compile a ‘Hertzsprung-Russell diagram' based on the Gaia data alone.
- The data points appear to populate some characteristic regions of the diagram, with most of them distributed along the diagonal running from the top left corner to the bottom right: this is called the main sequence of stars, identifying all stars that are burning hydrogen in their cores – a phase that takes up the majority of a star's lifetime. Along the main sequence, brighter and more massive stars are located towards the top left of the diagram, whereas stars with lower masses and brightnesses are found towards the lower right.
- The large clump of data points in the right half of the graph identifies red giant stars: these are evolved stars that have exhausted hydrogen in their cores. As their cores collapse under their own weight, the outer layers of these stars inflate, creating large and cool – thus red – envelopes.
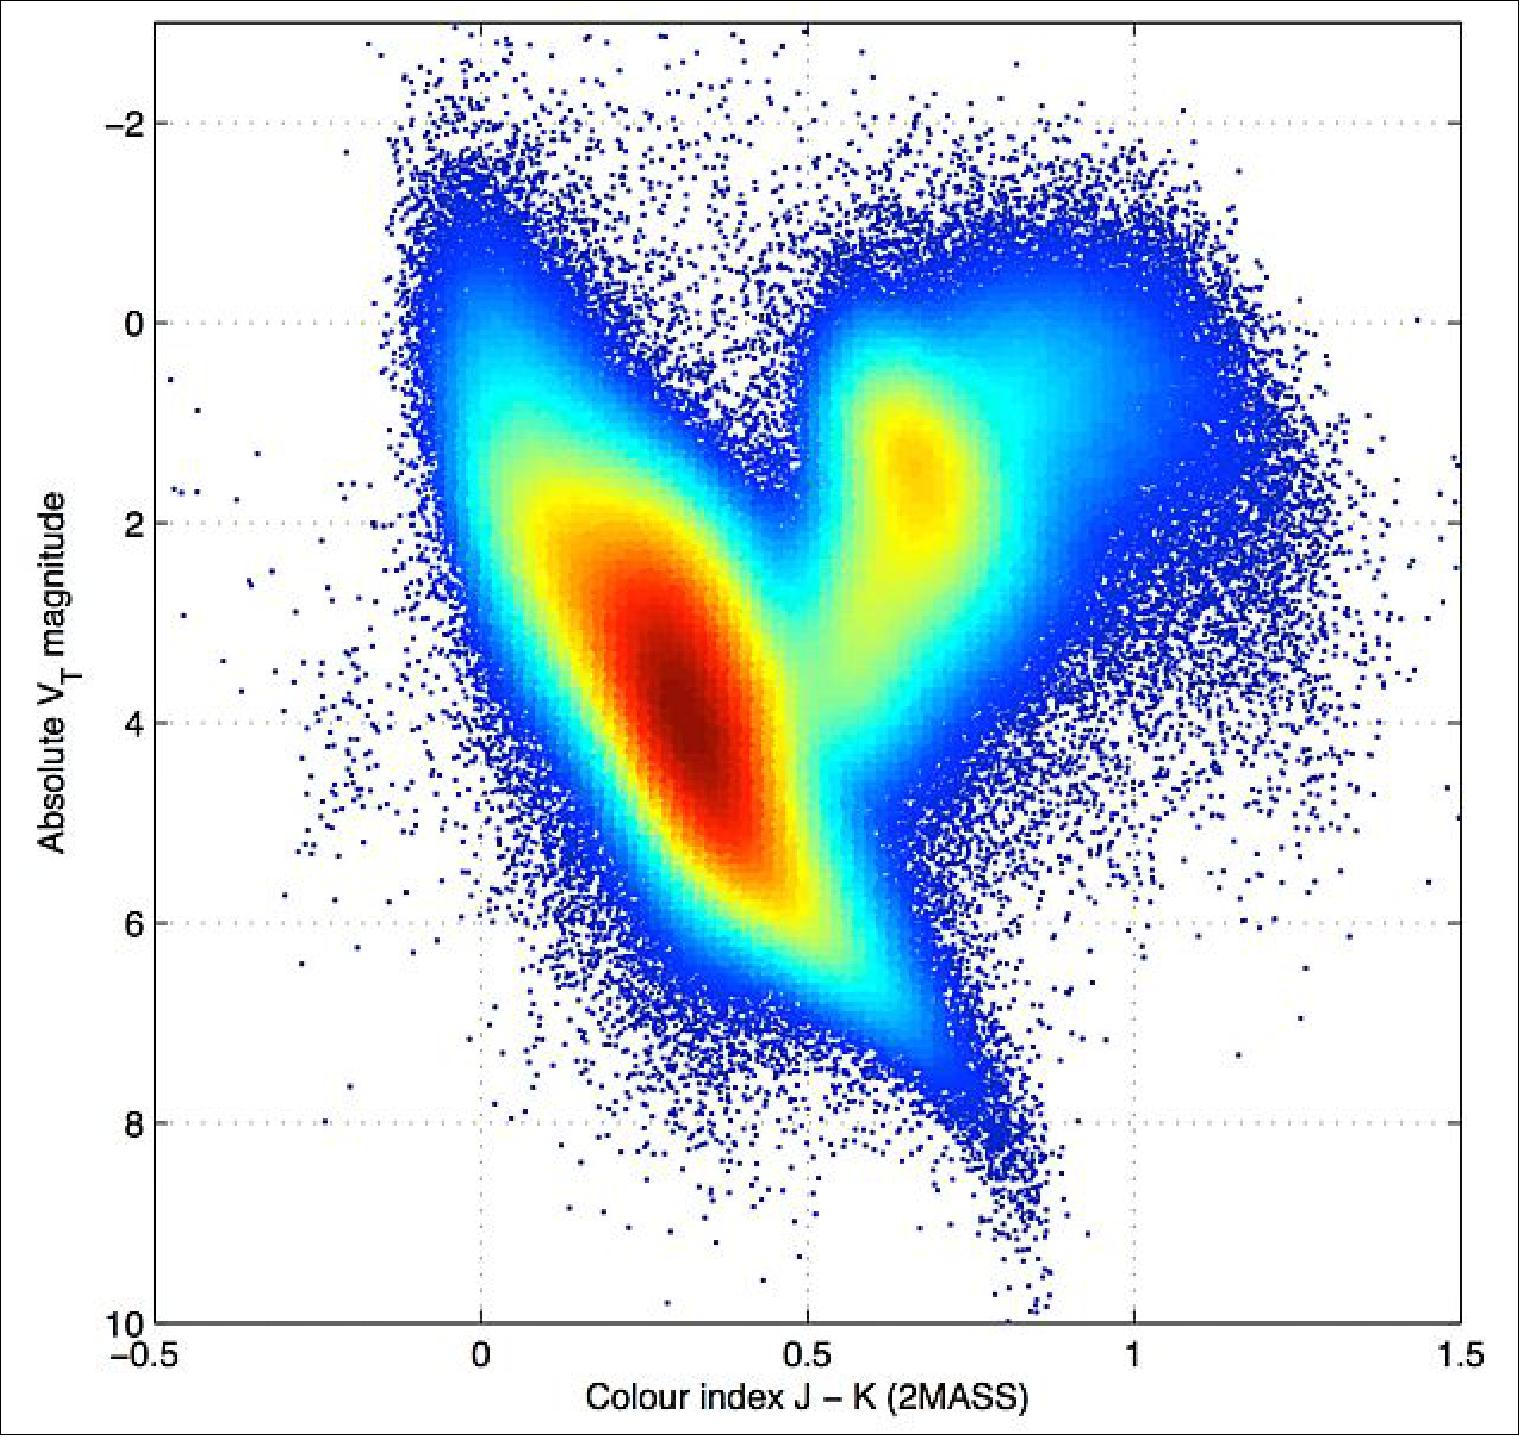
• July 3, 2015: The image of Figure 85, based on housekeeping data from ESA's Gaia satellite, is no ordinary depiction of the heavens. While the image portrays the outline of our Galaxy, the Milky Way, and of its neighboring Magellanic Clouds, it was obtained in a rather unusual way. 101)
- As Gaia scans the sky to measure positions and velocities of a billion stars with unprecedented accuracy, for some stars it also determines their speed across the camera's sensor. This information is used in real time by the attitude and orbit control system to ensure the satellite's orientation is maintained with the desired precision. These speed statistics are routinely sent to Earth, along with the science data, in the form of housekeeping data. They include the total number of stars, used in the attitude-control loop, that is detected every second in each of Gaia's fields of view.
- It is the latter – which is basically an indication of the density of stars across the sky – that was used to produce this uncommon visualization of the celestial sphere. Brighter regions indicate higher concentrations of stars, while darker regions correspond to patches of the sky where fewer stars are observed.
- A few globular clusters – large assemblies up to millions of stars held together by their mutual gravity – are also sprinkled around the Galactic Plane. Globular clusters, the oldest population of stars in the Galaxy, sit mainly in a spherical halo extending up to 100 ,000 light-years from the center of the Milky Way.
- The globular cluster NGC 104 is easily visible in the image, to the immediate left of the Small Magellanic Cloud. Other globular clusters are highlighted in an annotated version of this image (Figure 86).
- Interestingly, the majority of bright stars that are visible to the naked eye and that form the familiar constellations of the sky are not accounted for in this image because they are too bright to be used by Gaia's control system. Similarly, the Andromeda galaxy – the largest galactic neighbor of the Milky Way – also does not stand out here.
- Counterintuitively, while Gaia carries a billion-pixel camera, it is not a mission aimed at imaging the sky: it is making the largest, most precise 3D map of our Galaxy, providing a crucial tool for studying the formation and evolution of the Milky Way.
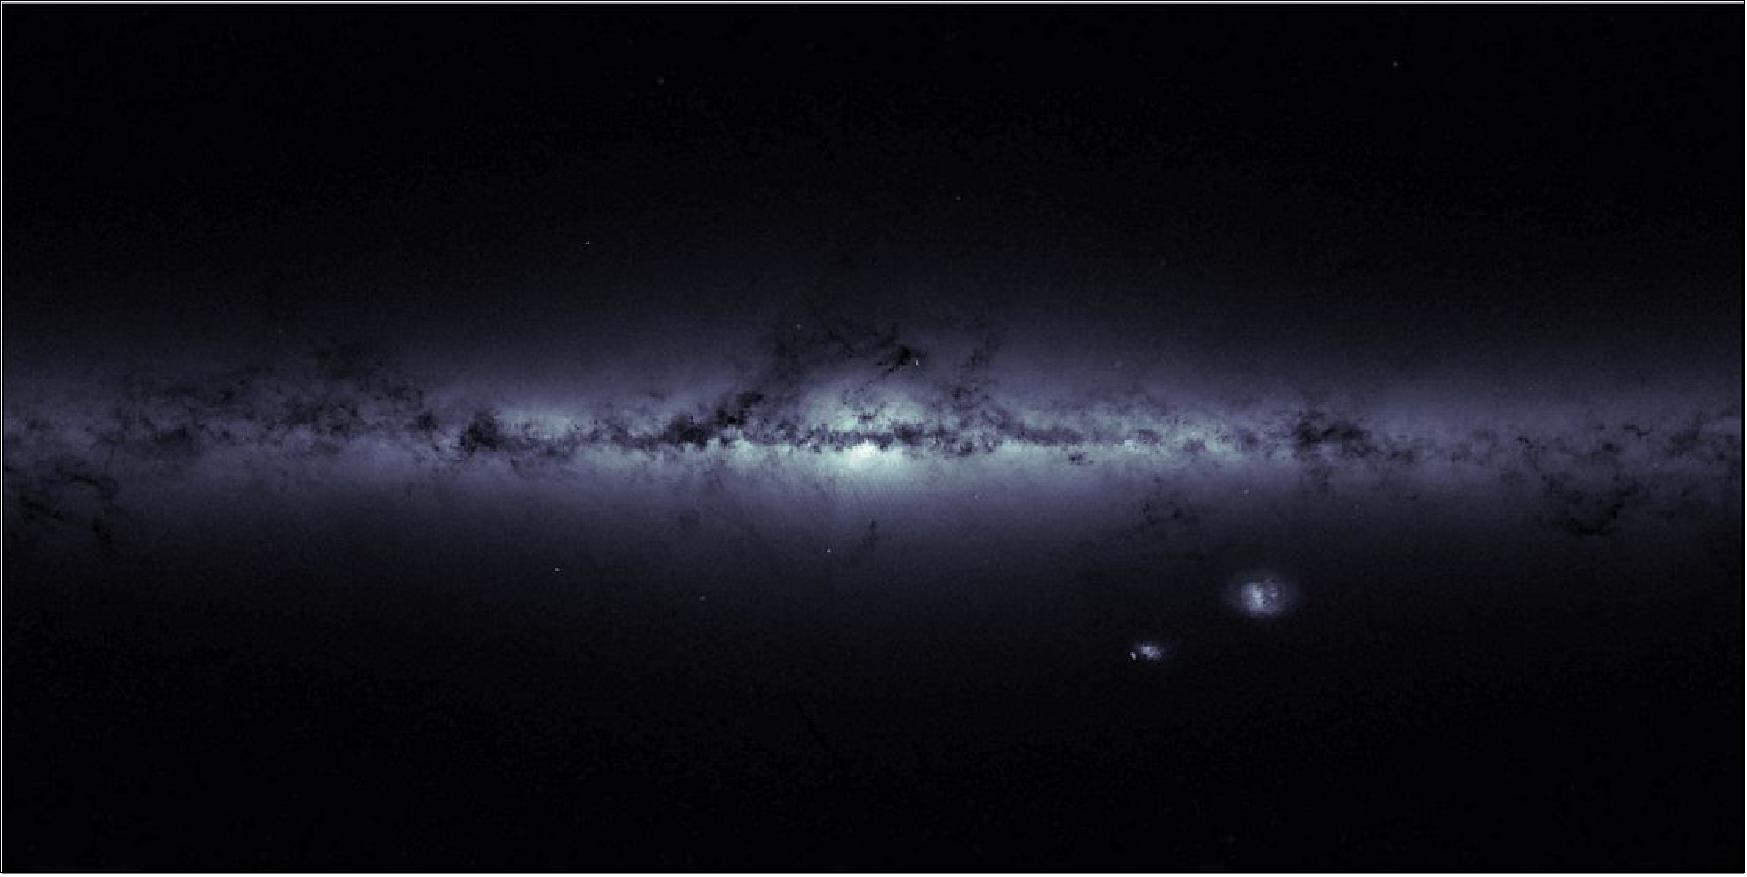
Legend to Figure 85: The outline of our Galaxy, the Milky Way, and of its neighboring Magellanic Clouds, in an image based on housekeeping data from ESA's Gaia satellite, indicating the total number of stars detected every second in each of the satellite's fields of view. The brighter regions indicate higher concentrations of stars, while darker regions correspond to patches of the sky where fewer stars are observed.
- The plane of the Milky Way, where most of the Galaxy's stars reside, is evidently the brightest portion of this image, running horizontally and especially bright at the center. Darker regions across this broad strip of stars, known as the Galactic Plane, correspond to dense, interstellar clouds of gas and dust that absorb starlight along the line of sight.
- The Galactic Plane is the projection on the sky of the Galactic disc, a flattened structure with a diameter of about 100, 000 light-years and a vertical height of only 1000 light-years. Beyond the plane, only a few objects are visible, most notably the Large and Small Magellanic Clouds, two dwarf galaxies orbiting the Milky Way, which stand out in the lower right part of the image. A few globular clusters – large assemblies up to millions of stars held together by their mutual gravity – are also sprinkled around the Galactic Plane.
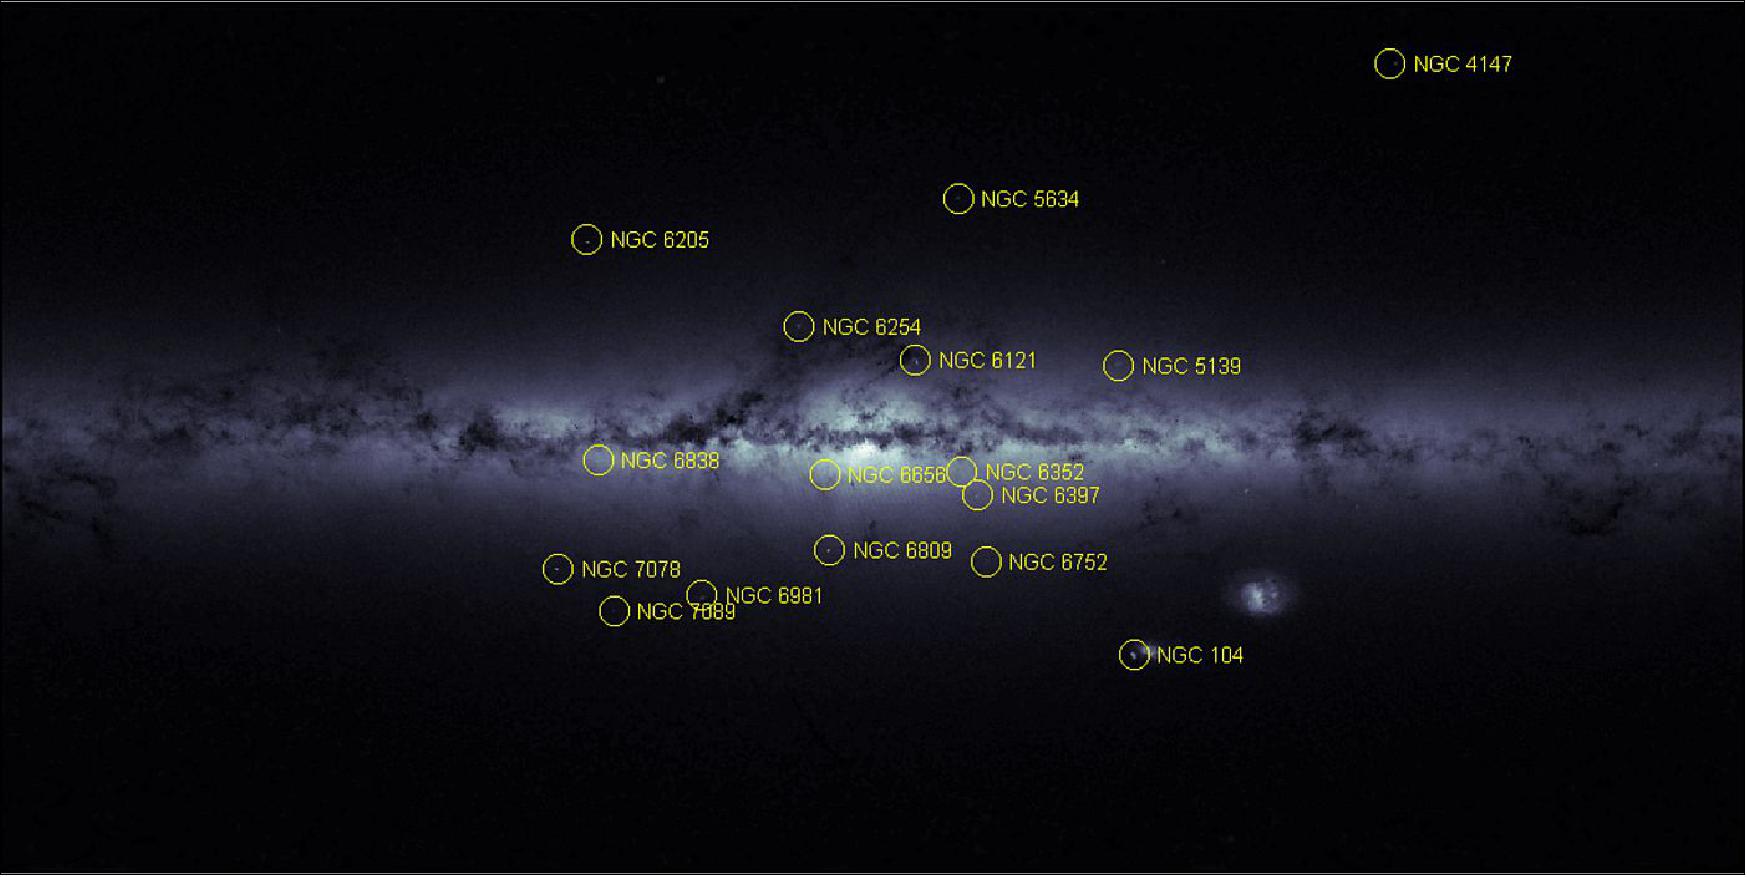
• June 30, 2015: A full-size working model of Gaia's internal systems arrived at ESA/ESOC in Darmstadt this week. The Avionics Model is mounted in a circular setup (~4 m in diameter) representing the systems on the actual satellite, now orbiting the Sun–Earth Lagrangian point L2 . With this model, the ESA flight control specialists responsible for Gaia now have access to a fully functional test bench of the inner workings of the billion-star surveyor. 102)
- The model will remain at ESOC for the rest of the mission, with the team trained to use and maintain it with the support of Airbus Defence and Space, Toulouse, the prime contractor during Gaia's development.
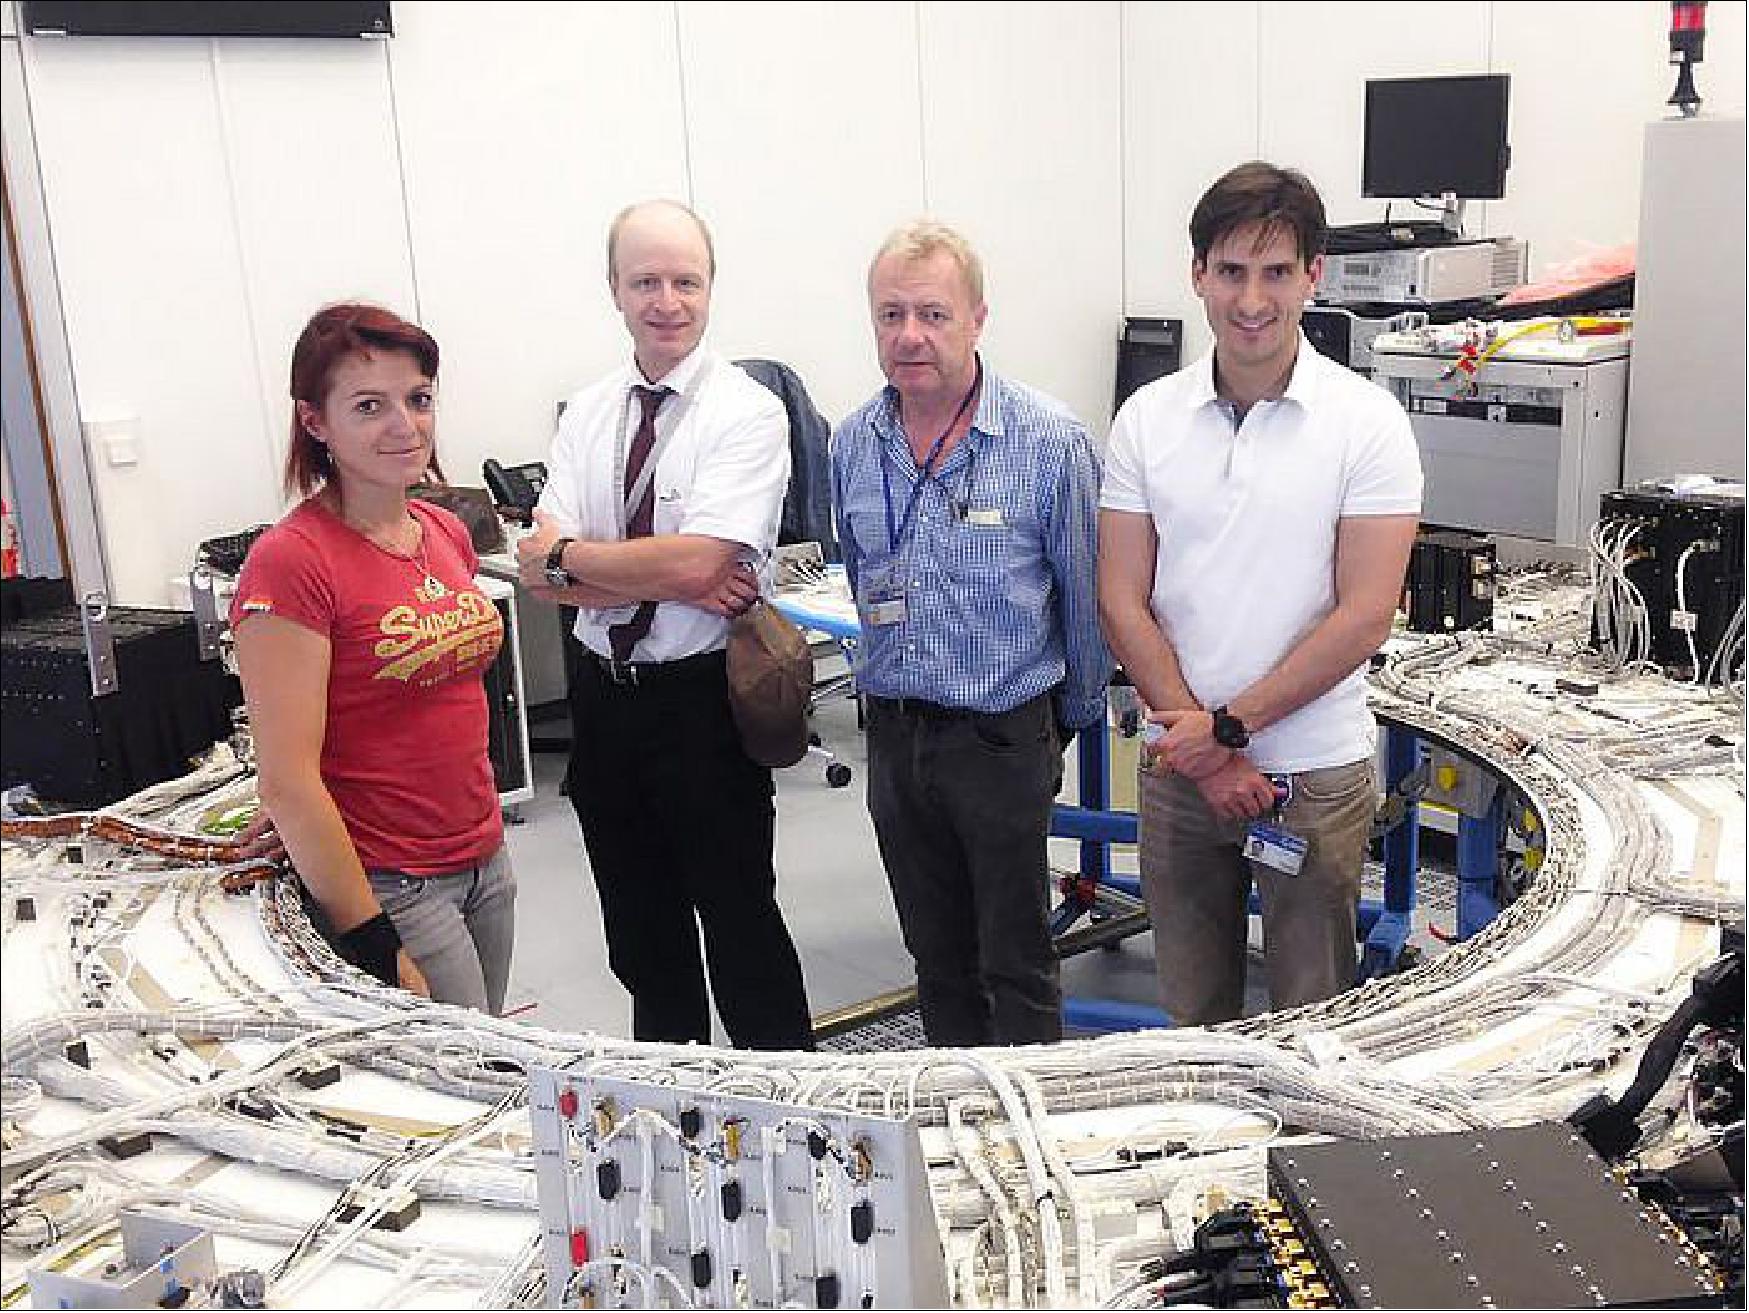
• April 15, 2015: Using telescopes on Earth, Gaia's GBOT (Ground Based Optical Tracking) campaign has been delivering daily datasets, which are used to determine the satellite's position, since launch. Making use of data that are generated for its primary purpose, the tracking of Gaia, the campaign has now found an additional science application: the detection of asteroids. Using the astrometric pipeline, several tens of known and unknown asteroids are being detected every night. 103) 104)
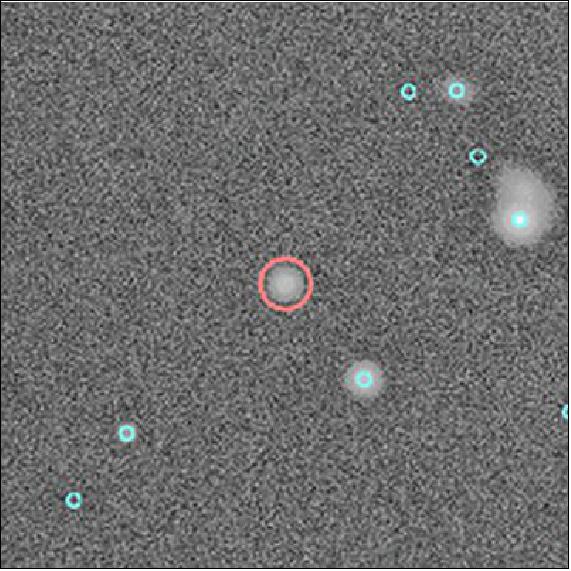
• April 9, 2015: 2015 is the International Year of Light and marks an important milestone in the history of physics with the one-hundredth anniversary of Einstein's Theory of General Relativity. Having the ability to test some of its aspects to an unprecedented accuracy, Gaia will probe the tiny deviations predicted by General Relativity in our solar system. However, the satellite will also see other evidence at work such as gravitational lensing shown in the images of the so-called Einstein Cross, discovered in 1985 (Q2237+030), and of a very similar one (HE0435-1223), discovered in 2002. 105)
- Gravitational lensing was postulated by Einstein as a consequence of light bending in a gravitational field, although it was not seen until 1979 with the observation of two identical quasars, the Twin Quasars, located in the same direction with the same redshift.
- The two images of Figure 89 show the individual measurements of two outstanding instances of gravitational lensing, each with four lensed images of a distant quasar. The data have been collected by the Gaia astrometric detector over the last few months and have been processed with the nominal pipeline, without paying particular attention to the peculiarities of the sources. In both cases, the four images, closely packed in a square of less than two arcsec side, have been recorded as four independent sources at every passage of the system in the Gaia FOVs (Fields of View). The core of the foreground galaxy is also seen near the center of the Einstein Cross and was measured as if it were a star, while it was not detected in HE0435-1223. However, we know that since the on-board detection was done successfully, more data has been sent to the ground and small field images are available, but have not yet been analyzed.
- In both systems, the distant light source is a quasar, a very compact galaxy located at a distance of about 10 billion light years (z=1.7) while the lensing galaxy is much closer to us, but still several 100 Mpc (Megaparsec) away. The quasar, the galaxy and the observer are almost perfectly aligned (within 50 marcsec), causing the quasar light ray to pass through the galactic bulge that bends the rays, eventually producing the four images when reaching the Earth.
- Using the coordinates of the quasars, the orbit of Gaia and the nominal attitude, it was possible to predict accurately (within 0.5 s) the crossing times through the Gaia FOVs and then locate the relevant observations among the 40 million similar observations acquired by Gaia on an average day. The Initial Data Treatment developed by a DPAC team in Barcelona (and run at ESAC) produces every day a very preliminary, and crude for Gaia standards, astrometry and photometry of all the sources detected on-board. These are the positions plotted in the images with the corresponding HST images in the background. The magnitudes of the individual images range from 17 to 19. As we can see, the repeated observations collected over several months are very consistent and a straight combination yields already an absolute position of each image with an accuracy of about 50 marcsec for the Einstein Cross and better for the second source. This will improve when more data are received and with the global astrometric solution and the final spacecraft attitude. By the end of 2015 there will be 9 new observations of Q2237+030 and 16 for HE0435-1223.
- This early inspection of Gaia data proves that the on-board detector performs very well and can distinguish individual faint point sources within a second of arc of each other and carry out independent measurements at nominal accuracy.
- It is expected that Gaia will observe most of the about 100 known multi-imaged lenses and discover more around known and newly discovered quasars. All the images of these sources will be combined and systematically screened over an area of a few arcseconds square to detect further small images, possibly too faint to be seen in Gaia's standard acquisition mode.
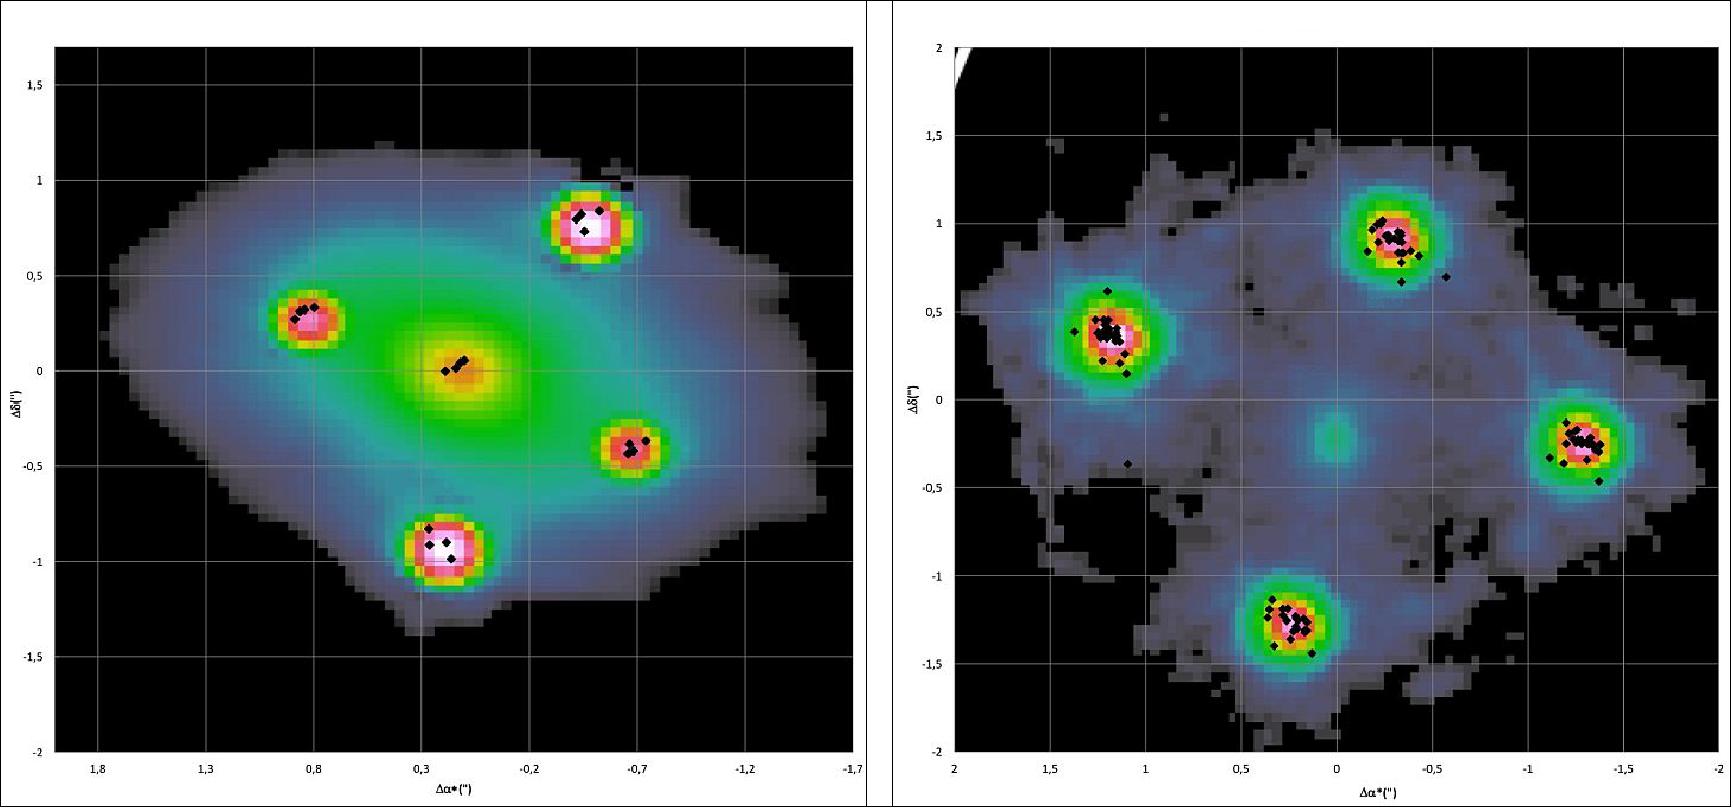
Legend to Figure 89: Gaia's on-board system was able to detect four images of the distant quasar in both cases and the intervening lens at the middle of the Einstein Cross. The positions are supplied by the Gaia Initial Data Treatment in a routine mode, with a very preliminary attitude determination. The magnitude of the images ranges from 17 to 19 and the astrometric accuracy of each position in this preliminary reduction is around 100 marcsec. It will be much improved during the global astrometric processing where the spacecraft attitude will also be solved together with the source astrometry.
• March 17, 2015: Gaia's FPA (Focal Plane Assembly) with its 106 CCDs is the biggest radiation monitor in space. The interactions with space radiation are detected on the CCDs in form of: 106)
1) Permanent performance degradations caused by:
- Flatband voltage shifts as result of the Total Ionizing Dose (TID)
- Increased CTI (Charge Transfer Inefficiency) as result of newly created charge trapping sites through displacement damage under NIEL (Non-Ionizing Energy Loss).
2) Transient effects leaving charge cloud tracks in the CCD pixels, when high-energy particles create electron-hole pairs along their trajectory through the silicon lattice. Different particles can leave these tracks, but for simplification the appearance of the deposited signal track on the CCD images will be called "Cosmic Rays" (CR) throughout this document.
While the permanent performance degradations are subject to other studies, the interest for this data release is the detection of cosmic rays. Gaia has no shutter and therefore no dark images are taken to be able to assess the radiation background without any other external signal sources. Furthermore nearly all CCDs are read out in windowing mode with the windows centered on the on-board detected objects, which makes cosmic ray analysis on the received science data a difficult task.
The high volume of object detections and the limited transmission bandwidth between L2 and Earth lead to optimization of the generated on-board data volume and due to Gaia's self-calibrating scheme, only few additional calibration data needs to be acquired in addition to the science objects.
One of the most suitable sets of data items for cosmic rays is the occasional engineering data from the readout process of the BAM (Basic Angle Monitor) CCDs acquired through the on-board SIF (Service Interface Function), which allows downlinking information otherwise discarded onboard before transmission. The BAM is Gaia's metrology system to measure the variations of the angle between both telescopes' line-of-sights based on laser interferometry. To be able to expose the static laser interference pattern, these are the only CCDs on board Gaia, which are operated in a stare mode with several seconds exposure time in addition to the TDI readout mode.
The BAM readout windows are centered on the highest signal interference fringes and therefore unsuitable for cosmic ray analysis. In regular intervals throughout the mission an extended length readout strip with the same BAM window width and location is recorded through the SIF mode. These window extensions contain a substantially reduced signal, which in the extreme areas of the window is completely dominated by the TDI transfer signal integration and not by exposure. Cutouts of these extreme areas are pre-processed for the purpose of cosmic ray assessment. This technical note describes the data format and content of the images.
The two BAM CCDs are located at one corner of the Gaia FPA (Figure 90, bottom left). They are divided into a nominal and redundant system marked BAM_N and BAM_R, respectively, both fed from its independent laser interferometry system. Only one system is working at a given time, and redundancy is meant here as duplication with the best performing system working during operations.
Apart from accumulated ionizing dose and proton fluency over the mission lifetime, transient events in form of cosmic ray background can give an indication of the radiation environment at Gaia's operational orbit around the Sun-Earth Lagrange point L2. Cosmic ray transient events on CCDs leave a characteristic charge trail in the images, which can be analyzed in terms of deposited charge, angle of incidence and track length. To support these studies, a small data set is being made available here (Ref. 106) together with a technical note that describes the data release content and format in more detail.
The 152 Flexible Image Transport System (FITS) image files are subsets of the occasional engineering data from the readout process of the BAM CCDs acquired through the on-board SIF (Service Interface Function), which allows downlinking information otherwise discarded on-board before transmission. These BAM CCD images provide the most suitable data set, because of two reasons: (1) these are the only CCDs on board Gaia, which are operated in a stare mode with several seconds exposure time in addition to the nominal TDI readout mode, and (2) the particular readout window subsets contain apart from the cosmic rays no other external signal source but a relatively low and constant background that has been removed in a pre-processing step.
The complete data set covering data acquisitions from May 2014 to January 2015 and the corresponding technical note are available for download from the links of Ref. 106); the data files are also in Ref. 106).
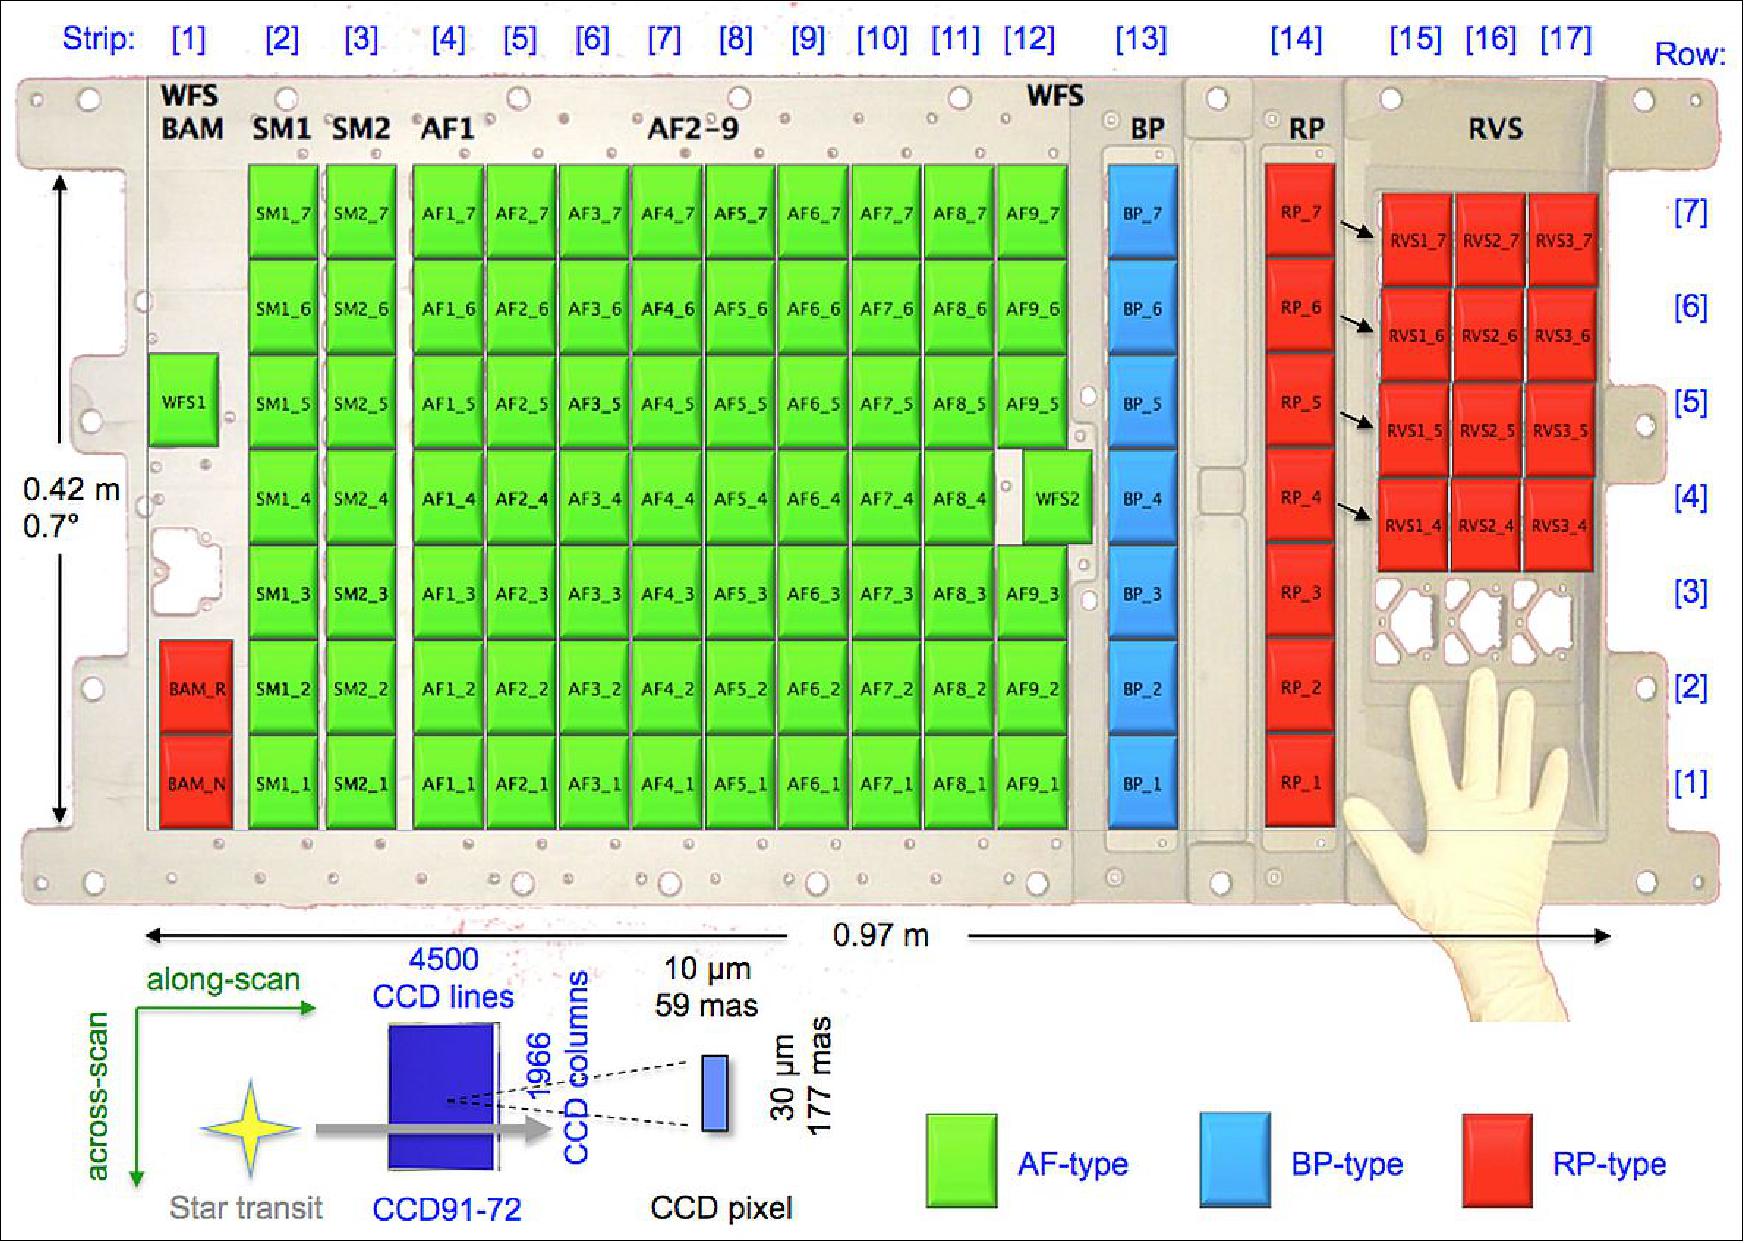
• January 2015: Routine operations continue. On average some 40 million stars cross the focal plane every day triggering astrometric, photometric and spectroscopic measurements. Owing to the nature of the astrometric measurements, no early data release is possible, but science alerts are issued regularly. In the meantime, the user community has been kept up to date with news items and data demonstrating the performance of Gaia. 107)
• January 2015: One year ago on January 8, 2014, the Gaia spacecraft had reached its operational orbit at L2 (launch Dec. 19, 2013). Nominal scanning started in September 2014. At this point, Gaia was working so well that it was producing more data than originally foreseen, since it was able to see stars fainter than required. Towards the end of the year, operators had to come up with a method to partially automate ground operations allowing Gaia to take advantage of more ground station time and to expand its mapping data set. 108)
- The science data are now coming down in huge quantities (11 billion camera transits were recorded by the one-year launch anniversary), with anticipation slowly building for what Gaia may find in the coming years.
• Dec. 19, 2014: Gaia was launched one year ago on Dec. 19, 2013. After an exciting year with a successful L2 orbit insertion, a challenging commissioning period and the start of routine operations, Gaia is now scanning the sky, mapping on average 40 million stars a day. Gaia's routine phase started on 25 July 2014, and the spacecraft's current state and usage of consumables indicate that the mission can be extended past its nominal 5-year lifetime.
- In the past year Gaia has recorded 11.1 billion transits with 120.5 billion astrometric, 22.2 billion photometric and 3.3 billion spectroscopic measurements with its 106 CCDs on board. In the routine phase the corresponding numbers are 6.76 billion transits with 73.4, 13.5 and 2 billion astrometric, photometric and spectroscopic measurements. The total data volume from Gaia so far is 9.2 TB. The whole sky has been observed at least once in the routine phase. The spacecraft is currently performing astrometry and photometry for stars brighter than G = 20.7 mag and spectroscopy till GRVS = 16.2 mag.
• September 2014: While scanning the sky to measure the positions and movements of stars in our Galaxy, Gaia has discovered its first stellar explosion in another galaxy far, far away (Figures 91 and 92). This powerful event, now named Gaia14aaa, took place in a distant galaxy some 500 million light-years away, and was revealed via a sudden rise in the galaxy's brightness between two Gaia observations separated by one month. 109)
- Gaia, which began its scientific work on 25 July, repeatedly scans the entire sky, so that each of the roughly one billion stars in the final catalogue will be examined an average of 70 times over the next five years.
- Discovery of supernova Gaia14aaa: In Figure 91, the light curve shows how the galaxy significantly brightened up between the two consecutive Gaia observations because of a stellar explosion, or supernova, which was named Gaia14aaa. This is the first supernova discovered with Gaia. 110)
![Figure 91: Light curve of galaxy SDSS J132102.26+453223.8 obtained with Gaia [image credit: ESA/Gaia/DPAC/Z. Kostrzewa-Rutkowska (Warsaw University Astronomical Observatory) & G. Rixon (Institute of Astronomy, Cambridge)]](/api/cms/documents/163813/5389966/Gaia2019_Auto4.jpeg)
Legend to Figure 91: It shows the evolution in time of the galaxy's brightness. The brightness is indicated on the vertical axis; smaller magnitude values indicate a brighter source. The data points and error bars at the lower left corner are from the first observation, performed on 31 July 2014, and they are in line with previous observations of the same galaxy performed with other telescopes. The data points at the upper right corner are from the second observation, performed on 30 August 2014, and reveal a sudden rise in brightness of almost two magnitudes (roughly a factor of 6). - Using data from Gaia and other telescopes, astronomers confirmed that Gaia14aaa is a Type Ia supernova, the explosion of a white dwarf caused by the accretion of matter from a companion star in a binary system.
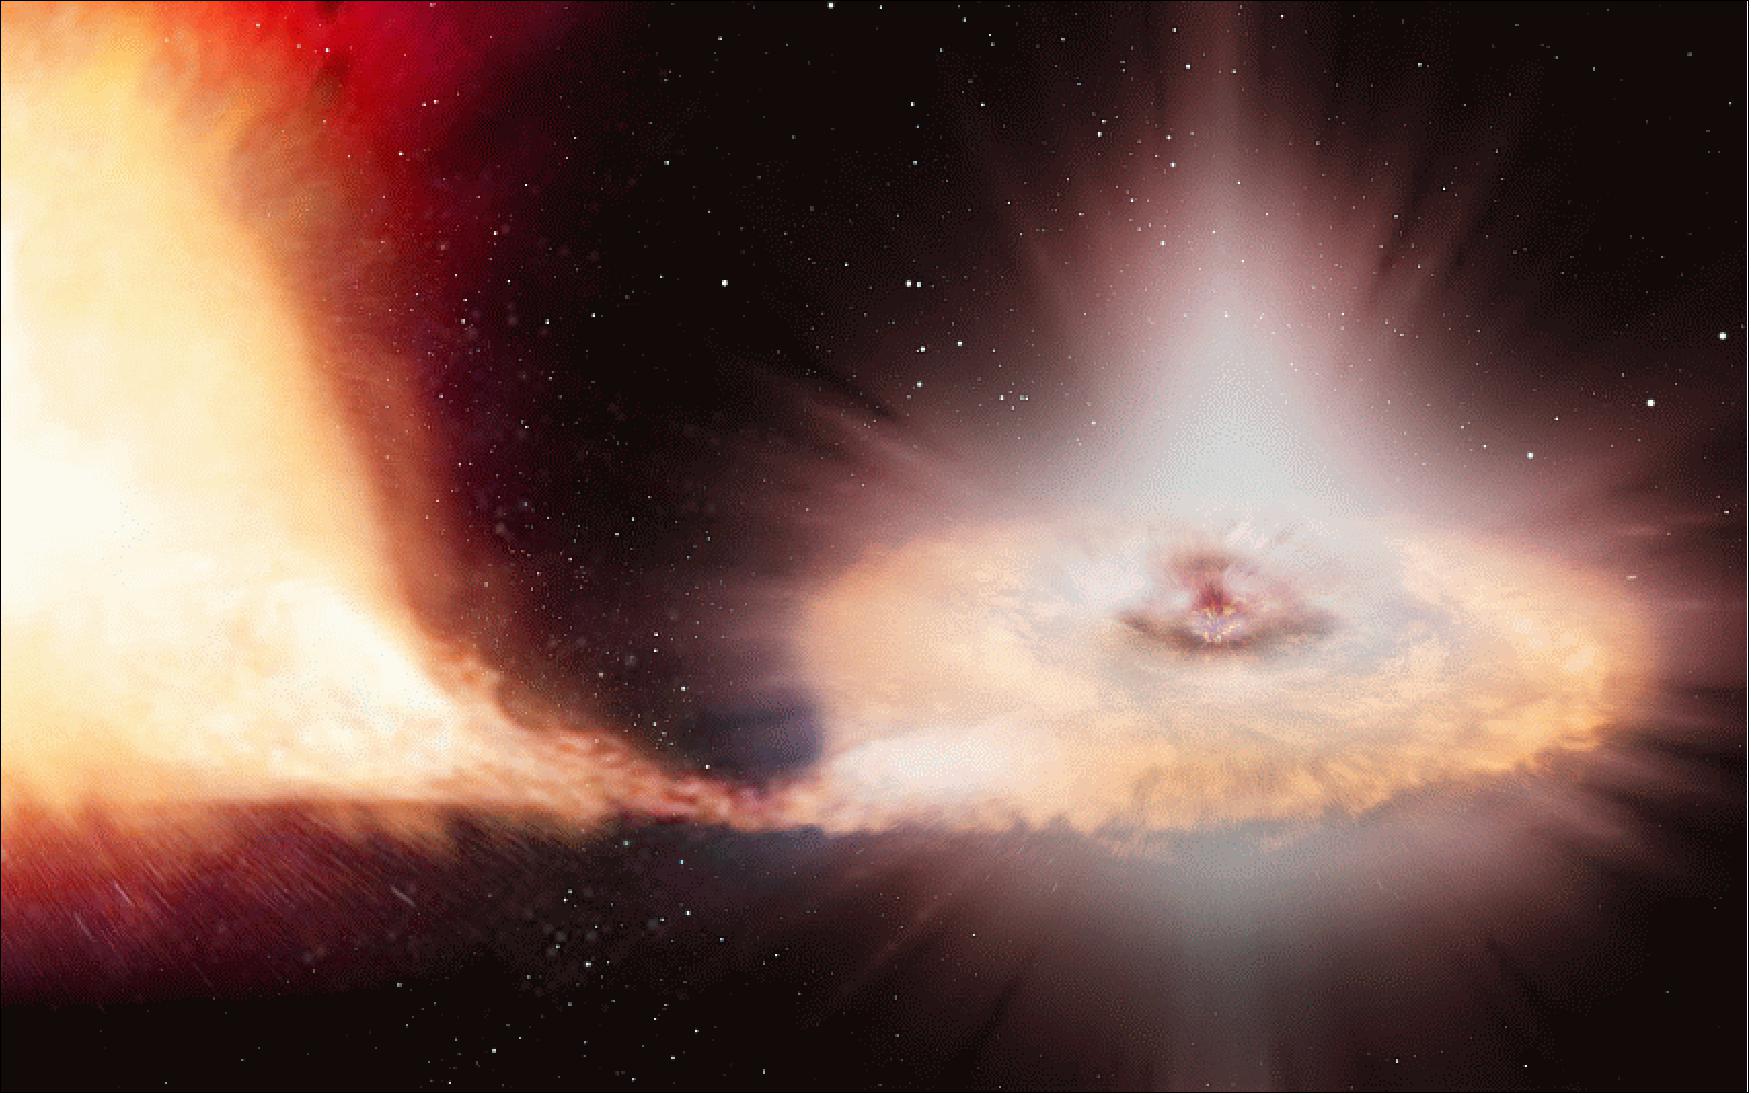
Legend to Figure 92: While other types of supernovas are the explosive demises of massive stars, several times more massive than the Sun, Type Ia supernovas are the end product of their less massive counterparts. Low-mass stars, with masses similar to the Sun's, end their lives gently, puffing up their outer layers and leaving behind a compact white dwarf. Due to their high density, white dwarfs can exert an intense gravitational pull on a nearby companion star, accreting mass from it until the white dwarf reaches a critical mass that then sparks a violent explosion.
• Routine operations started immediately after the commissioning period. At the beginning, the EPSL (Ecliptic Pole Scanning Law) was used, for 28 days, to guide the mapping of the sky. In this mode every scan crossed both the North and the South Ecliptic Pole. The advantage was that the stellar fields at the poles were studied in detail before the Gaia launch and could therefore be used for calibration. 111)
- During the second routine operations month, Gaia was commanded to follow the NSL (Nominal Scanning Law). The transition from EPSL to NSL was done in a continuous fashion to transfer the calibration over to the nominal mode. At the end of September, Gaia's spin axis orientation was optimized to catch a bright star close to the limb of Jupiter later in the mission for a light deflection experiment.
• August 4, 2014: Seven months after launch and following extensive commissioning, ESA's Gaia satellite is ready to start its scientific mission. The science phase formally began on July 18, 2014, meaning that Gaia is now under the responsibility of the Mission Manager, William O'Mullane, and the Science Operations Center team at ESA/ESAC (European Space Astronomy Center) in Madrid, Spain. 112)
On this occasion, the Gaia flag also changed home. The Gaia Project Manager, Giuseppe Sarri, handed it over to William O'Mullane, who is holding the flag in this photo (Figure 93, right) together with Payload Manager Philippe Garé (left). This symbolic handover marks a new chapter in the mission's story.
This is one of two flags that flew at Europe's Spaceport in Kourou, French Guiana during the weeks leading up to the launch on December 19, 2013. Shortly after, the other flag was sent to ESA/ESOC (European Space Operations Center) in Darmstadt, Germany, where the Mission Operations Center has since been taking care of Gaia's health.
While the Mission Operations Center receives the data from the satellite, the Science Operations Center coordinates their distribution to the Data Processing and Analysis Consortium, who will eventually produce the Gaia catalog.
The design on the flag represents the attempt of humankind to reach for the stars, an enduring fascination that resonates with the scientific goals of the Gaia mission. Originally designed for the launcher fairing, the logo will now fly at two of ESA's establishments in Europe, looking forward to Gaia's measurements and to the many discoveries to come.
• July 29, 2014: The Gaia mission is operational to begin its five-year science phase. Following extensive in-orbit commissioning and several unexpected challenges, ESA's billion-star surveyor, Gaia, is now ready to begin its science mission. 113)
The commissioning phase uncovered some unexpected anomalies:
- One problem detected early in the commissioning was associated with water freezing on some parts of the optics, causing a temporary reduction in transmission of the telescopes. This water was likely trapped in the spacecraft before launch and emerged once it was in a vacuum. Heating the affected optics to remove the ice has now largely solved this problem, but it is likely that one or two more ‘decontamination' cycles will be required during the mission to keep it in check.
- Another problem is associated with ‘stray light' reaching Gaia's focal plane at a level higher than predicted before launch. This appears to be a mixture of light from the Sun finding its way past Gaia's 10 m diameter sunshield and light from other astronomical objects, both making their way to the focal plane as a diffuse background.
The commissioning of Gaia came to its formal end on July 18, 2014 when the board members of the MIOCR (Mission In-Orbit Commissioning Review) confirmed the readiness of the space and ground segments to start routine operations. The review summarized the commissioning activities both on ground and in orbit. New scientific performance estimates have been calculated since using in-orbit commissioning data. 114)
On July 25, 2014, Gaia started its routine phase by scanning the sky for 28 days using the so-called ecliptic-poles scanning law. This is useful to bootstrap the basic calibrations of the data. After these 28 days, the nominal scanning law will be used to determine how Gaia is scanning the sky. Although the commissioning phase has ended, some activities remain to be completed. The root causes of the stray light and the basic-angle variations have not been found yet. A dedicated working group will hence address these topics during the remainder of 2014. Nonetheless, Gaia has started its 5-year journey today to produce a map of the Galaxy in three dimensions for one billion stars with unprecedented precision!
• June 16, 2014: A series of exhaustive tests have been conducted over the past few months to characterize some anomalies that have been revealed during the commissioning of Gaia. Key among these are an increased background seen in Gaia's focal plane assembly due to stray light entering the satellite and reduced transmission of the telescope optics. In an effort to understand both problems, much of the diagnostic work has been focussed on contamination due to small amounts of water trapped in the spacecraft before launch that has been "outgassing" now that Gaia is in a vacuum. The Gaia payload module is illustrated in Figure NO TAG#. 115)
The water vapor freezes out as ice on cold surfaces and since Gaia's payload sits at temperatures between –100 and –150°C in the dark behind the big sunshield, that is where it ends up, including on the telescope mirrors. The ice initially led to a significant decrease in the overall transmission of the optics, but this problem was successfully dealt with by using heaters on Gaia's mirrors and focal plane to remove the ice, before letting them cool down to operational temperatures again.
Some ice on the mirrors was expected – that is why the mirrors are equipped with heaters – but the amount detected was higher than expected. As the spacecraft continues to outgas for a while, future ‘decontamination' campaigns are foreseen to keep the transmission issue in check using a much lighter heating procedure to minimize any disturbing effect on the thermal stability of the spacecraft.
With regards to the stray light, our analysis of the test data indicates that it is a mixture of sunlight diffracting over the edge of the sunshield and brighter sources in the ‘night sky' on the payload side, both being scattered into the focal plane. A model has been developed which goes some way to explaining the stray light seen in the focal plane, but not all aspects are yet understood.
One key working hypothesis was that ice deposits have built up on the ceiling of the thermal tent structure surrounding the payload, and that scattering off this ice might enhance the stray light. Although there is no way to directly confirm that this is indeed the situation, the Gaia project team nevertheless considered ways of removing any such ice.
Unlike the mirrors and focal plane, the thermal tent does not have any heaters, so alternative solutions had to be explored. One option analyzed in detail would involve altering the attitude of the spacecraft to allow sunlight to directly enter the thermal tent in order to remove any ice that might be there. The risks associated with this concept were assessed, and software and procedures developed to carry it out safely, but there is currently no plan to do so.
Under the assumption that the stray light cannot be completely eliminated, the team is investigating a variety of modified observing strategies to help reduce its impact over the course of the mission, along with modified on-board and ground software to best optimize the data that will be collected. Even if the team has to work with the stray light, it is already known that it will only affect the quality of the data collected for the faintest of Gaia's one billion stars.
Stray light increases the background detected by Gaia and thus the associated noise. The impact is largest for the faintest stars, where the noise associated with the stellar light itself is comparable to that from the background, but there is minimal impact on brighter ones, for which the background is an insignificant fraction of the total flux.
The stray light is variable across Gaia's focal plane and variable with time, and has a different effect on each of Gaia's science instruments and the corresponding science goals. Thus, it is not easy to characterize its impact in a simple way.
However, broadly speaking, the team's current analysis is that if the stray light remains as it is today, its impact will be to degrade the astrometric accuracy of a solar-type star at magnitude 20, the faint limit of Gaia, by roughly 50%, from 290 µarcsec to 430 µarcsec by the end of the mission. Things improve as one moves to progressively brighter stars, and by magnitude 15, the accuracy will remain unaltered at approximately 25 µarcsec.
It is important to realize that for many of Gaia's science goals, it is these relatively brighter stars and their much higher accuracy positions that are critical, and so it is good to see that they are essentially unaffected. Also, the total number of stars detected and measured will remain unchanged.
For brightness and low-resolution spectroscopic measurements made by Gaia's photometric instruments, current indications are that the faintest stars at magnitude 20 will have been measured to roughly the 6–8% level by the end of the mission, rather than a nominal 4%, while brighter stars will remain more accurate at about 0.4%.
The RVS (Radial Velocity Spectrometer) is most affected by the stray light and about 1.5 magnitudes of sensitivity could be lost, although the number of stars that that translates into will not be known until on-going data analysis is complete.
Finally, Gaia also contains a laser interferometer called the BAM (Basic Angle Monitor) system, designed to measure the angle of separation between Gaia's two telescopes to an accuracy of 5 µarcsec every few minutes. This is necessary in order to correct for variations in the separation angle caused by ‘normal' thermal changes in the payload as Gaia spins. The system is working as planned, but is seeing larger-than-expected variations in the basic angle. The team is currently examining these data to discover if this issue will have any impact.
A comprehensive understanding of these issues will be given, when a thorough analysis of all engineering tests is complete. Gaia has nearly completed its performance verification data taking, and is about to start a month-long dedicated science observation run. Once the data have been fully analyzed, the team will be able to provide a detailed quantitative assessment of the scientific performance of Gaia (Ref. 115).
• February 2014: The Gaia observatory is slowly being brought into focus. A test calibration image (Figure 94), taken as part of commissioning the mission to ‘fine tune' the behavior of the instruments, is one of the first proper ‘images' to be seen from Gaia, but ironically, it will also be one of the last, as Gaia's main scientific operational mode does not involve sending full images back to Earth. — Once Gaia starts making routine measurements, it will generate truly enormous amounts of data. To maximize the key science of the mission, only small ‘cut-outs' centered on each of the stars it detects will be sent back to Earth for analysis. 116)
In the commissioning phase, the telescopes must be aligned and focused, along with precise calibration of the instruments, a painstaking procedure that will take several months — to understand the full behavior and performance of the instruments — before Gaia is ready to enter its five-year operational phase. As part of that process, the Gaia team has been using a test mode to download sections of data from the camera, including the image of NGC1818 (Figure 94), a young star cluster in the Large Magellanic Cloud. The image covers an area less than 1% of the full Gaia field of view.
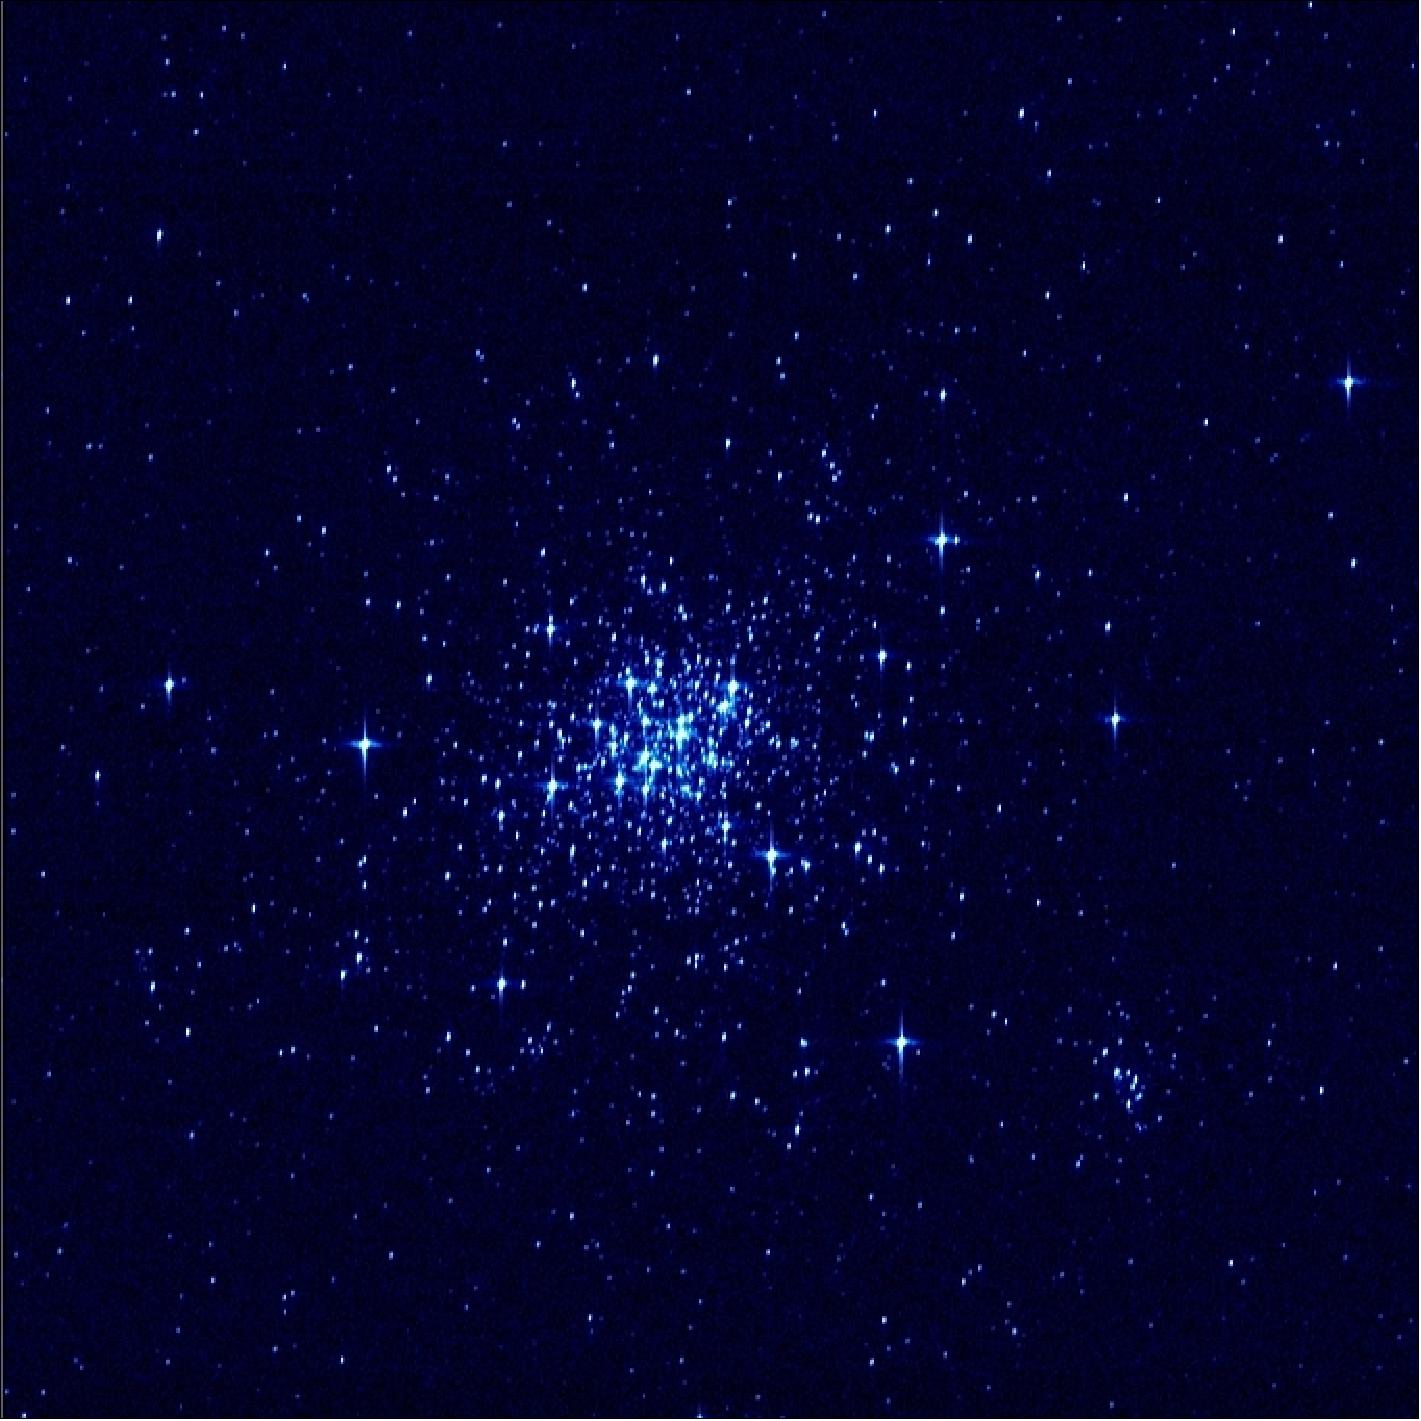
• With a final, modest, thruster burn on January 14, 2014, ESA's billion-star surveyor finalized its entry into its orbit around ‘L2', a virtual point far out in space. L2 provides a moderate radiation environment, which helps extend the life of the instrument detectors in space. However, orbits around L2 are fundamentally unstable. 117)
- Lissajous orbit: In terms of the math, the thruster burns on January 2014 are moving Gaia onto what's known as a 'stable manifold' – a pathway in space that will lead the spacecraft to orbit around L2. Gaia is now moving in a so-called Lissajous orbit around L2, once every 180 days. - The name Lissajous refers to the shape of the path traced out by the orbit as seen from Earth, which will rise then fall above and below the ecliptic plane (the plane of Earth's orbit around the Sun) while sometimes leading and sometimes lagging the Earth. 118) 119)
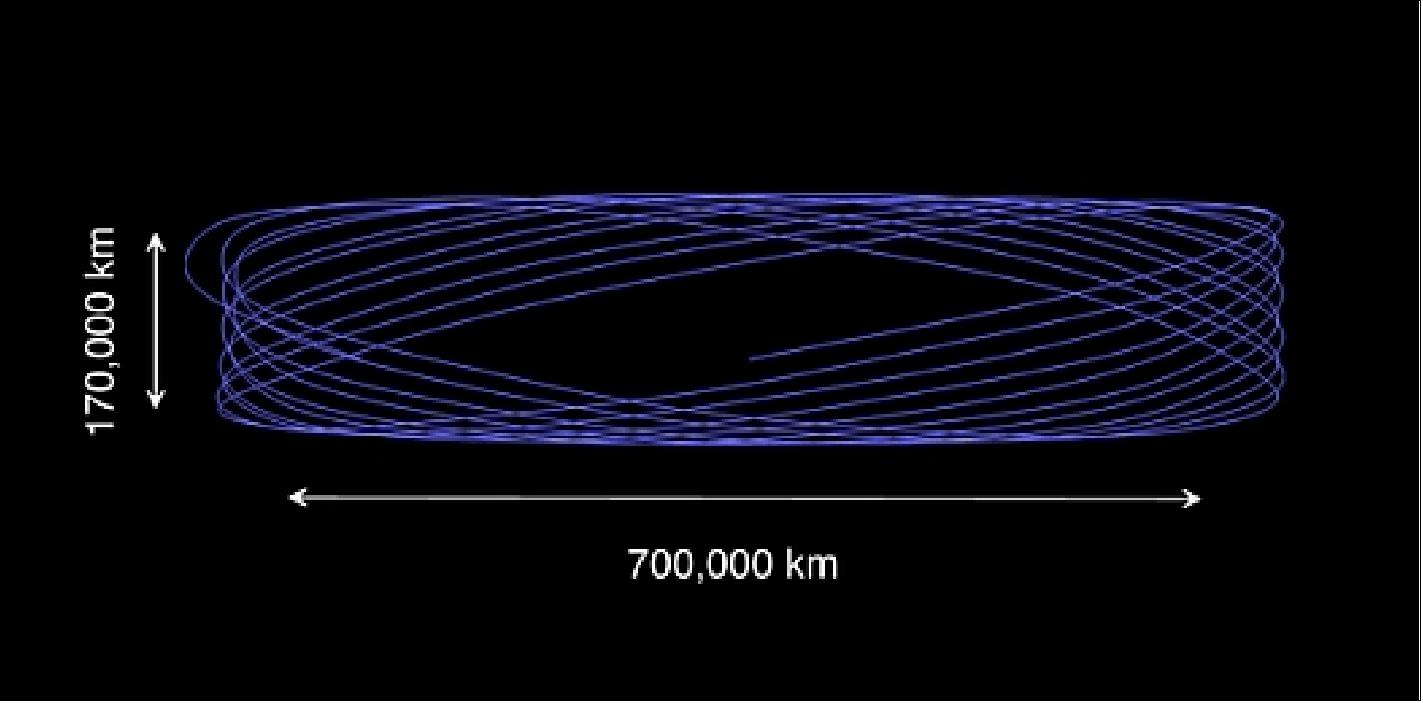
• January 08, 2014: The Gaia spacecraft is now in its operational orbit around the Lagrangian point L2, a gravitationally stable virtual region in space, 1.5 million km from Earth. 120)
- Entering orbit around L2 is a rather complex endeavor, achieved by firing Gaia's thrusters in such as way as to push the spacecraft in the desired direction whilst keeping the Sun away from the delicate science instruments.
- Once the spacecraft instruments have been fully tested and calibrated – an activity that started en route to L2 and will continue for another four months – Gaia will be ready to enter a five-year operational phase.
• Dec. 20, 2013: Gaia performed an important thruster burn to set course to its destination. The critical maneuver boosts Gaia into its 263,000 x 707,000 x 370,000 km, 180 day-long orbit around L2.
The first 2 days of operations were critical for the mission success. After separation from the launcher, the spacecraft starts an autonomous sequence that consisted in the main following steps:
- Telemetry initialization
- Payload bipods release
- Chemical propulsion system activation
- Sunshield (DSA) deployment
- Second sun acquisition.
1) "Second stellar population found in Milky Way's thick disk," Phys.org, 11 December 2019, URL: https://phys.org/news/2019-12-stellar-population-milky-thick-disk.html
2) Daniela Carollo, Masashi Chiba, Miho Ishigaki, Ken Freeman, Timothy C. Beers, Young Sun Lee, Patricia Tissera, Chiara Battistini, and Francesca Primas, "Evidence for the Third Stellar Population in the Milky Way's Disk," The Astrophysical Journal, Volume 887, Number 1, Published: 6 December 2019, https://doi.org/10.3847/1538-4357/ab517c
3) "Gaia astronomical revolution," ESA Science & Exploration, 22 October 2019, URL: https://www.esa.int/ESA_Multimedia/Videos/2019/10/Gaia_astronomical_revolution
4) "Gaia untangles the starry strings of the Milky Way," ESA, 28 August 2019, URL: http://www.esa.int/Our_Activities/Space_Science
/Gaia/Gaia_untangles_the_starry_strings_of_the_Milky_Way
5) Marina Kounkel, Kevin Covey, "Untangling the Galaxy I: Local Structure and Star Formation History of the Milky Way," Astronomical Journal, Draft version July 22, 2019, URL: https://arxiv.org/pdf/1907.07709.pdf
6) "Astronomers spy Europa blocking distant star – thanks to Gaia," ESA, 25 July 2019, URL: http://www.esa.int/Our_Activities/Space_Science
/Gaia/Astronomers_spy_Europa_blocking_distant_star_thanks_to_Gaia
7) B. Morgado, G. Benedetti-Rossi, A. R. Gomes-Júnior, M. Assafin, V. Lainey, R. Vieira-Martins, J. I. B. Camargo, F. Braga-Ribas, R. C. Boufleur, J. Fabrega, D. I. Machado, A. Maury, L. L. Trabuco, J. R. de Barros, P. Cacella, A. Crispim, C. Jaques, G. Y. Navas, E. Pimentel,F. L. Rommel, T. de Santana, W. Schoenell, R. Sfair and O. C. Winter, "First stellar occultation by the Galilean moon Europa and upcoming events between 2019 and 2021," Astronomy & Astrophysics, 29 May 2019, https://doi.org/10.1051/0004-6361/201935500, URL:https://tinyurl.com/y2q6ls33
8) "Gaia starts mapping our galaxy's bar," ESA, 16 July 2019, URL: https://www.esa.int/Our_Activities/Space_Science/Gaia/Gaia_starts_mapping_our_galaxy_s_bar
9) F. Anders, A. Khalatyan, C. Chiappini, A. B. Queiroz, B. X. Santiago, C. Jordi, L. Girardi,A. G. A. Brown, G. Matijevic, G. Monari, T. Cantat-Gaudin, M. Weiler, S. Khan, A. Miglio, I. Carrillo,M. Romero-Gómez, I. Minchev, R. S. de Jong, T. Antoja, P. Ramos, M. Steinmetz, H. Enke, "Photo-astrometric distances, extinctions, and astrophysical parameters for Gaia DR2 stars brighter than G=18," Astronomy&Astrophysics manuscript No. GDR2_SH, 3July 2019, © ESO 2019, https://doi.org/10.1051/0004-6361/201935765, URL: https://www.aanda.org/articles/aa/pdf/forth/aa35765-19.pdf
10) "Gaia's biggest operation since launch and commissioning," ESA, 15 July 2019, URL: http://www.esa.int/Our_Activities/Operations/Gaia_s_biggest_operation_since_launch
11) "Gaia's asteroid discoveries," ESA, 28 June 2019, URL: http://www.esa.int/spaceinimages/Videos/2019/06/Gaia_s_asteroid_discoveries
12) "Star formation burst in the Milky Way 2–3 billion years ago (Update)," Phys.org. 9 May 2019, URL: https://phys.org/news/2019-05-star-formation-milky-million-years.html
13) R. Mor, A. C. Robin, F. Figueras, S. Roca-Fàbrega and X. Luri, "Gaia DR2 reveals a star formation burst in the disc 2–3 Gyr ago," Astronomy & Astrophysics, Volume 624, April 2019, Article Number L1, Published online: 1 April 2019, https://arxiv.org/pdf/1901.07564.pdf
14) "Observing Gaia from Earth to improve its star maps," ESA, 02 May 2019, URL: http://www.esa.int/Our_Activities/Space_Science/Gaia
/Observing_Gaia_from_Earth_to_improve_its_star_maps
15) "Pinpointing Gaia to Map the Milky Way," ESO 1908 Organization Release, 02 May 2019, URL: https://www.eso.org/public/news/eso1908/?lang
16) "Gaia's first asteroid survey," ESA, 25 April 2018, URL: https://www.youtube.com/watch?v=jQybxrqOnP4
17) "Gaia's first asteroid discoveries," ESA, Space Science Image of the Week: While charting the stars, Gaia also observes asteroids and occasionally spots new ones, 29 April 2019, URL: http://www.esa.int/spaceinimages/Images/2019/04/Gaia_s_first_asteroid_discoveries
18) "Hubble & Gaia accurately weigh the Milky Way [heic1905]," ESA Science & Technology, 7 March 2019, URL: http://sci.esa.int/hubble/61198-hubble-and-gaia-accurately-weigh-the-milky-way-heic1905/
19) Laura L. Watkins, Roeland P. van der Marel, Sangmo Tony Sohn, N. Wyn Evans, "Evidence for an Intermediate-Mass Milky Way from Gaia DR2 Halo Globular Cluster Motions," The Astrophysical Journal, Draft version, 11 February 2019, URL: https://arxiv.org/pdf/1804.11348.pdf
20) "Rethinking everything we thought we knew about star clusters," ESA Science & Technology, 26 February 2019, URL: http://sci.esa.int/gaia/61153-rethinking-everything-we-thought-we-knew-about-star-clusters/
21) "Gaia clocks new speeds for Milky Way-Andromeda collision," ESA, 7 February 2019, URL: http://m.esa.int/Our_Activities/Space_Science/Gaia
/Gaia_clocks_new_speeds_for_Milky_Way-Andromeda_collision
22) Roeland P. van der Marel, Mark A. Fardal, Sangmo Tony Sohn, Ekta Patel, Gurtina Besla, Andrés del Pino, Johannes Sahlmann, and Laura L. Watkins, "First Gaia Dynamics of the Andromeda System: DR2 Proper Motions, Orbits, and Rotation of M31 and M33," The Astrophysical Journal, Volume 872, Number 1, Published: 7 February 2019, https://doi.org/10.3847/1538-4357/ab001b
23) Ginger Pinholster, "New technique more precisely determines the ages of stars," ERAU, 10 January 2019, URL: https://news.erau.edu/headlines/new-technique-more-precisely-determines-the-ages-of-stars/
24) "Gaia reveals how Sun-like stars turn solid after their demise," ESA, 9 January 2019, URL: http://m.esa.int/Our_Activities/Space_Science/Gaia
/Gaia_reveals_how_Sun-like_stars_turn_solid_after_their_demise
25) Pier-Emmanuel Tremblay, Gilles Fontaine, Nicola Pietro Gentile Fusillo, Bart H. Dunlap, Boris T. Gänsicke, Mark A. Hollands, J. J. Hermes, Thomas R. Marsh, Elena Cukanovaite & Tim Cunningham, "Core crystallization and pile-up in the cooling sequence of evolving white dwarfs," Nature, volume 565, pages202–205, 9 January 2019, https://doi.org/10.1038/s41586-018-0791-x
26) "The Universe of Gaia," ESA, 13 December 2018, URL: http://m.esa.int/spaceinvideos/Videos/2018/12/The_Universe_of_Gaia
27) "Extended life for ESA's science missions," ESA Science & Technology, 14 November 2018, URL: http://sci.esa.int/director-desk/60943-extended-life-for-esas-science-missions/
28) "Galactic ghosts: Gaia uncovers major event in the formation of the Milky Way," ESA Science and Technology, 31 October 2018, URL: http://m.esa.int/Our_Activities/Space_Science
/Gaia/Galactic_ghosts_Gaia_uncovers_major_event_in_the_formation_of_the_Milky_Way
29) http://sci.esa.int/gaia
/60892-galactic-ghosts-gaia-uncovers-major-event-in-the-formation-of-the-milky-way/
30) "Stellar debris of galactic merger in the Milky Way," ESA, 31 October 2018, URL: http://m.esa.int/spaceinimages/Images/2018/10
/Stellar_debris_of_galactic_merger_in_the_Milky_Way
31) Amina Helmi, Carine Babusiaux, Helmer H. Koppelman, Davide Massari, Jovan Veljanoski, Anthony G. A. Brown, "The merger that led to the formation of the Milky Way's inner stellar halo and thick disk," Nature, Volume 563, pages85–88, 31 October 2018, URL of abstract: https://www.nature.com
/articles/s41586-018-0625-x
32) "Gaia spots stars flying between galaxies," ESA, 02 October 2018, URL: http://m.esa.int/Our_Activities/Space_Science
/Gaia/Gaia_spots_stars_flying_between_galaxies
33) T Marchetti, E. M. Rossi, A. G. A. Brown, "Gaia DR2 in 6D: Searching for the fastest stars in the Galaxy," Monthly Notices of the Royal Astronomical Society, sty2592, https://doi.org/10.1093/mnras/sty2592, Published: 20 September 2018
34) "Gaia finds candidates for interstellar ‘Oumuamua's home," ESA, 25 September 2018, URL: http://m.esa.int/Our_Activities/Space_Science
/Gaia/Gaia_finds_candidates_for_interstellar_Oumuamua_s_home
35) C. A. L. Bailer-Jones, D. Farnocchia, K. J. Meech, R. Brasser, M. Micheli, S. Chakrabarti, M. W. Buie, O. R. Hainaut, "Plausible home stars of the interstellar object 'Oumuamua found in Gaia DR2," accepted to The Astronomical Journal, Earth and Planetary Astrophysics, 24 September 2018, URL: https://arxiv.org/pdf/1809.09009.pdf
36) "Gaia hints at our Galaxy's turbulent life," ESA 19 September 2018, URL: http://m.esa.int/Our_Activities/Space_Science/Gaia/Gaia_hints_at_our_Galaxy_s_turbulent_life
37) T. Antoja, A. Helmi, M. Romero-Gómez, D. Katz, C. Babusiaux, R. Drimmel, D. W. Evans, F. Figueras, E. Poggio, C. Reylé, A. C. Robin, G. Seabroke, C. Soubiran, "A dynamically young and perturbed Milky Way disk," Nature, Volume 561, pp: 360-362, published on 19 September 2018, DOI: 10.1038/s41586-018-0510-7
38) "Infant exoplanet weighed by Hipparcos and Gaia," ESA, 20 August 2018, URL: http://m.esa.int/Our_Activities/Space_Science/Gaia/Infant_exoplanet_weighed_by_Hipparcos_and_Gaia
39) "Astrometric measurements to detect exoplanets," ESA, 20 August 2018, URL: http://m.esa.int/spaceinimages/Images/2018/08/Astrometric_measurements_to_detect_exoplanets
40) I. A. G. Snellen, A. G. A. Brown, "The mass of the young planet Beta Pictoris b through the astrometric motion of its host star," Nature Astronomy Letter, published 20 August 2018, DOI: https://doi.org
/10.1038/s41550-018-0561-6
41) "Galactic mesh, Space Science Image of the Week, ESA, 20 August 2018, URL: http://m.esa.int/spaceinimages/Images/2018/08/Star_density_map
42) "Gaia creates richest star map of our Galaxy – and beyond," ESA, 25 April 2018, URL: http://m.esa.int
/Our_Activities/Space_Science/Gaia/Gaia_creates_richest_star_map_of_our_Galaxy_and_beyond
43) "Gaia Data Release 2 Virtual Reality resources," ESA, 25 April, 2018, URL: http://sci.esa.int
/gaia/60036-gaia-data-release-2-virtual-reality-resources/
44) "Gaia's sky in color," ESA, 25 April 2018, URL: http://m.esa.int/spaceinimages/Images/2018/04/Gaia_s_sky_in_colour2
45) "Gaia: the Galactic census takes shape," ESA, 25 April 2018, URL: http://m.esa.int/spaceinimages/Images/2018/04/Gaia_the_Galactic_census_takes_shape
46) "Cosmic scales covered by Gaia's second data release," ESA, 25 April 2018, URL: http://m.esa.int/spaceinimages/Images/2018/04/Cosmic_scales_covered_by_Gaia_s_second_data_release
47) "Gaia's Hertzsprung-Russell diagram," ESA, 25 April 2018, URL: http://m.esa.int/spaceinimages/Images/2018/04/Gaia_s_Hertzsprung-Russell_diagram
48) "Rotation of the Large Magellanic Cloud," ESA, 25 April, 2018, URL: http://m.esa.int/spaceinimages/Images/2018/04/Rotation_of_the_Large_Magellanic_Cloud
49) "The cat in Orion – or was it a fox?," ESA, 3 April, 2018, URL: http://m.esa.int/spaceinimages/Images/2018/04/The_cat_in_Orion_or_was_it_a_fox
50) "Gaia's view of dark interstellar clouds," ESA, 3 April 2018, URL: http://sci.esa.int
/gaia/60131-gaia-s-view-of-dark-interstellar-clouds/
51) "Gaia status update: safe mode and recovery," ESA,Science & Technology, 21 March 2018, URL: http://sci.esa.int/gaia/60098-gaia-status-update-safe-mode-and-recovery/
52) "Chasing a stellar flash with assistance from Gaia," ESA, 27 Feb. 2018, URL: http://sci.esa.int
/gaia/60011-chasing-a-stellar-flash-with-assistance-from-gaia/
53) "Obscured Sirius reveals Gaia 1 cluster," ESA, Space Science Image of the Week, 29. 01.2018, URL: http://m.esa.int/spaceinimages/Images/2018/01/Obscured_Sirius_reveals_Gaia_1_cluster
54) "Gaia's second data release set for 25 April," ESA, 25 Jan. 2018, URL: http://sci.esa.int
/gaia/59944-save-the-date-gaia-s-second-data-release-set-for-25-april/
55) "Not-so-evil twin — Gaia avionics model," ESA Operations image of the week, 17 Jan. 2018, URL: http://m.esa.int/spaceinimages/Images/2018/01/Gaia_avionics_model
56) Matt Williams, "The Gaia Mission Could Moonlight as a Gravitational Wave Detector," Universe Today, 5 Jan. 2018, URL: https://www.universetoday.com
/138204/gaia-mission-moonlight-gravitational-wave-detector/
57) Philip Ball, "Focus: Detecting Gravitational Waves by Watching Stars," Physics, Vol. 10, 138, Dec. 29, 2017, URL: https://physics.aps.org/articles/v10/138
58) Christopher J. Moore, Deyan P. Mihaylov, Anthony Lasenby, Gerard Gilmore, "Astrometric Search Method for Individually Resolvable Gravitational Wave Sources with Gaia," Physical Review Letters, Vol. 119, 261102, 29 Dec. 2017, https://journals.aps.org/prl/abstract/10.1103/PhysRevLett.119.261102
59) V. B. Braginsky,N. S. Kardashev, A. G. Polnarev, I. D. Novikov, "Propagation of electromagnetic radiation in a random field of gravitational waves and space radio interferometry," October 1990, Volume 105, Issue 10, pp 1141–1158, https://doi.org/10.1007/BF02827323
60) Sergei A. Klioner, "Gaia-like astrometry and gravitational waves," 7 Dec. 2017, URL: https://arxiv.org/pdf/1710.11474.pdf
61) "Four years of Gaia," ESA, 20 Dec. 2017, URL: http://m.esa.int/spaceinimages/Images/2017/12/Four_years_of_Gaia
62) "Festive garlands," ESA, Space Science Image of the Week, 18 Dec. 2017, URL: http://m.esa.int/spaceinimages/Images/2017/12/Gaia_sky_scan
63) "Gaia's view of our galactic neighbors," ESA Science & Technology, 13 Dec. 2017, URL: http://sci.esa.int/gaia/59855-gaia-s-view-of-our-galactic-neighbours/
64) "Green light for continued operations of ESA science missions," ESA, 7 Dec. 2017, URL: http://sci.esa.int/director-desk/59839-green-light-for-continued-operations-of-esa-science-missions/
65) "Stellar motions in nearby galaxy hint at underlying dark matter," ESA Science & Technology, 27 November 2017, URL: http://sci.esa.int
/gaia/59806-stellar-motions-in-nearby-galaxy-hint-at-underlying-dark-matter/
66) D. Massari, M. A. Breddels, A. Helmi, L. Posti, A. G. A. Brown, E. Tolstoy, "Three-dimensional motions in the Sculptor dwarf galaxy as a glimpse of a new era," Nature Astronomy (2017), doi:10.1038/s41550-017-0322-y, Published online: 27 November 2017
67) "Hubble and Gaia team up to measure 3D stellar motion with record-breaking precision [heic1719]," ESA Science & Technology, 27 November 2017, URL: http://sci.esa.int/hubble
/59812-hubble-and-gaia-team-up-to-measure-3d-stellar-motion-with-record-breaking-precision/
68) "How do you find a star cluster? Easy, simply count the stars," ESA, 15 Nov. 2017, URL: http://sci.esa.int/gaia/59741-how-do-you-find-a-star-cluster-easy-simply-count-the-stars/
69) Sergey E. Koposov, V. Belokurov, G. Torrealba, "Gaia 1 and 2. A pair of new Galactic star clusters," Monthly Notices of the Royal Astronomical Society, Volume 470, Issue 3, 21 September 2017, pp: 2702–2709, doi: 10.1093/mnras/stx1182
70) "Cloudy with a chance of protons," ESA Operations image of the week, 26 Oct. 2017, URL: http://www.esa.int/spaceinimages/Images/2017/10/Cloudy_with_a_chance_of_protons
71) "Gaia data help prepare for a rare celestial alignment of Neptune's largest moon," ESA Science and Technology, 3 October 2017, URL: http://sci.esa.int/gaia
/59628-gaia-data-help-prepare-for-a-rare-celestial-alignment-of-neptune-s-largest-moon/
72) Tomasz Nowakowski, "Researchers analyze chemical composition of the newly discovered star cluster Gaia 1," Phys.Org, 25, Sept. 2017, URL: https://phys.org/news
/2017-09-chemical-composition-newly-star-cluster.html
73) Andreas Koch, Terese T. Hansen, Andrea Kunder, "Detailed chemical abundance analysis of the thick disk star cluster Gaia 1," Astronomy & Astrophysics, Sept. 12, 2017, URL: https://arxiv.org/pdf/1709.04022.pdf
74) "Gaia sky mapper image near the Galactic center," ESA, Sept. 4, 2017, URL: http://m.esa.int/spaceinimages/Images/2017/08/Gaia_sky_mapper_image_near_the_Galactic_centre
75) "Close encounters of the stellar kind," ESA, 31 Aug. 2017, URL: http://m.esa.int/Our_Activities/Space_Science/Gaia/Close_encounters_of_the_stellar_kind
76) C. A. L. Bailer-Jones, "The completeness-corrected rate of stellar encounters with the Sun from the first Gaia data release," Astronomy & Astrophysics, 16 Aug. 2017, DOI: https://doi.org/10.1051/0004-6361/201731453, URL: https://www.aanda.org/articles/aa/pdf/forth/aa31453-17.pdf
77) "Sneak peek of Gaia's sky in color," ESA, 16 August 2017, URL: http://sci.esa.int
/gaia/59404-sneak-peek-of-gaias-sky-in-colour/
78) "Artificial brain helps Gaia catch speeding stars," ESA, June 26, 2017, URL: http://sci.esa.int
/gaia/59263-artificial-brain-helps-gaia-catch-speeding-stars/
79) T. Marchetti, E. M. Rossi, G. Kordopatis, A. G. A. Brown, A. Rimoldi,E. Starkenburg, K. Youakim, R. Ashley, "An artificial neural network to discover Hypervelocity stars: Candidates in Gaia DR1/TGAS," Monthly Notices of the Royal Astronomical Society, DOI: https://doi.org/10.1093/mnras/stx1304, published 25 May, 2017
80) "Gaia's snapshot of another galaxy," ESA, 20 April, 2017, URL: http://sci.esa.int
/gaia/59023-gaia-s-snapshot-of-another-galaxy/
81) "Gaia sky scan," ESA, Space Science Image of the Week, 10 April 2017, URL: http://www.esa.int/spaceinimages/Images/2017/04/Gaia_sky_scan
82) "Missing Stars in the Solar Neighborhood Reveal the Sun's Speed and Distance to the Center of the Milky Way Galaxy;" Press Release, Dunlop Institute for Astronomy & Astrophysics, University of Toronto, Feb. 13, 2017, URL: http://www.dunlap.utoronto.ca/missing-stars-in-the-solar-neighbourhood-
reveal-the-suns-speed-and-distance-to-the-centre-of-the-milky-way-galaxy/
83) RAVE (RAdial Velocity Experiment) is a survey of stars conducted at the Australian Astronomical Observatory (AAO) between 2003 and 2013. It measured the positions, distances, radial velocities and spectra of half-a-million stars—over two hundred thousand of which are included in Gaia data.
84) "Supermassive Black Hole Sagittarius A*, NASA, Aug. 29, 2013, URL: https://www.nasa.gov/mission_pages/chandra/multimedia/black-hole-SagittariusA.html
85) Jason A. S. Hunt, Jo Bovy, Raymond G. Carlberg, "Detection of a Dearth of Stars with Zero Angular Momentum in the Solar Neighborhood," The Astrophysical Journal Letters, Volume 832, Number 2 , published Nov. 23, 2016
86) "Gaia turns its eyes to asteroid hunting," ESA, Jan. 24, 2017, URL: http://sci.esa.int
/gaia/58706-gaia-turns-its-eyes-to-asteroid-hunting/
87) "Interactive and statistical visualization of Gaia DR1 with VAEX," ESA, Dec. 23, 2016, URL: http://www.cosmos.esa.int/web/gaia/iow_20161223
88) Maarten A. Breddels, "Interactive (statistical) visualization and exploration of a billion objects with vaex," Proceedings of the IAU Symposium No. 325 on Astroinformatics, Sept. 29 to Oct. 4, 2016, Sorrent, Italy, submitted on Dec. 12, 2016, URL: https://arxiv.org/pdf/1612.04183v1.pdf
89) "Happy 3rd birthday to Gaia!," ESA, Dec. 19, 2016, URL: http://www.cosmos.esa.int/web/gaia/news
90) "Virtual Milky Way," ESA, Operations image of the week, Nov. 10, 2016, URL: http://m.esa.int/spaceinimages/Images/2016/11/Virtual_Milky_Way
91) "Light curve of binary microlensing event detected by Gaia," ESA, Oct. 27, 2016, URL: http://sci.esa.int/gaia/58547-light-curve-of-binary-microlensing-event-detected-by-gaia/
92) "Gaia's first sky map, annotated," ESA, Sept. 14, 2016, URL: http://sci.esa.int
/gaia/58283-gaia-s-first-sky-map-annotated/
93) "Gaia's billion-star map hints at treasures to come," ESA, Sept. 13, 2016, URL: http://sci.esa.int
/gaia/58272-gaia-s-billion-star-map-hints-at-treasures-to-come/
94) "Gaia's second anniversary marked by successes and challenges," ESA, Aug. 16, 2016, URL: http://sci.esa.int/gaia/58135-gaia-s-second-anniversary-marked-by-successes-and-challenges/
95) "Mark your calendar: Gaia data release set for 14 September," ESA, July 4, 2016, URL: http://sci.esa.int/gaia/58042-mark-your-calendar-gaia-data-release-set-for-14-september/
96) D Milligan, P. Collins, R. Qedar, J. Marie, G. Whitehead, E. Serpell, C. Smith, M. Zambianchi, F. di Marco, A. Rudolph, "Automating Operations on ESA's Billion Star Surveyor Gaia Mission," Proceedings of the 14th International Conference on Space Operations (SpaceOps 2016), Daejeon, Korea, May 16-20, 2016, paper: AIAA 2016-2365, URL: http://arc.aiaa.org/doi/pdf/10.2514/6.2016-2365
97) "Gaia science alerts are back," ESA, March 7, 2016, URL: http://sci.esa.int
/gaia/57552-gaia-science-alerts-are-back/
98) "Celebrity comet spotted among Gaia's stars," ESA, Nov. 3, 2015, URL: http://www.esa.int/Our_Activities/Space_Science/Gaia/Celebrity_comet_spotted_among_Gaia_s_stars
99) D. Milligan, A. Rudolph, G. Whitehead, T. Loureiro, E. Serpell, F. di Marco, J. Marie, E. Ecale, "ESA's Billion Star Surveyor – Flight Operations Experience from Gaia's first 1.5 years," Proceedings of the 66th International Astronautical Congress (IAC 2015), Jerusalem, Israel, Oct.12-16, 2015, paper: IAC-15-B6.3.2
100) "Gaia's first year of scientific observations," ESA, August 25, 2015, URL: http://www.esa.int/Our_Activities/Space_Science/Gaia/Gaia_s_first_year_of_scientific_observations
101) "Counting stars with Gaia," ESA, July 3, 2015, URL: http://www.esa.int/Our_Activities/Space_Science/Gaia/Counting_stars_with_Gaia
102) "Surrounded by Gaia," ESA, June 30, 2015, URL: http://www.esa.int/spaceinimages/Images/2015/06/Surrounded_by_Gaia
103) "GBOT embarks on asteroid finding program," ESA, April 15, 2015, URL: http://www.cosmos.esa.int/web/gaia/news
104) "The GBOT asteroid finding program," URL: http://gbot.obspm.fr/pub/ast/
105) "Gaia honors Einstein by observing his Cross," ESA, image of the week, April 9, 2015, URL: http://www.cosmos.esa.int/web/gaia/iow_20150409
106) Ralf Kohley, "Cosmic rays on BAM CCDs data delivery note," ESA/ESAC, March 17, 2015, Document: Gaia-DE-TN-ESAC-RKO-033, URL: https://web.archive.org/web/20160316205041/https://gaia.esac.esa.int/archive-doc/docs/crays/GAIA-DE-TN-ESAC-RKO-033_issue_1_rev_0_(Cosmic_rays_on_BAM_CCDs_data_delivery_note).pdf
107) "Gaia," Status at end of January 2015, reported in Programs in Progress, ESA Bulletin No161, p. 69, May 11, 2015, URL: http://esamultimedia.esa.int/multimedia
/publications/ESA-Bulletin-161/offline/download.pdf
108) Dave Milligan, "A year on-station for Gaia," January 14, 2015, URL: http://blogs.esa.int/rocketscience/2015/01/14/a-year-on-station-for-gaia/
109) "Gaia discovers its first supernova," ESA, Sept. 12, 2014, URL: http://www.esa.int/Our_Activities/Space_Science/Gaia/Gaia_discovers_its_first_supernova
110) "Discovery of supernova Gaia14aaa," ESA, Sept. 12, 2014: URL: http://www.esa.int/spaceinimages/Images/2014/09/Discovery_of_supernova_Gaia14aaa
111) "Gaia mission status," ESA Bulletin, No 160, November 2014, p. 68
112) "Handover of the Gaia flag to mark start of science operations," ESA, August 4, 2014, URL: http://www.esa.int/spaceinimages/Images/2014/08
/Handover_of_the_Gaia_flag_to_mark_start_of_science_operations
113) "Gaia: 'Go' for Science," ESA, July 29, 2014, URL: http://www.esa.int/Our_Activities/Space_Science/Gaia/Gaia_Go_for_science
114) "Commissioning review: Gaia ready to start routine operations," ESA, URL: http://www.cosmos.esa.int/web/gaia/news_20140729
115) "Preliminary analysis of stray light impact and strategies," Update from the Gaia Project Team, June 16, 2014. URL: http://blogs.esa.int/gaia/2014/06/16
/preliminary-analysis-of-stray-light-impact-and-strategies/
116) "Gaia comes into focus," ESA, Feb. 6, 2014, URL: http://sci.esa.int/gaia/53653-gaia-comes-into-focus/
117) "The Experts behind Gaia's arrival at nothingness," ESA, Jan. 15, 2014, URL: http://www.esa.int/Our_Activities/Operations
/The_experts_behind_Gaia_s_arrival_at_nothingness
118) http://sci.esa.int/interactive/media/flashes/5_5_1.htm
119) http://www.esa.int/spaceinimages/Images/2014/01/Gaia_s_Lissajous_orbit
120) "Gaia enters its operational orbit," ESA, January 08,2014, URL: http://www.esa.int/Our_Activities/Space_Science
/Gaia/Gaia_enters_its_operational_orbit
The information compiled and edited in this article was provided by Herbert J. Kramer from his documentation of: "Observation of the Earth and Its Environment: Survey of Missions and Sensors" (Springer Verlag) as well as many other sources after the publication of the 4th edition in 2002. - Comments and corrections to this article are always welcome for further updates (herb.kramer@gmx.net).