GOES-R 2019 - 2017
Mission status in the period 2019-2017 for GOES-R
• August 1, 2019: GOES-17 Mishap Investigation Board Study Completed. A Mishap Investigation Board appointed by NASA and NOAA (National Oceanic and Atmospheric Administration) has identified the most likely cause for an instrument issue aboard NOAA’s Geostationary Operational Environmental Satellite (GOES)-17 satellite that launched March 1, 2018 from Cape Canaveral Air Force Station in Florida. 1)
- During postlaunch testing of the satellite’s Advanced Baseline Imager (ABI), teams discovered the instrument’s infrared detectors could not be maintained at the required temperatures during some orbital conditions, which resulted in a partial loss of three of the instruments 16 bands during certain times of the year.
- The ABI is GOES-17’s primary instrument for imaging Earth’s weather, oceans, and environment. It views the Earth with 16 spectral bands including two visible, four near-infrared, and 10 infrared channels.
- The mishap board was tasked with gathering and analyzing information, and identifying the proximate causes, root causes, and contributing factors related to the ABI performance issues. It concluded the most likely cause of the ABI cooling issue is a blockage in the instrument’s loop heat pipes, which transfer heat from the ABI electronics to its radiator. The blockage restricted the flow of coolant in the loop heat pipes, causing the ABI to overheat and reducing the sensitivity of infrared sensors.
- NOAA and NASA have adjusted the instrument operations, and are working to improve the quality of the data in order to reduce the impact of the cooling issue.
- GOES-17, in the GOES-West position, is helping forecasters track weather from torrential rain events to wildfires and other environmental hazards throughout the U.S. western region, including California, Alaska and Hawaii. Also, GOES-17 is monitoring typhoons in the eastern Pacific Ocean, including Hawaii.
- The Mishap Investigation Board Summary Report is available online at: https://www.nasa.gov/sites/default/files/atoms/files/goes-17_mib_releasable_summary_final.pdf
- GOES-17 is one in a series of NOAA’s next generation geostationary weather satellites which include GOES-16, 18 and 19. The advanced instrument technology used on these satellites will result in more timely and accurate forecasts and warnings. It will improve support for the detection and observations of meteorological phenomena. The GOES-R Series program is a collaborative development and acquisition effort between NOAA and NASA to develop, launch and operate the geostationary weather satellites.
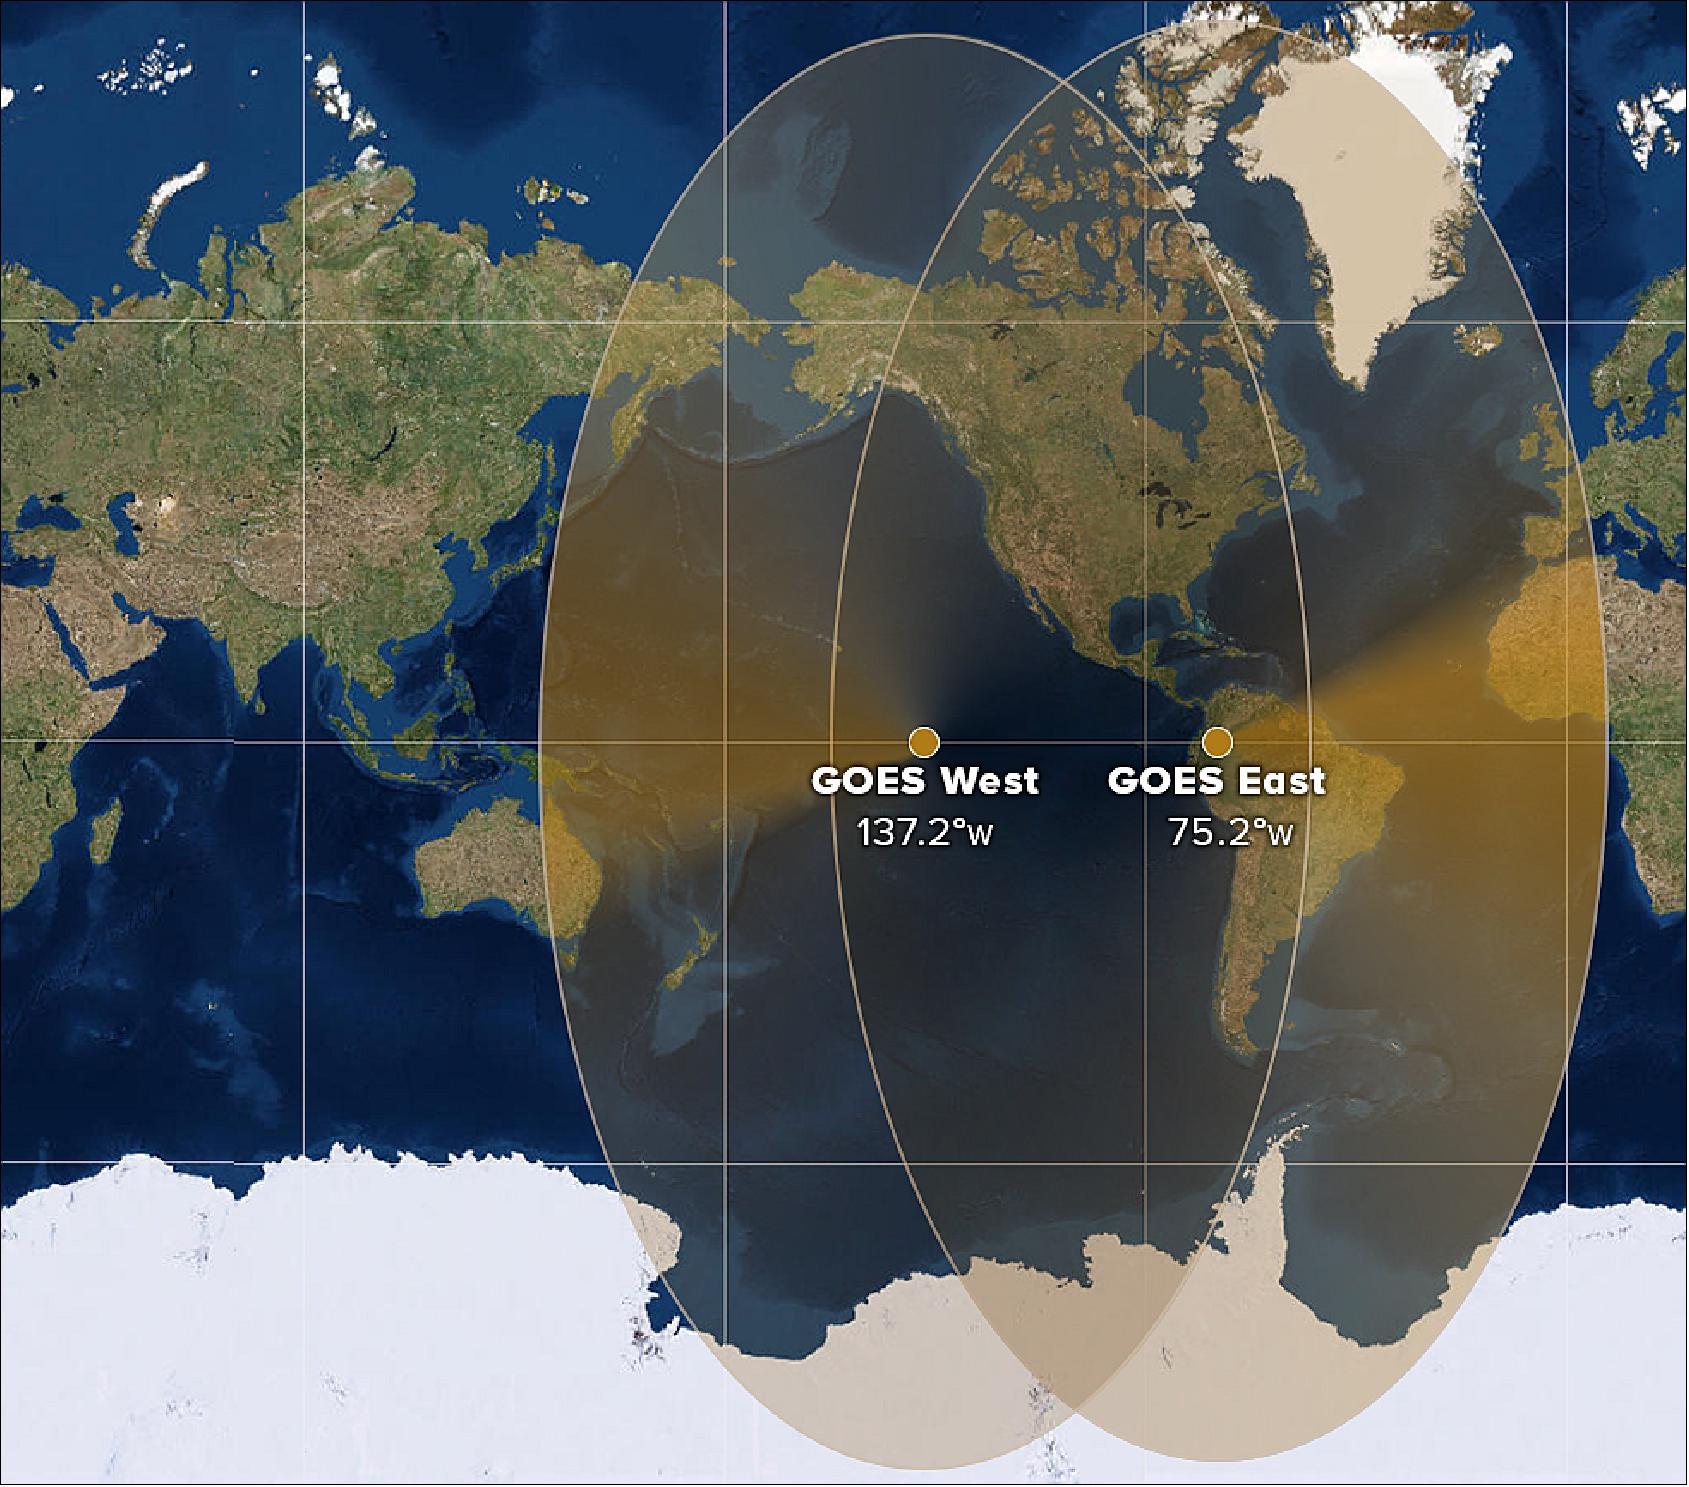
• February 12, 2019: GOES-17 is now operational as NOAA’s GOES West satellite. In its new role, GOES-17 will serve as NOAA’s primary geostationary satellite for detecting and monitoring Pacific storm systems, fog, wildfires, and other weather phenomena that affect the western United States, Alaska, and Hawaii. 2)
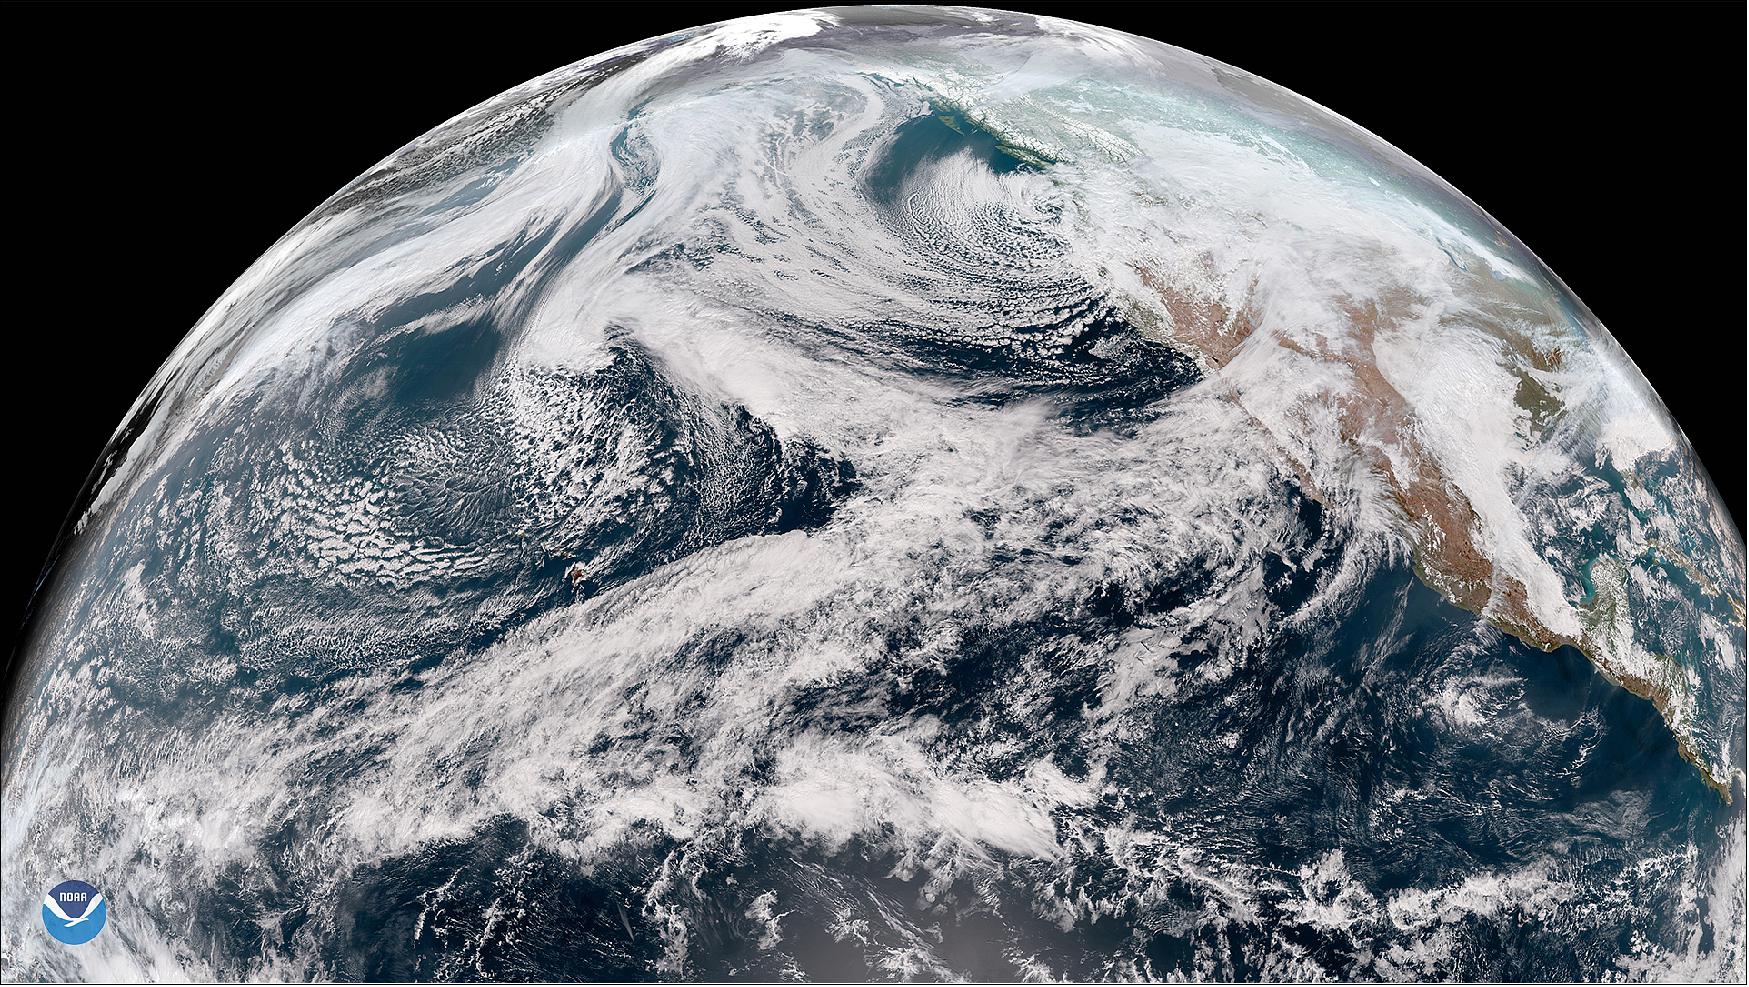
- The latest milestone for GOES-17 comes exactly eleven months after the satellite first reached its geostationary orbit at 35,780 km above Earth. Launched March 1, 2018, GOES-17 is NOAA’s second advanced geostationary weather satellite and the sister satellite to GOES-16 (also known as GOES East). Together the two satellites provide high-resolution visible and infrared imagery as well as lightning observations of more than half the globe – from the west coast of Africa to New Zealand, and from near the Arctic Circle to the Antarctic Circle.
- Better weather forecasts for the Western U.S.: GOES-17 has already been helping forecasters track the weather and other environmental hazards in places like California, Alaska and Hawaii. The satellite began transmitting its first images from its new orbital position in November 2018. Since then, forecasters have been using GOES-17 data to see weather forming over the northeastern Pacific Ocean, where many weather systems that affect the continental U.S. first form.
- Until recently, high-quality data coverage of the Pacific Ocean was sparse. Now that GOES-17 data is available, however, forecasters have access to more detailed views of high-impact weather systems and other environmental hazards like wildfire smoke and volcanic ash.

- For example, GOES-17 helps forecasters predict the intensity and impact of Pacific storms that hit the West Coast. These include atmospheric river events that bring heavy rain and high-elevation snow to California and the Pacific Northwest, especially during the winter months.
- In Hawaii and the central Pacific Ocean, GOES-17’s high-resolution visible and infrared imagery will improve hurricane forecasts and allow meteorologists to better predict areas of intense rainfall. In 2018, Hawaii set a new national rainfall record when 49.69 inches of rain fell in 24 hours. The state also faced several tropical weather threats in what became an active hurricane season in the Central and Eastern Pacific.

- Forecasters in Hawaii and other remote territories like the Marshall Islands and American Samoa are also now able to track thunderstorms in real-time. The Geostationary Lightning Mapper (GLM) on-board GOES-17 helps forecasters determine when thunderstorms and convective weather events are intensifying or becoming more dangerous. In 2018, the National Weather Service began using GLM data to issue severe thunderstorm warnings and keep the public out of harm’s way.
- Tracking wildfires. Among the benefits of GOES-17’s high-resolution and rapid-scan capability is its ability to detect wildfires and monitor smoke coverage in near real-time. The dry climate of the western U.S. makes the region especially vulnerable to wildfires. In 2018, for example, California faced one of its deadliest and most destructive wildfire seasons on record.
- Providing high-definition images as often as every minute, GOES-17 helps forecasters distribute critical information to firefighters and emergency managers that saves lives. Real-time imagery of smoke plumes from fires also improves air quality forecasts.
- GOES-17 has been especially valuable to Alaska, where NOAA’s older geostationary satellites provided far less coverage. The state’s vast territory and sparse population mean that Earth-based observations from radar, aircraft and buoys, are limited.
- The satellite’s combinable image channels (known as “multispectral imagery”) help forecasters distinguish between clouds, snow-covered ground and sea ice around Alaska’s coasts. These advanced imaging capabilities mean safer, more accurate aviation and shipping forecasts, especially during Alaska’s long, dark winter months, when visible satellite imagery is less useful.
- “In my nearly six years forecasting here, I have never seen a product revolutionize our ability to forecast the way GOES-17 has,” said Michael Ottenweller, a National Weather Service forecaster at the Anchorage, Alaska field office. “The advent of GOES over our domain makes forecasting tangibly easier and better.”
- Ottenweller described a recent experience forecasting fog over southwestern Alaska. Before GOES-17 data was available, forecasters would have to wait for data from polar-orbiting satellites passing over Alaska. “Now, not only do I have reliable data, but I can loop that data. This changes everything,” said Ottenweller. “We are excited to see what [GOES-17] brings for the convective and fire weather season.”
- Fog and icy conditions often cause flight delays and impact airport operations. At Ted Stevens International Airport in Anchorage, fog occurs almost daily during winter. The airport is the second-busiest cargo airport in the U.S. and fourth-busiest in the world, which makes understanding the timing of fog and low clouds especially important. Just as GOES-16 data helped airlines mitigate flight delays at San Francisco International Airport in early 2017, GOES-17 data will help forecasters to predict when fog will form and clear with much greater accuracy.

- Among GOES-17’s many benefits to Alaska is the satellite’s ability to track volcanic ash clouds. Data from GOES-17 makes it easier to determine the site of an eruption, as well as the height and direction in which an ash cloud is moving. Forecasters share this information with other agencies, such as the Alaska Aviation Weather Unit and the U.S. Geological Survey’s Alaska Volcano Observatory to issue volcanic ash advisories and other warnings to keep air travel safe.
- GOES-15 and GOES-17 working in unison. Now that it is operational, GOES-17 replaces GOES-15 as NOAA’s GOES West satellite. The latter entered service in December 2011. However, due to technical issues with GOES-17’s Advanced Baseline Imager – or ABI, the satellite’s main instrument – GOES-15 and GOES-17 will operate in unison until early July 2019. The overlap will allow scientists and engineers to make sure that GOES-17 is performing adequately before the older GOES-15 satellite gets placed in storage as a backup.
- “The GOES-17 ABI is now projected to deliver more than 97 percent of the data it was designed to provide, a testament to the skill and dedication of the engineers and all the GOES project team members,” said Stephen Volz, Ph.D., director, NOAA’s Satellite and Information Service. “We are confident the GOES constellation will continue to meet the needs of forecasters across the country.”
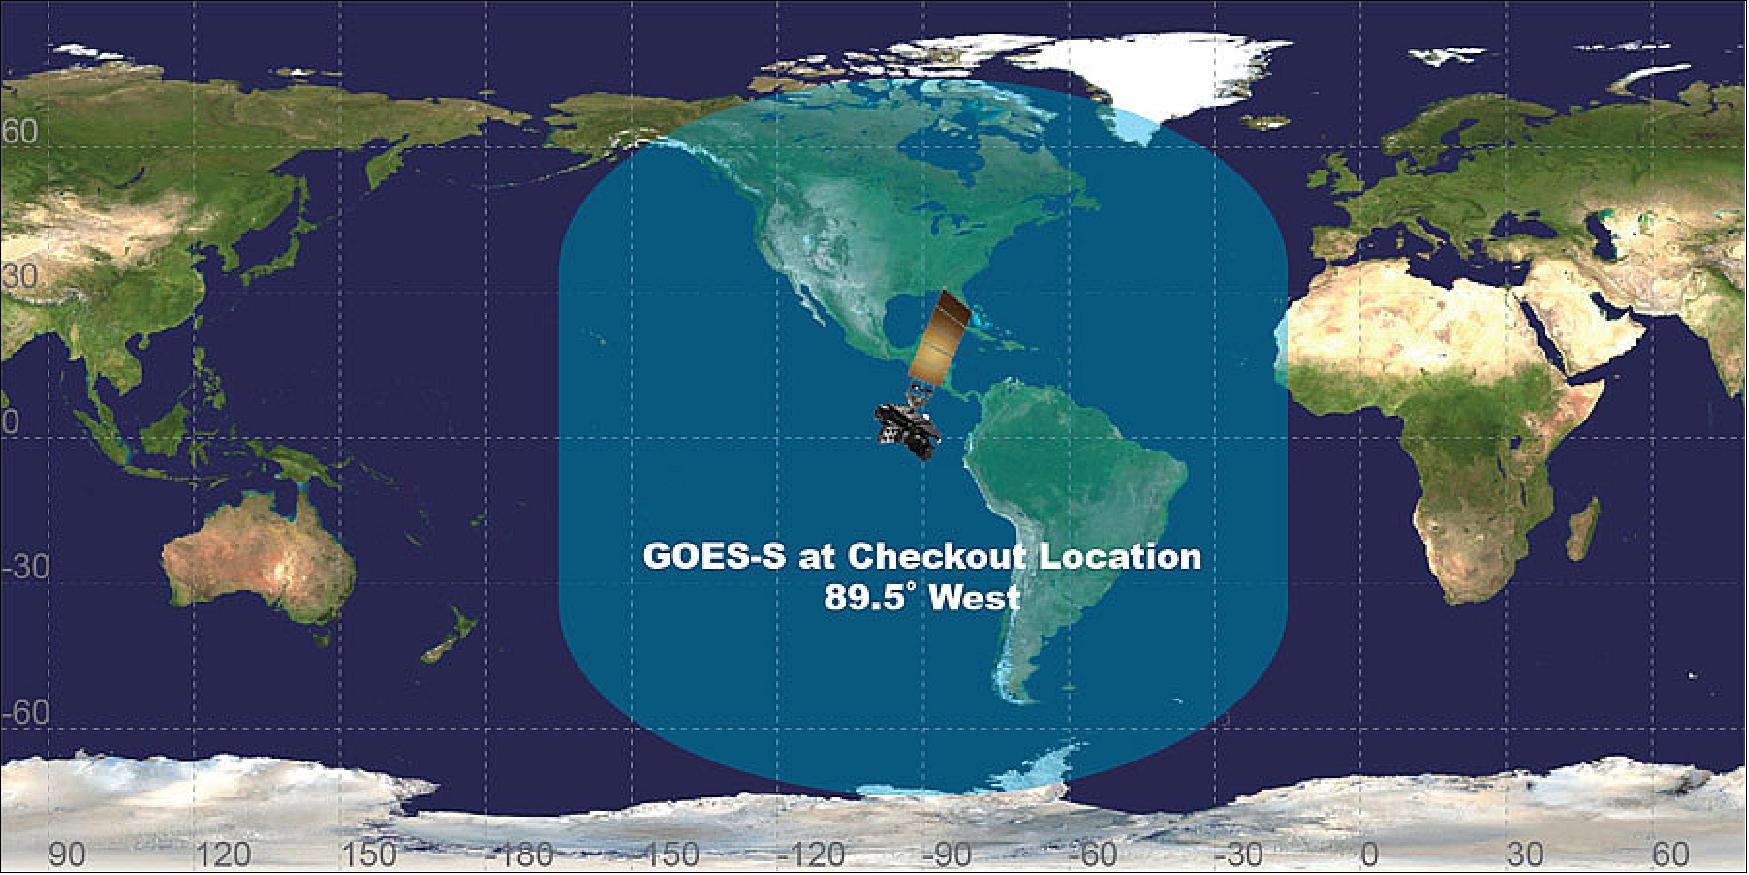
• October 22, 2018: NOAA’s GOES-17 satellite (former GOES-7) is getting ready to move to its new vantage point at 137.2º west longitude, allowing us to see the weather at high resolution in the western U.S., Alaska and Hawaii, and much of the Pacific Ocean. 3)
- For the past seven months, the satellite has been in a temporary position – at 89.5º west longitude – known as its on-orbit checkout location. Since then, scientists have been testing and calibrating GOES-17’s instruments so it is ready for “prime time” when the satellite becomes operational.
- But before that happens, GOES-17 first has to move to its new orbital position over Earth’s equator at 137.2 degrees west longitude. This relocation process, known as “drift,” will take about three weeks to complete.
- On October 24, at 1:40 p.m. EDT, GOES-17 will begin moving westward – at a rate of 2.5º longitude per day – until it reaches its new position on November 13.
- During the drift period, five of GOES-17's instruments (ABI, GLM, SUVI, SEISS and EXIS) will not be collecting or sending us any data. These are the high-tech sensors we use to see clouds at high resolution, map lightning flashes, or monitor solar flares from space. Other features, including the Search and Rescue Satellite-Aided Tracking (SARSAT) system will also be disabled.
- How exactly do these satellites physically get moved from point A to point B thousands of miles above Earth? -NOAA's Office of Satellite Product and Operations team can plan all of these maneuvers using navigation software. For a satellite to change its orbital position, it follows a series of commands uploaded by the operations team to the spacecraft's memory. The mission operations center validates and rehearses these maneuver sequences on the ground using a satellite simulator.
- Normally, satellites maintain the same distance from Earth while operational and transmitting data. During drift, however, GOES-17's altitude will actually be raised slightly (by about 125 miles). This maneuver helps nudge the satellite to begin moving into its new orbital position. After GOES-17 finishes drifting, NOAA's mission operations team will lower the satellite back to its normal operating altitude. This raising and lowering process is used any time a geosynchronous satellite needs to change orbital positions.
- When GOES-17 reaches 137.2º west on November 13, the satellite’s instruments won’t be turned on right away. First, a team of scientists will have to calibrate the instruments to ensure everything is working properly. If everything checks out, the transmitters on-board the spacecraft will be turned back on.
- The next big milestone comes November 15, 2018. That’s when GOES-17 will start sending imagery and data via the GOES Rebroadcast System, and we’ll start seeing the first views of Alaska, Hawaii and the Pacific Ocean from GOES-17’s new orbital position. It will be an exciting day for all of us satellite enthusiasts, but the satellite won’t officially be operational just yet. First, GOES-17 will undergo three more weeks of testing to make sure it’s ready for “prime time.” If everything is working properly, GOES-17 will go into operations as NOAA’s GOES West satellite on December 10, 2018.
- GOES-17 will considerably improve weather forecasting capabilities across the western United States, particularly in Alaska. “With GOES-17, we will have unprecedented coverage of Alaska from geostationary orbit. The GOES-17 imager has four times the resolution of the previous GOES imager, which will make a substantial difference in northern latitudes,” said Dan Lindsey, senior scientific advisor to the GOES-R Series Program. “GOES-17 is going to provide significant benefit for monitoring hazards often experienced in Alaska such as wildfires, volcanic ash, snow and sea ice.”
- As the sister satellite to GOES-16, located in the GOES East position, GOES-17 will extend high-resolution satellite coverage from the west coast of Africa across much of the Pacific Ocean.
The GOES-15 drift
- Around the same time that GOES-17 starts to drift, NOAA’s current GOES West satellite, GOES-15, will also move to a new orbital home in order to “make room” for the newcomer. Currently, GOES-15 is keeping watch over the Western U.S. and the Pacific Ocean from 135º west longitude. On October 23, one day before the GOES-17 drift begins, GOES-15 will start its own orbital relocation. While GOES-17 will move west, GOES-15 will be moving east at a rate of 0.88º longitude per day until it reaches its new orbital position at 128º west.
- Because it won’t need to move as far as GOES-17, the GOES-15 drift will only take nine days to complete. The latter satellite will reach its new orbital position on November 1. Unlike GOES-17, all of GOES-15’s instruments will remain on during the drift, and the satellite will continue to capture and send data back to Earth.
Tandem operations
- Although GOES-15 will hand its “GOES West” title to GOES-17 in mid-December 2018, the former satellite won’t fade into sunset right away. Due to the technical issues with GOES-17’s Advanced Baseline Imager (or ABI, the satellite’s primary instrument), NOAA plans to operate GOES-15 and GOES-17 in tandem for at least six months. This will allow scientists to see how well GOES-17 is working as the new GOES West operational satellite.
- While GOES-17 will experience data outages from some of its infrared channels overnight during the warmest parts of the year (before and after the vernal and autumnal equinox, when the instrument absorbs the highest amount of solar radiation), a team of experts has made excellent progress optimizing the performance of the instrument through operational changes.
- “The GOES-17 ABI is now projected to deliver more than 97 percent of the data it was designed to provide, a remarkable recovery,” said Pam Sullivan, System Program Director for the GOES-R Series Program. “We are confident the GOES constellation will continue to meet the needs of forecasters across the country.”
- Looking ahead, NOAA is also implementing changes to the ABI on its future geostationary satellites, GOES-T and GOES-U, to reduce the risk of cooling system anomalies that were seen in GOES-17. The instrument radiator is being redesigned to improve its reliability. Due to this redesign, the planned launch of GOES-T in mid-2020 will be delayed. Once the new ABI radiator design is approved, NOAA will determine a new launch readiness date.
- But before then, atmospheric scientists and weather enthusiasts can look forward to GOES-17’s next-generation imagery of developing storms, wildfires, and other environmental phenomena in Alaska, Hawaii, and much of the Pacific Ocean extending all the way to New Zealand. We’ll start seeing these views shortly after GOES-17 completes the journey to its new orbital position at 137.2º west – the future home of NOAA’s new GOES West satellite.
• October 2, 2018: NASA and NOAA have appointed a board to investigate an instrument anomaly aboard the Geostationary Operational Environmental Satellite (GOES-17, former GOES-S) weather satellite currently in orbit. 4)
- During postlaunch testing of the satellite’s Advanced Baseline Imager (ABI) instrument, it was discovered that the instrument’s infrared detectors cannot be maintained at their required operating temperatures under certain seasonal and orbital conditions, resulting in a loss of approximately three percent of the instrument’s availability over the course of a year. This loss exceeds a key design requirement.
- NASA and NOAA senior leadership have determined the need to convene the mishap investigation board, which will work to determine the root or proximate cause of the anomaly and identify actions to prevent occurrences on future satellites. The board will begin its work as soon as possible.
- GOES-17 is one of several next-generation weather satellites in the GOES-R series, including GOES-16, which currently serves as the operational geostationary weather satellite over the U.S. East coast. Later this year, GOES-17 will become operational as the GOES West satellite. Two additional satellites, GOES-T and GOES-U, are currently in development. The advanced instrument technology used on these satellites is contributing to more timely and accurate weather forecasts and warnings.
- The GOES-R Series program is a collaborative effort between NOAA, NASA and industry partners. NOAA manages the GOES-R Series program through an integrated NOAA/NASA office at NASA’s Goddard Space Flight Center in Greenbelt, Maryland. NASA also oversees the acquisition of the spacecraft, instruments and launch vehicles. Mission operations are performed by NOAA at the NOAA Satellite Operations Facility in Suitland, Maryland.
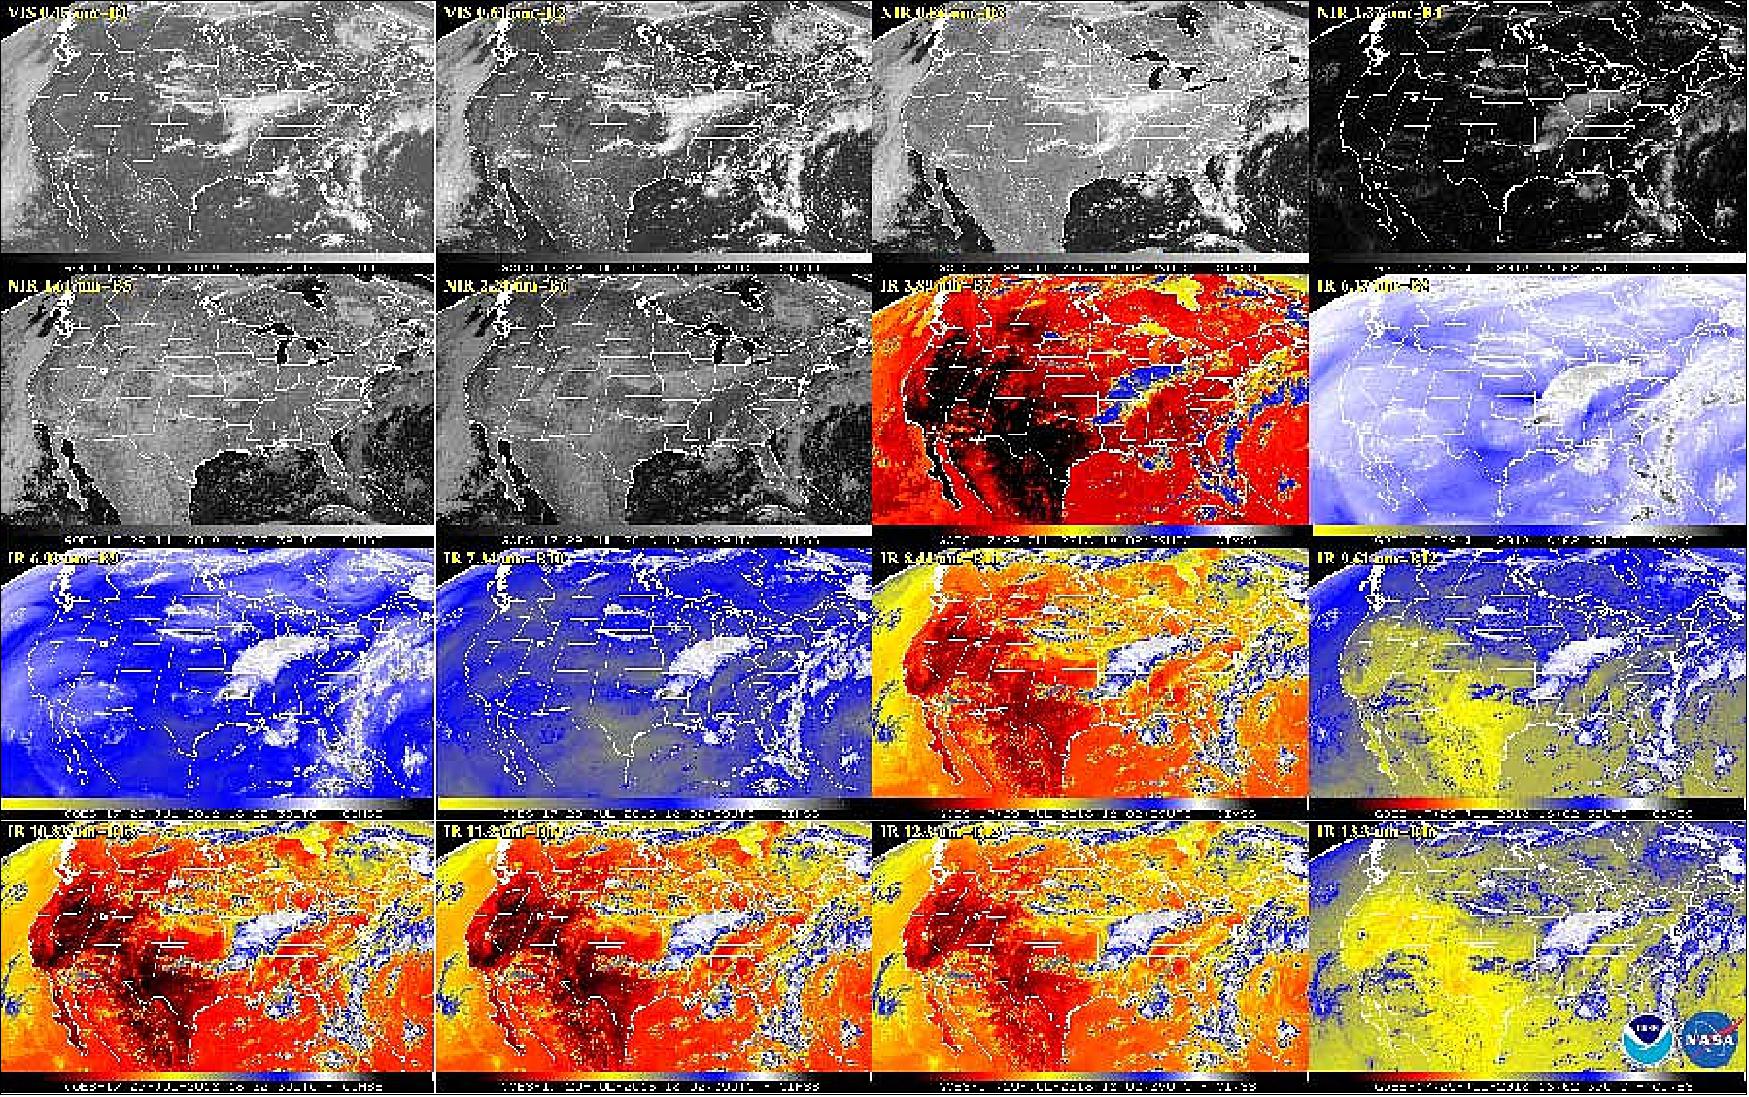
• August 8, 2018: While experts continue addressing an issue with the cooling system of GOES-17’s Advanced Baseline Imager (ABI), they have made progress in increasing the available observing time of the affected infrared channels. Due to adjustments in operating procedures, the ABI is demonstrating improved performance from initial observations. 5)
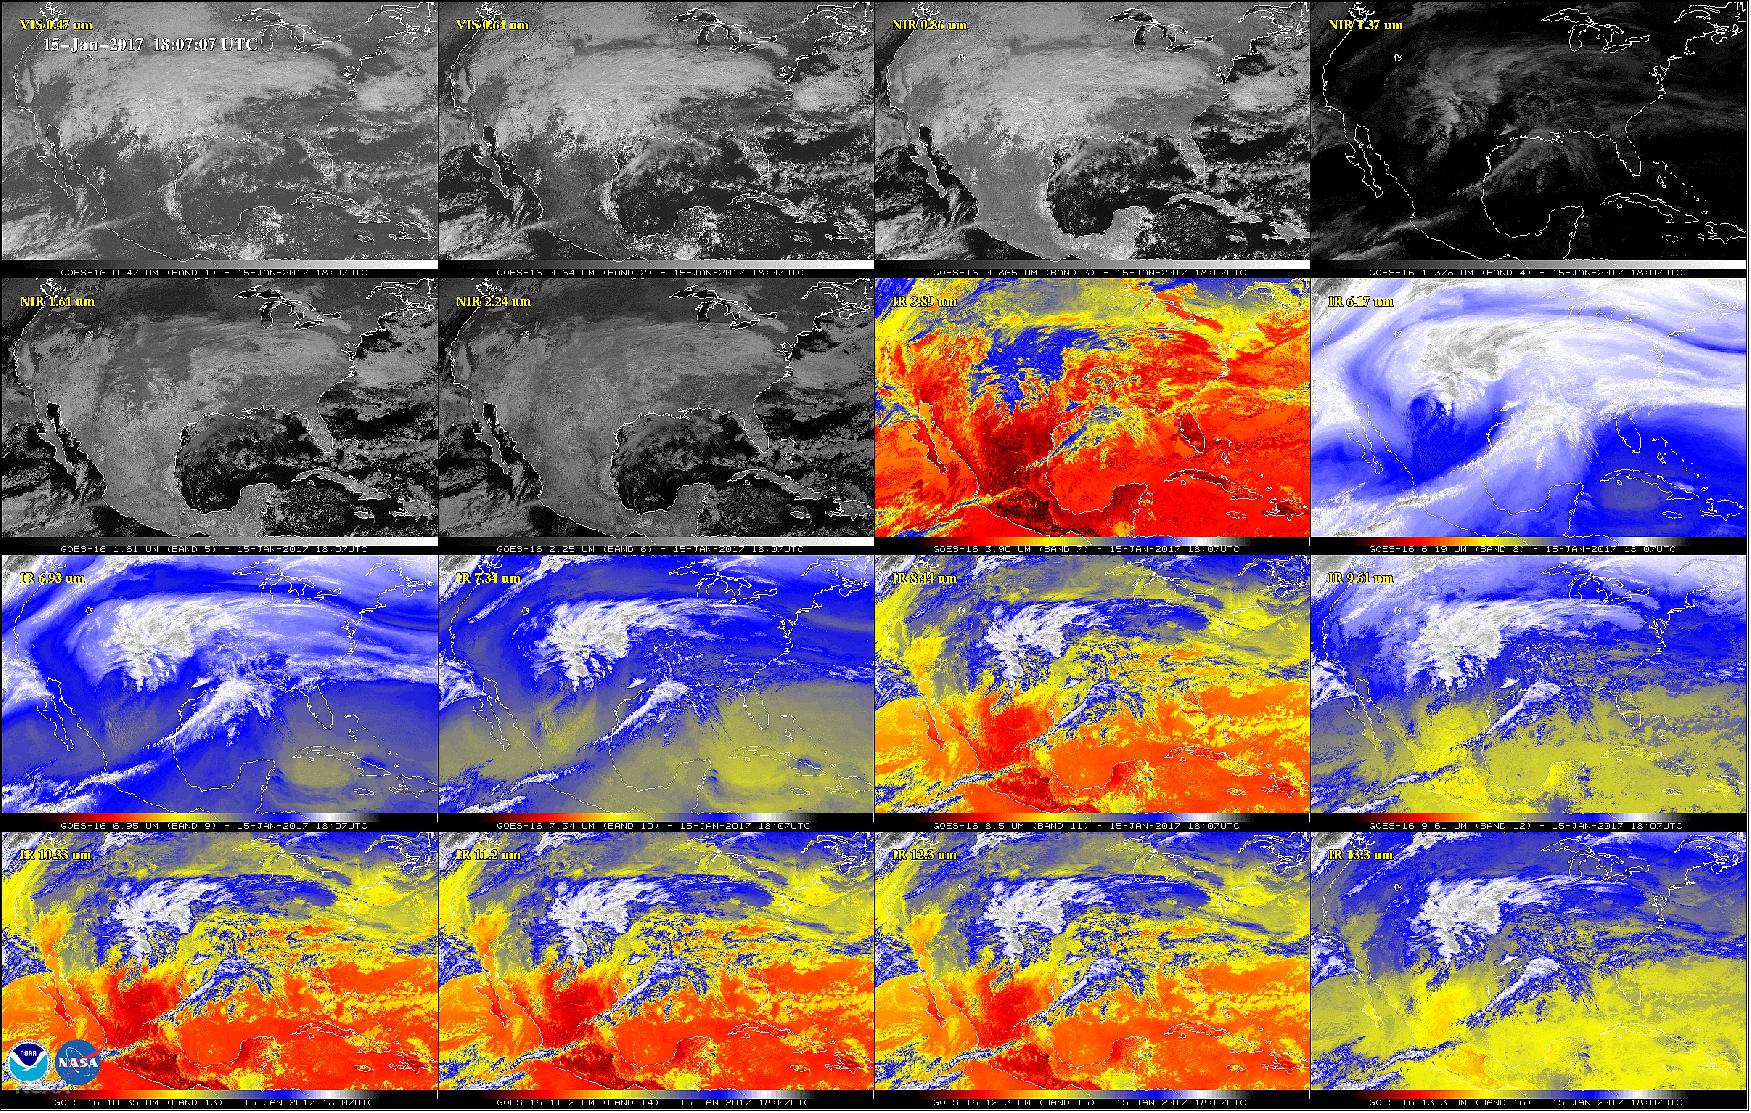
- This new imagery shows data are currently available from all 16 ABI channels. Channel availability will fluctuate seasonally depending on the amount of solar radiation absorbed by the instrument. During the instrument’s “cool” seasons (near the summer and winter solstice), all channels are expected to be available 24 hours per day. During the instrument’s “warm” seasons (before and after the vernal and autumnal equinox), experts estimate 7 channels (bands 1-7) will be available 24 hours per day and the other 9 channels (bands 8-16) will have outages of 2-6 hours per night. These estimates are preliminary and are still being refined. The warmest part of the season is coming up in early September and performance estimates will need to be confirmed through observation during that time.
- Infrared imagery is used to monitor aerosols, clouds, thunderstorms, hurricanes, rainfall, moisture, atmospheric motion, and volcanic ash. Among the channels that are expected to be fully available is the band that is used for fog/cloud identification at night and for fire/hot spot detection, which will be critical for forecasters in the western U.S.
- NOAA plans to move GOES-17 into operational service in late 2018. The operational configuration will be determined in consultation with the NOAA Office of Satellite and Product Operations, the National Weather Service, and other stakeholders. GOES-17 is currently observing with more channels, at a higher resolution, and with more rapid refresh than what is available from the current GOES West satellite. While the GOES-17 imager will not produce the full set of planned data, it will provide more and better data than currently available. Experts are confident the GOES constellation will continue to meet the operational needs of the National Weather Service and forecasters across the nation.
- While experts continue addressing an issue with the cooling system of GOES-17’s Advanced Baseline Imager (ABI), they have made progress in increasing the available observing time of the affected infrared channels. Due to adjustments in operating procedures, the ABI is demonstrating improved performance from initial observations.
- This new imagery shows data are currently available from all 16 ABI channels. Channel availability will fluctuate seasonally depending on the amount of solar radiation absorbed by the instrument. During the instrument’s “cool” seasons (near the summer and winter solstice), all channels are expected to be available 24 hours per day. During the instrument’s “warm” seasons (before and after the vernal and autumnal equinox), experts estimate 7 channels (bands 1-7) will be available 24 hours per day and the other 9 channels (bands 8-16) will have outages of 2-6 hours per night. These estimates are preliminary and are still being refined. The warmest part of the season is coming up in early September and performance estimates will need to be confirmed through observation during that time.
- Infrared imagery is used to monitor aerosols, clouds, thunderstorms, hurricanes, rainfall, moisture, atmospheric motion, and volcanic ash. Among the channels that are expected to be fully available is the band that is used for fog/cloud identification at night and for fire/hot spot detection, which will be critical for forecasters in the western U.S.
- NOAA plans to move GOES-17 into operational service in late 2018. The operational configuration will be determined in consultation with the NOAA Office of Satellite and Product Operations, the National Weather Service, and other stakeholders. GOES-17 is currently observing with more channels, at a higher resolution, and with more rapid refresh than what is available from the current GOES West satellite. While the GOES-17 imager will not produce the full set of planned data, it will provide more and better data than currently available. Experts are confident the GOES constellation will continue to meet the operational needs of the National Weather Service and forecasters across the nation.
• On March 12, 2018, GOES-S executed its final liquid apogee engine burn, placing the satellite in geostationary orbit at an altitude of 35,786 km. GOES-S is now GOES-17! The satellite will be called GOES-17 for the remainder of its lifespan. GOES satellites are designated a letter prior to launch and renamed with a number once they achieve geostationary orbit. 6)
- On March 13, GOES-17 will perform its second stage solar array deployment, releasing the solar array yoke and solar pointing platform. In the days that follow, several maneuvers will be conducted to put GOES-17 in its 89.5º west longitude checkout position. Finally, the magnetometer boom will be deployed. Post-launch testing and calibration is scheduled to begin on March 26. The first imagery from the satellite is expected in mid-May.
- GOES-17 will undergo a six-month on-orbit checkout of its instruments and systems, followed by operational handover procedures. The satellite move to its operational location at 137º west longitude is planned for late 2018 to become NOAA’s GOES West.
- GOES-17 will provide faster, more accurate, and more detailed data in near realtime to track storm systems, lightning, wildfires, coastal fog, and other hazards that affect the western U.S., Hawaii and Alaska. An operational GOES-17 will give the Western Hemisphere two next-generation geostationary satellites. Together, GOES-16 and GOES-17 will keep an eye on weather and environmental hazards from the west coast of Africa all the way to New Zealand.
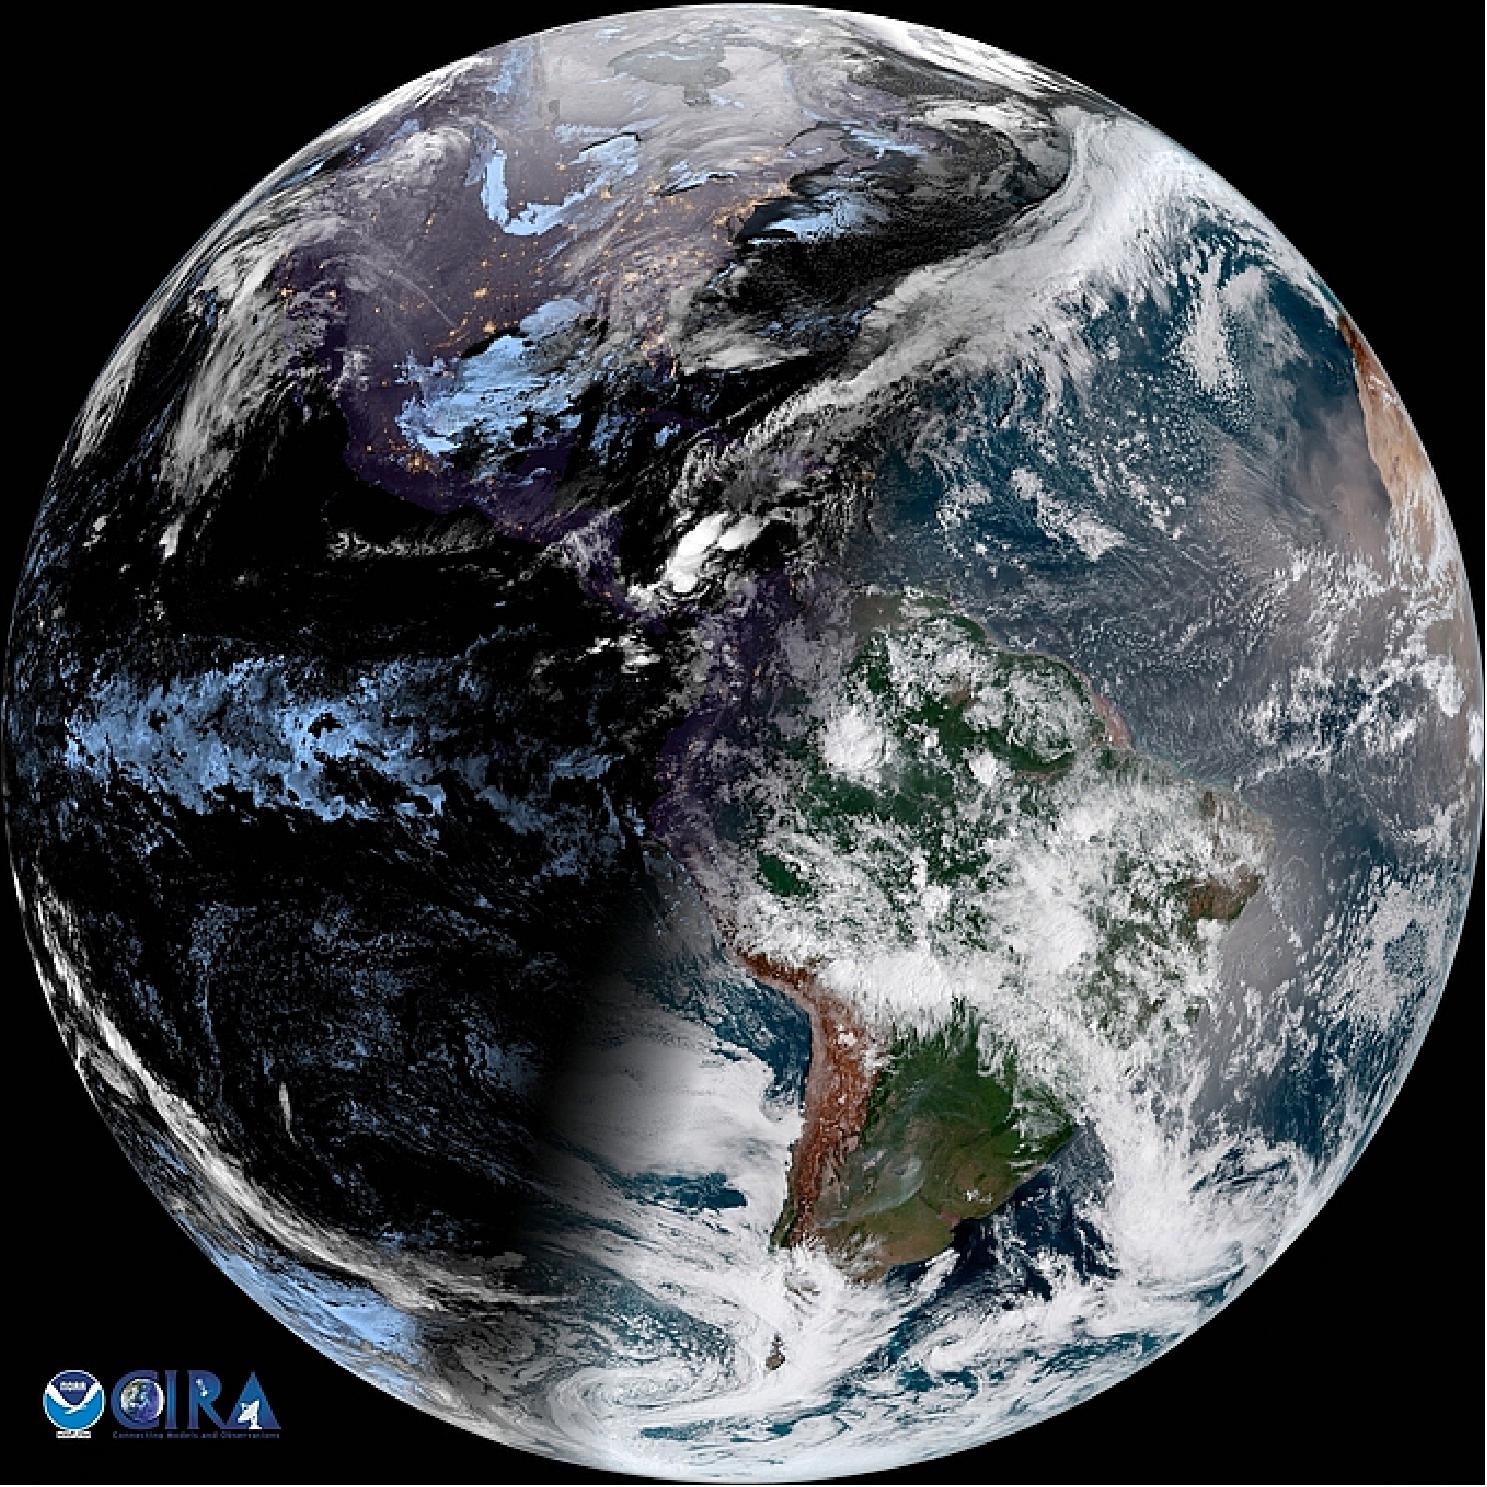
• March 1, 2018: NOAA offers a GOES-East full disk view in Geocolor. 7)
Legend to Figure 10: Geocolor is a multispectral product composed of True Color (using a simulated green component) during the daytime, and an Infrared product that uses bands 7 and 13 at night. During the day, the imagery looks approximately as it would appear when viewed with human eyes from space. At night, the blue colors represent liquid water clouds such as fog and stratus, while gray to white indicate higher ice clouds, and the city lights come from a static database that was derived from the VIIRS Day Night Band.
Geocolor was developed at the Cooperative Institute for Research in the Atmosphere (CIRA) and STAR's Regional and Mesoscale Meteorology Branch (RAMMB).
• December, 2017: GOES-East Image Viewer. Now in its new GOES-East position, the advanced GOES-16 satellite has officially joined NOAA’s operational observation network, providing forecasters with sharper, more defined images of severe storms, hurricanes, wildfires and other weather hazards in near real-time 24/7. 8)
- You can view the latest, stunning imagery from GOES-East via NOAA's new GOES-East Image Viewer. The Viewer provides "full disk" views of Earth (covering the Western Hemisphere) as well as views of the continental US and adjacent waters (CONUS). Finally, the viewer also provides "mesoscale" imagery — views of small regional or areas that can help reveal significant environmental features.
Legend to Figure 11: While derived from operational satellites, the data, products, and imagery available on this website are intended for informational purposes only. This website is supported on a Monday-Friday basis, so outages may occur without notice and may not be immediately resolved. Neither the website nor the data displayed herein are considered operational, and should not be used to support operational observation, forecasting, emergency, or other disaster mitigation or response operations, either public or private.
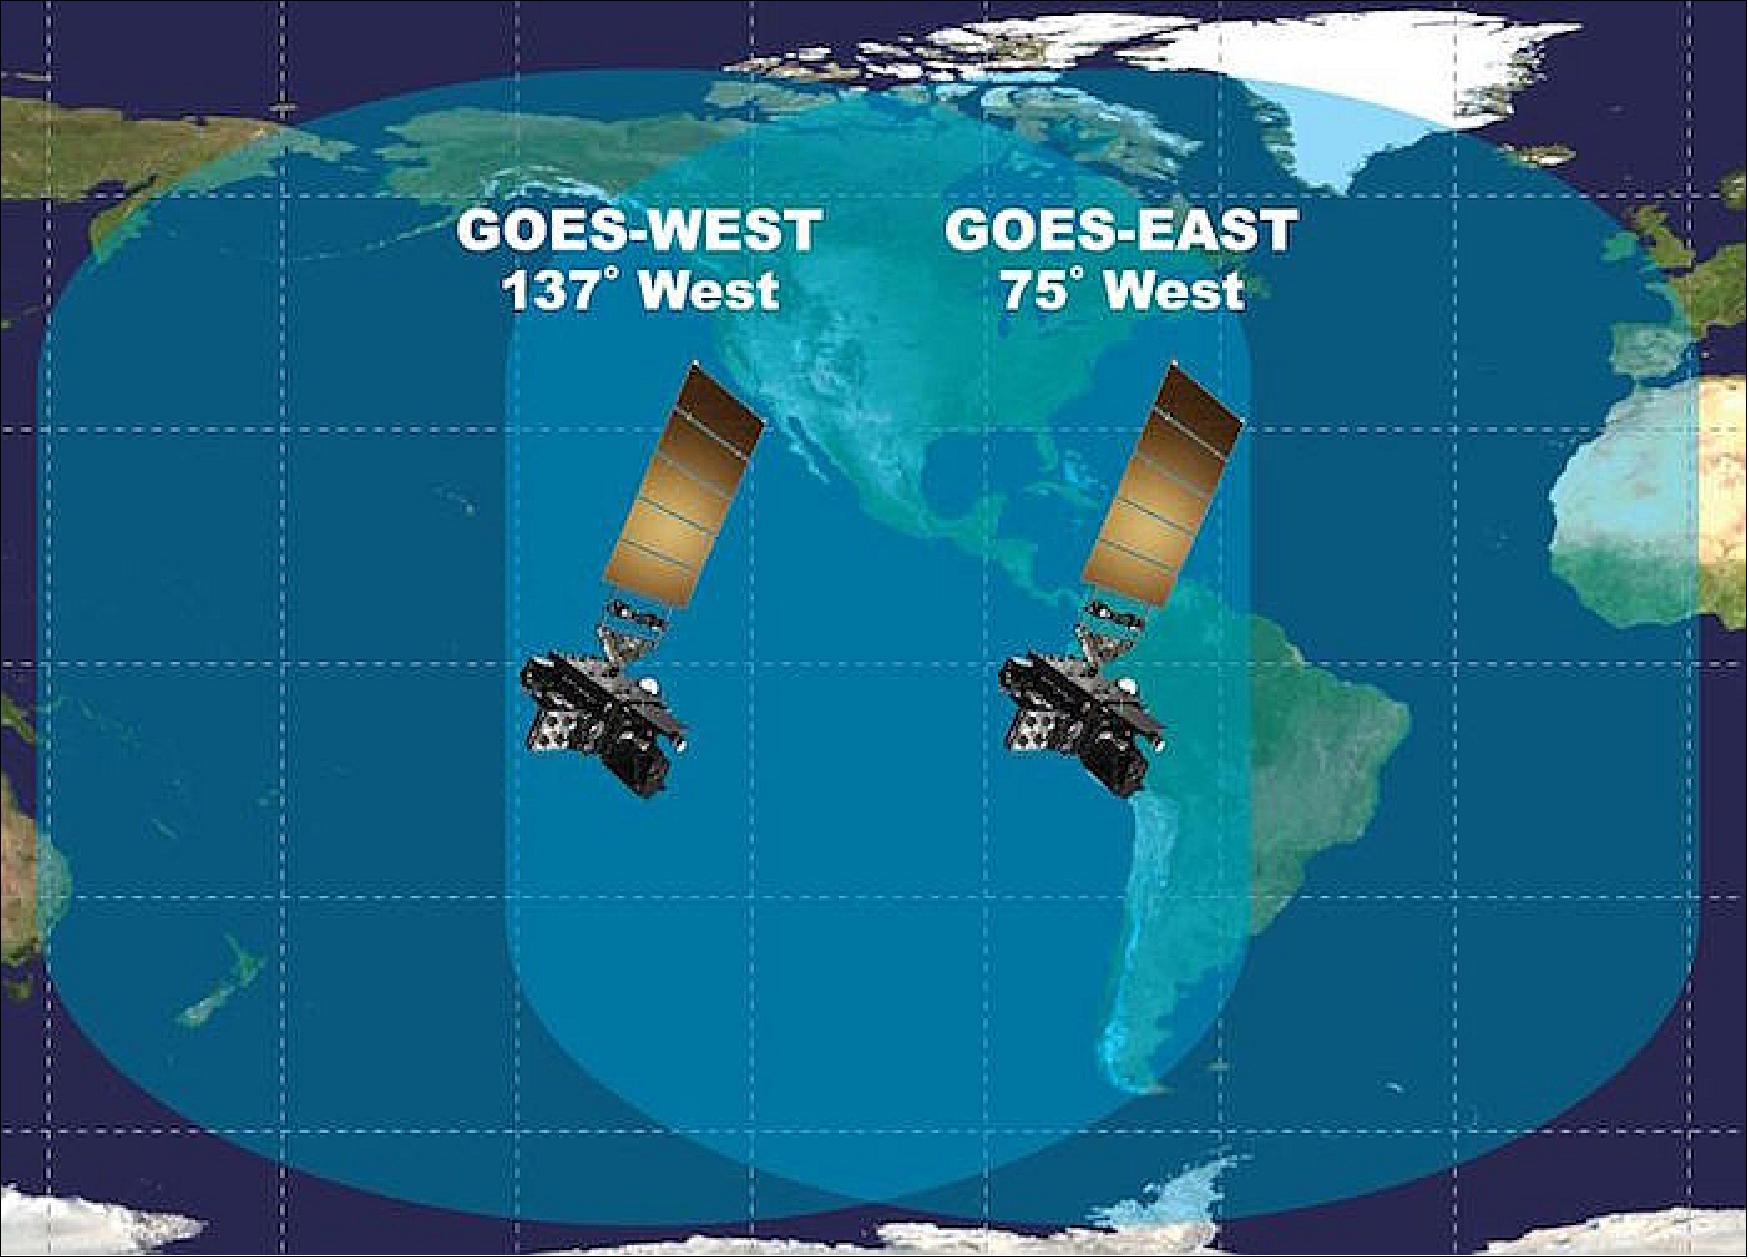
• December 18, 2017: NOAA's GOES-16 weather satellite declared operational. Now in its new GOES-East position at 75.2º W, the advanced GOES-16 satellite has officially joined NOAA’s operational observation network, providing forecasters with sharper, more defined images of severe storms, hurricanes, wildfires and other weather hazards in near realtime 24/7. 9)
- “The GOES-16 satellite provided invaluable data on deadly hurricanes long before they touched the shore this season,” said Secretary of Commerce Wilbur Ross. “As it becomes fully operational, GOES-16 will continue to monitor extreme weather events, safeguarding American lives and property from its perch thousands of miles above the Earth.”
- Since its launch in November 2016, NOAA’s GOES-16, even in its testing stage, showed its potential to improve weather forecasts and brought new levels of situational awareness to forecasters, emergency managers, and the public. The satellite covers most of North America – all of the continental U.S., Mexico and most of Canada, from 35,786 km above the Earth.
- “GOES-16 has proven to be one of the most important tools we’ve ever developed for our weather and hazard forecasts,” said retired Navy Rear Adm. Timothy Gallaudet, Ph.D., acting NOAA administrator. “From its impressive first image of Earth last January to monitoring tropical storms and wildfires, GOES-16 has and will continue to greatly improve our ability to visualize potential threats, and enhance forecasts and warnings to save lives and protect property.”
- GOES-16 provided critical data which enabled emergency preparations and response during this year’s extremely active hurricane season. The new satellite delivered experimental imagery with detail and clarity never achieved before. Its high resolution – four times higher than previous NOAA satellites – and views of Earth taken every 30 seconds allowed forecasters to monitor how and when storms developed. Data from GOES-16 allowed forecasters to better assess and predict how much rain Hurricane Harvey would produce over Texas and see its rapid intensification, along with hurricanes Irma, Jose, and Maria.
- GOES-16 data helped monitor and detect wildfires, and gave forecasters detailed images of wildfire smoke, enhancing their air quality forecasts. Imagery from GOES-16 helped forecasters spot new wildfires in California, Kansas, Oklahoma, and Texas, and determine which fires were hottest and where the fires were spreading. This critical information was shared with and used by firefighters and emergency managers.
- GOES-16 testing showed potential improvements for aviation weather forecasting and airport operations. Forecasters are now able to predict with greater accuracy than before when fog and clouds will form and clear. The new satellite can also detect turbulence, enabling forecasters to issue timely advisories, aiding in aircraft and passenger safety.
- “We are using the GOES-16 data in ways we planned and in ways we didn’t even imagine,” said National Weather Service director Louis Uccellini. “GOES-16 has been a game changer for monitoring hurricanes, wildfires, severe storms, and lightning. Now that it is operational and the data is incorporated into the forecast process, we will be able to use it across all our service areas, starting with winter storms.”
- Data from GOES-16 has been available to NOAA forecasters and the national and international weather modeling and forecasting community during the satellite’s testing phase and will continue to do so.
- GOES-16 is the first in the series of next-generation geostationary satellites, that provides valuable data in support of NOAA’s Weather-Ready Nation initiative. The next new NOAA satellite, GOES-S is scheduled to launch March 1, 2018 followed by GOES-T in 2020 and GOES-U in 2024. These satellites will enable NOAA to more closely monitor weather systems over North America, South America, and the Atlantic and Pacific Oceans, to help protect lives and property.
• October 23, 2017: NOAA is planning to move GOES-16 into its operational orbit at 75.2º west longitude (the GOES East position) starting on November 30, 2017. GOES-16 will officially become GOES-East when all instruments resume regular operations on December 20, 2017. Note: Currently, GOES-16 resides in a central checkout orbit of 89.5º west longitude, where it is in its extended validation phase. 10)
- During the drift period, five instruments (ABI, GLM, SUVI, SEISS, and EXIS) will be placed in safe or diagnostic modes and will not be capturing or distributing data. The magnetometers will be the only instruments that will continue to operate throughout the drift period.
- NOAA’s GOES-13, currently serving as GOES-East, will continue to provide instrument data (allowing a period of overlap) until January 2, 2018, at which time instruments will be turned off and it will moved to its storage location at 60º west.
• September 2017: Highlights from GOES-16’s First Year in Orbit: Even during the current extended test and check-out period, there are already a number of exciting examples of how GOES-16 data were recently used during recent disastrous weather phenomena to track and observe hurricanes and their aftermath during the 2017 Atlantic Basin hurricane season (Ref. 25).
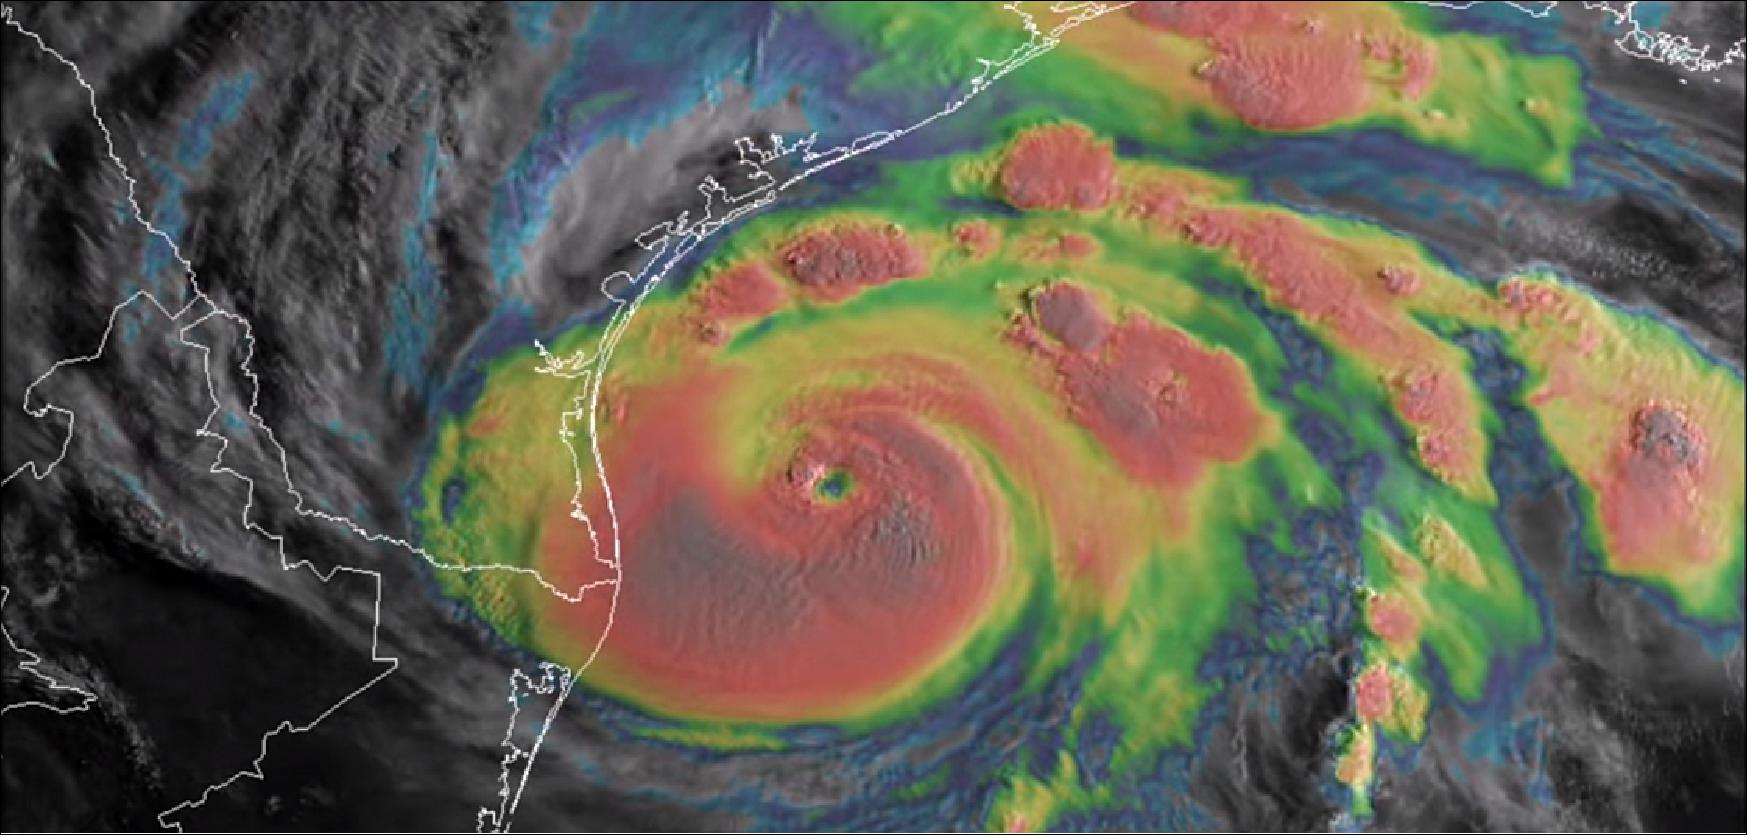
- A full visualization showing satellite data of Hurricane Irma from GOES-13 and GOES-16—a representative frame of which is shown in the screen grab in Figure 13—clearly demonstrates the improved spatial (approximately 0.5 km vs. 1.0 km) and temporal (1 min vs. 15 min) resolutions that arise from GOES-16’s improvements.
![Figure 13: This figure demonstrates the increased spatial resolution of satellite data for Hurricane Irma from GOES-13 [left] and GOES-16 [right]. On previous GOES missions these high-resolution images were not routine, but with GOES-16’s advanced capabilities, these images are now operational (image credit: Colorado Institute for Research in the Atmosphere, Colorado State University)](/api/cms/documents/163813/6142388/GoesR2019-2017_AutoB.jpeg)
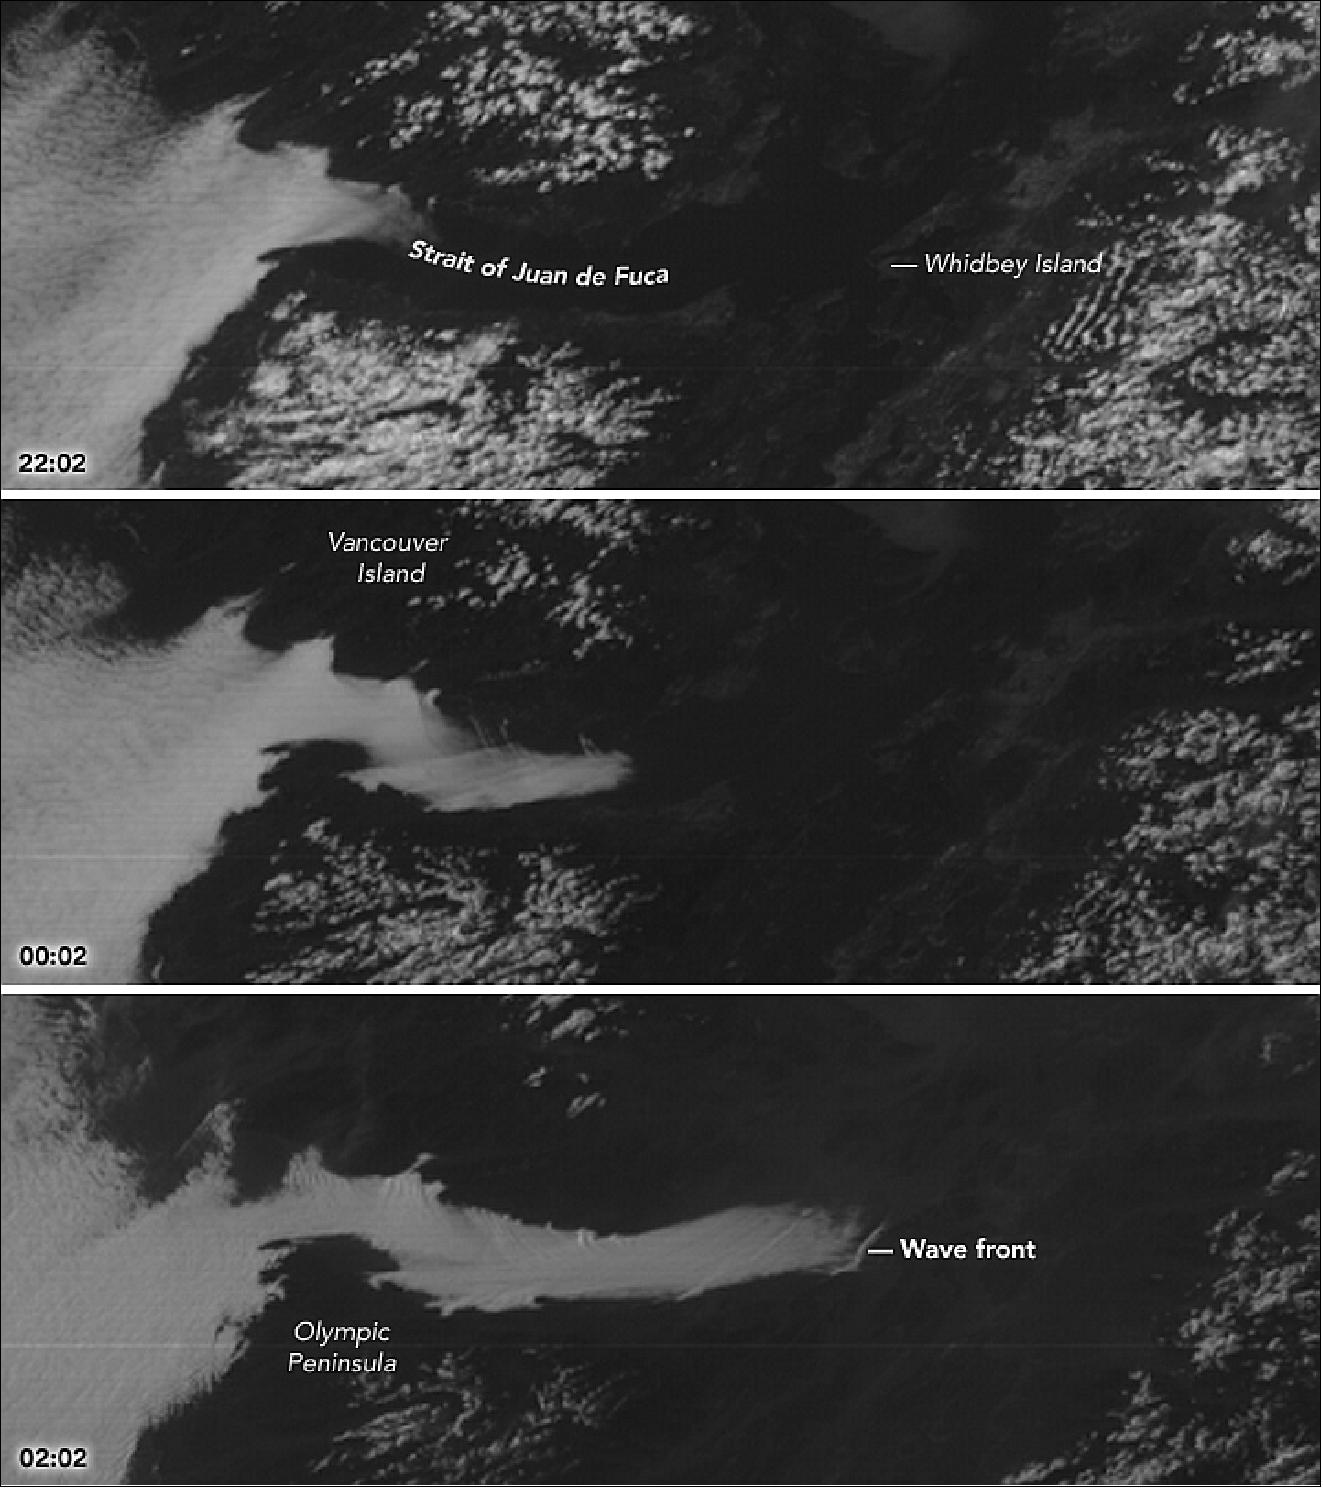
• June 14, 2017: In western Washington State, fog forms frequently in the summer and fall. Skies are often clearer than in other seasons, allowing surface heat to escape and air to cool, which leads to fog. But fog can happen any time of year if conditions are right. 11)
- Conditions were right on May 20, 2017, when winds pushed coastal fog eastward from the Pacific Ocean into the Strait of Juan de Fuca, the channel between Washington state and Vancouver Island. The images above were acquired by the ABI (Advanced Baseline Imager) on GOES-16. The satellite is operated by NOAA (National Oceanic and Atmospheric Administration), which includes the National Weather Service. NASA helps develop and launch the GOES series of satellites.
- The GOES satellites are particularly well suited to capture the movement of clouds and weather systems because these satellites follow Earth’s orbit and maintain a fixed position over a region. For phenomena that evolve quickly—like storms, or in this case, fog—this so-called geostationary orbit gives a timely view.
- GOES captured this series of images on May 20 as fog rolled into the strait. At 3:02 p.m. local time (22:02 Universal Time), stratus clouds hung low off the coasts of Washington and British Columbia. Within two hours, the fog was about halfway into the strait; two hours later, the fog encountered the sharp landmass of Whidbey Island, which imparted a wave structure to the clouds.
- According to Scott Bachmeier, a research meteorologist at the University of Wisconsin-Madison, winds that afternoon were about 28 km/ hour, with gusts that evening up to 50 km/ hour. It’s not uncommon for fog to fill the strait; lower-resolution GOES and the Suomi NPP satellite imagers captured similar views in August 2016 and April 2013.
- “This fog feature and its motion were more accurately depicted by the improved spatial and temporal resolution of GOES-16 imagery,” Bachmeier said. “The small-scale “bow shock waves” would probably not have been seen with lower-resolution GOES visible imagery.”
• May 25, 2017: GOES-16, the most advanced weather satellite NOAA has ever developed, will be moved to the GOES-East position at 75º west longitude, once it is declared operational in November. Top officials from NOAA announced the long-awaited decision at today’s 2017 Atlantic Hurricane Season Outlook news conference in College Park, Maryland. 12)
- “As a Florida resident, I am particularly proud of the important work NOAA does in weather forecasting and hurricane prediction,” said U.S. Secretary of Commerce Wilbur Ross. “GOES-16’s unmatched detail in observations and other data will improve forecasts, provide considerable benefits to the economy, and help improve public safety. It will improve forecasters’ situational awareness and lead to more accurate, timely, and reliable watches and warnings.”
- After GOES-16 was launched on November 19, the satellite’s instruments and the data they produce have undergone an extensive engineering checkout and instrument validation period. Once GOES-16 reaches its East location, the current GOES-East satellite (GOES-13) will be placed into orbital storage along with GOES-14 and remain available if needed. From its perch 35,786 km over the Equator, GOES-16 will be able to see the entire United States.
- GOES-16 scans the Earth and skies five times faster than NOAA’s current geostationary weather satellites, sending back sharper, more defined images at four times greater resolution as often as every 30 seconds, using three times the spectral channels as the previous model. The higher resolution will allow forecasters to see more details in storm systems, especially during periods of rapid strengthening or weakening. Also, GOES-16 carries the first lightning detector flown in geostationary orbit. Total lightning data (in-cloud and cloud-to-ground) from the lightning mapper will provide critical information to forecasters, allowing them to focus on developing severe storms much earlier.
- Meanwhile, GOES-15 will continue as the GOES-West satellite. Positioning satellites in the East and West locations, along with an on-orbit spare, ensures that forecasters get a thorough look at developing weather systems that affect the U.S., from the western Pacific to the coast of Africa.
- GOES-16 is the first in a series of four next-generation geostationary satellites. The next, GOES-S, is scheduled to launch by spring 2018 and will be expected to move to the GOES-West location once it is commissioned. GOES-S will be followed by the launches of GOES-T and GOES-U, in 2020 and 2024, respectively.
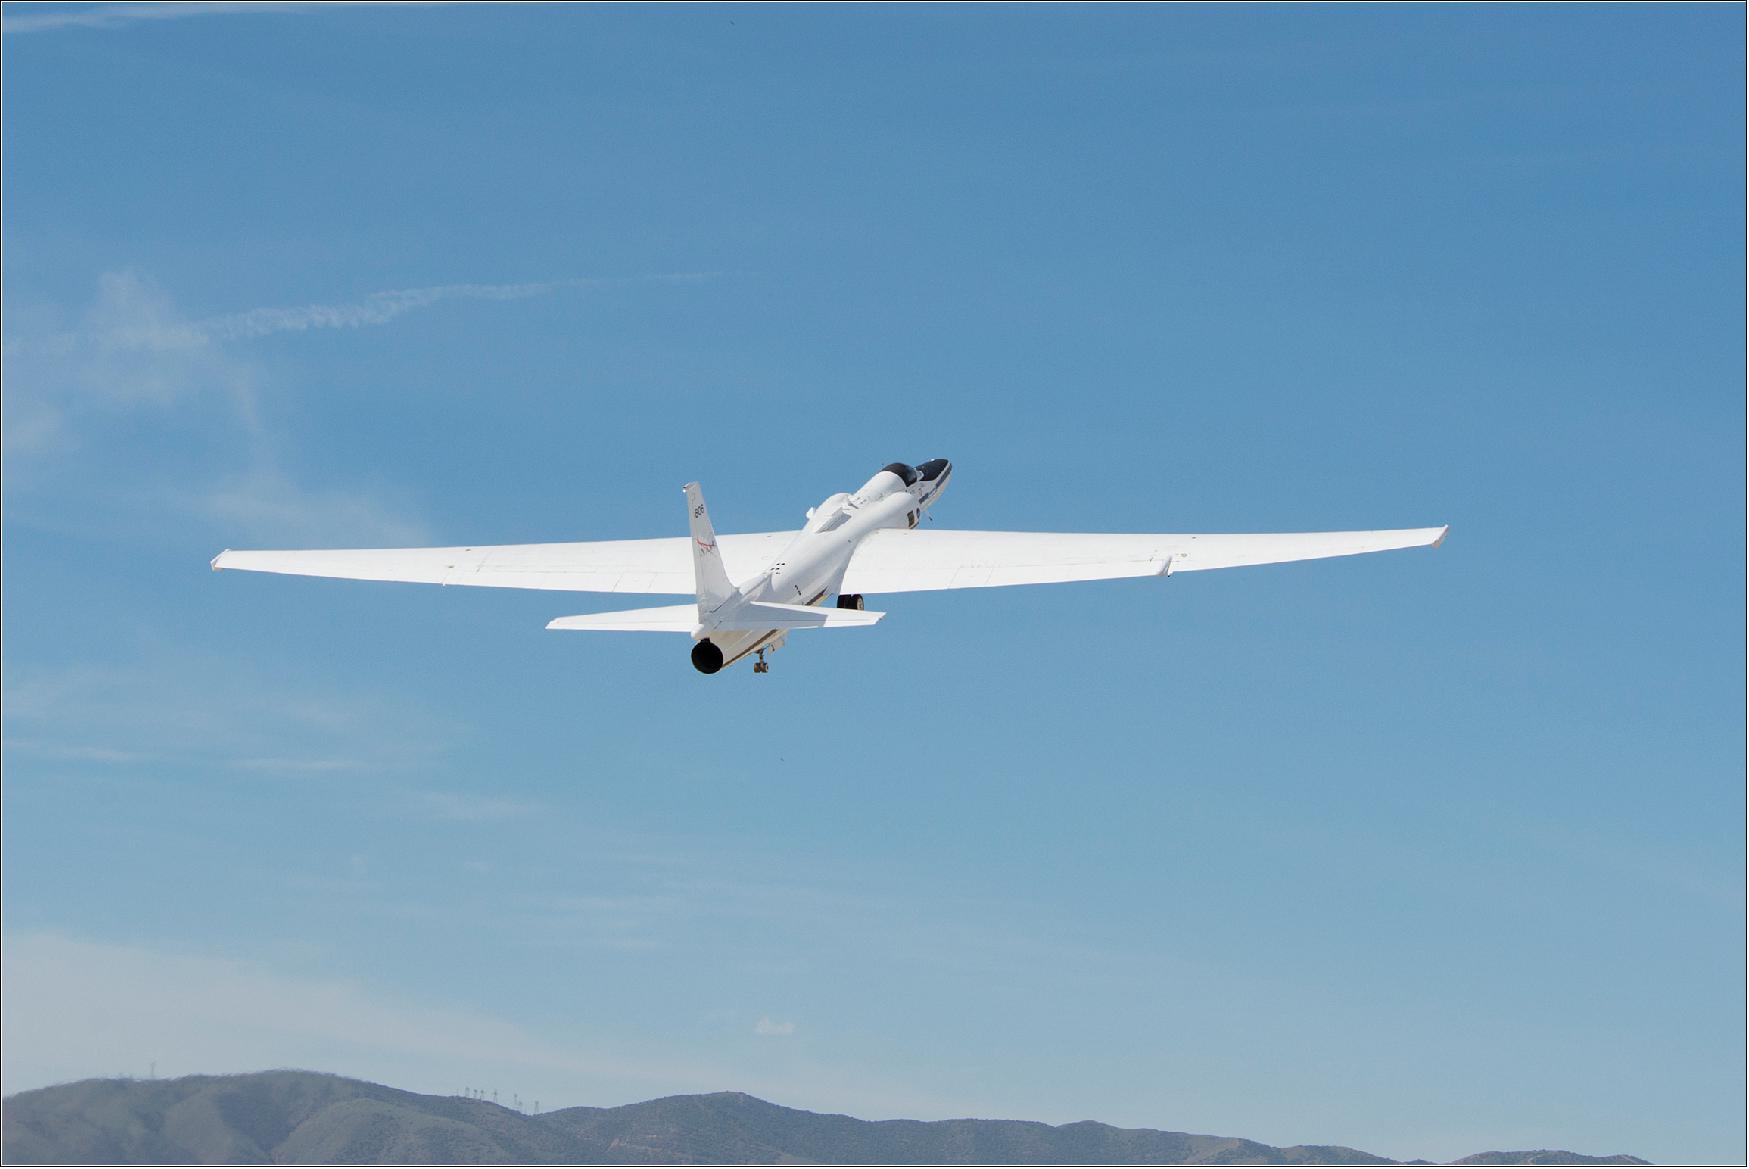
• March 22, 2017: GOES-16 is ready to embark on another major milestone— The GOES-16 Field Campaign! During this three-month event, an assemblage of high-altitude planes, ground-based sensors, drones, and satellites will be used to fine-tune GOES-16’s suite of brand new instruments. 13) 14)
- Since NOAA’s GOES-16 satellite lifted off on November 19, 2016, a team of scientists and engineers from both NOAA and NASA, has been working around the clock to power on the satellite’s advanced instruments and to get their data back to Earth.
- During this three-month campaign, a team of instrument scientists, meteorologists, GOES-16 engineers, and specialized pilots will use a variety of high-altitude planes, ground-based sensors, unmanned aircraft systems (or drones), the ISS (International Space Station), and the NOAA/NASA Suomi NPP polar-orbiting satellite to collect measurements across the United States. From arid desserts and areas of dense vegetation, to open oceans and storms exhibiting lightning activity, these measurements will cover nearly everything NOAA’s GOES satellites see from their orbit 35,786 km above the Earth.
- Although these data are collected on Earth, GOES-16’s operators will obtain similar measurements of the same locations using two of the satellite’s most revolutionary instruments—ABI (Advanced Baseline Imager) and the GLM (Geostationary Lightning Mapper). The data sets will be analyzed and compared to the data collected by the planes, drones, and sensors to validate and calibrate the instruments on the satellite.
- NOAA’s mission is to ensure that data from its satellites are precise, accurate, and widely available, so before GOES-16 becomes operational, it must go through an exhaustive testing phase, wherein its instruments are checked and re-checked using measurements from a vast range of verified sources. — When the testing is complete, all of the GOES-16 Field Campaign information will be permanently stored as reference data at NOAA’s National Centers for Environmental Information.
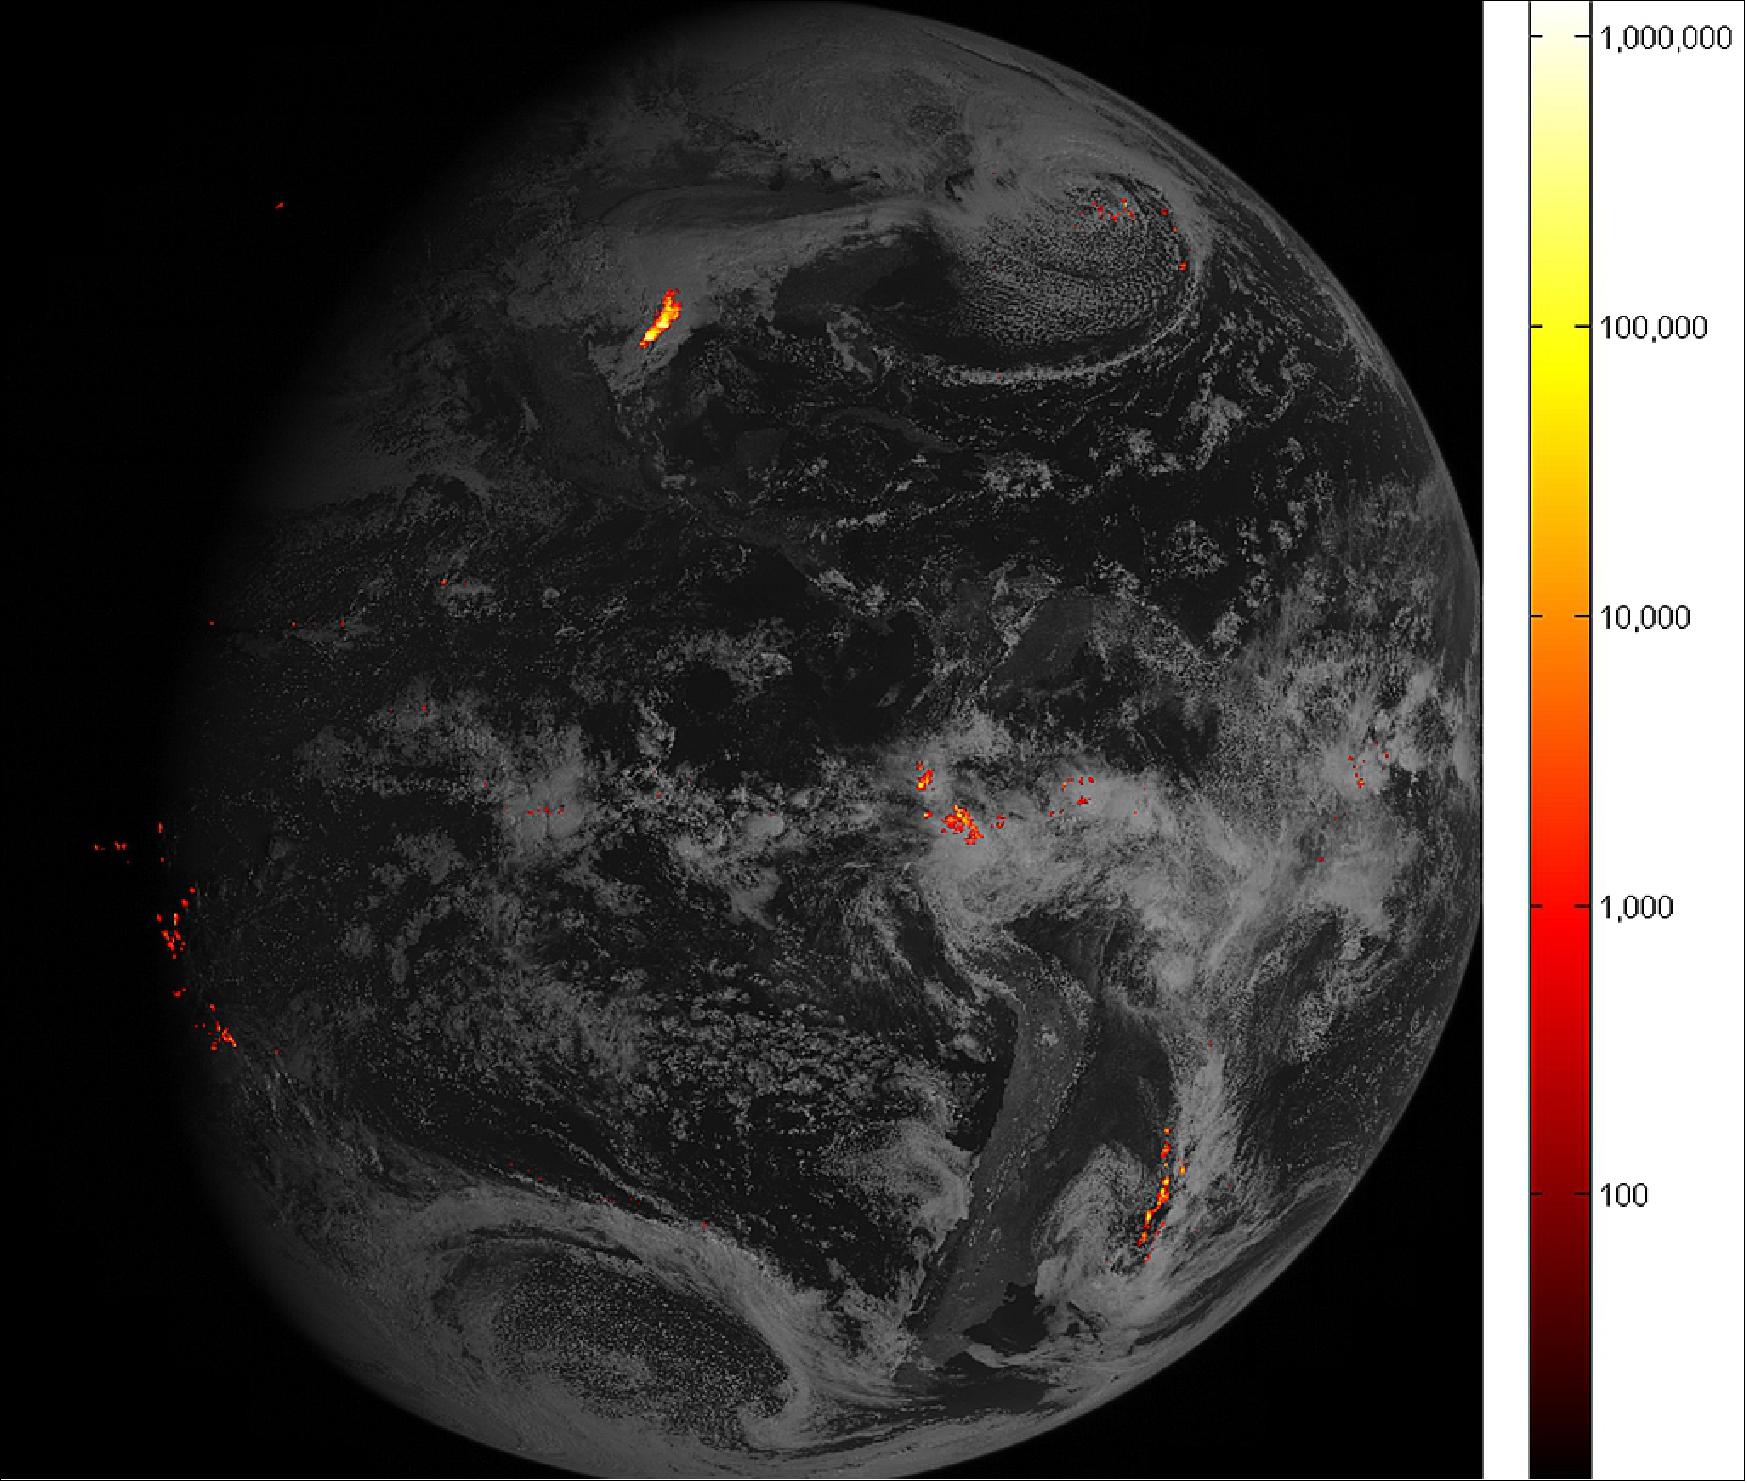
• March 6, 2017: The first images of the GLM ( Geostationary Lightning Mapper) on GOES-16 were obtained on Feb. 14 — giving NOAA National Weather Service forecasters richer information about lightning that will help them alert the public to dangerous weather. 15) 16)
- The first lightning detector in a geostationary orbit,GLM , is transmitting data never before available to forecasters. The mapper continually looks for lightning flashes in the Western Hemisphere, so forecasters know when a storm is forming, intensifying and becoming more dangerous. Rapid increases of lightning are a signal that a storm is strengthening quickly and could produce severe weather.
- During heavy rain, GLM data will show when thunderstorms are stalled or if they are gathering strength. When combined with radar and other satellite data, GLM data may help forecasters anticipate severe weather and issue flood and flash flood warnings sooner. In dry areas, especially in the western United States, information from the instrument will help forecasters, and ultimately firefighters, identify areas prone to wildfires sparked by lightning.
- Accurate tracking of lightning and thunderstorms over the oceans, too distant for land-based radar and sometimes difficult to see with satellites, will support safe navigation for aviators and mariners.
- The new mapper also detects in-cloud lightning, which often occurs five to 10 minutes or more before potentially deadly cloud-to-ground strikes. This means more precious time for forecasters to alert those involved in outdoor activities of the developing threat.
- NOAA’s satellites are the backbone of its life-saving weather forecasts. GOES-16 will build upon and extend the more than 40-year legacy of satellite observations from NOAA that the American public has come to rely upon.
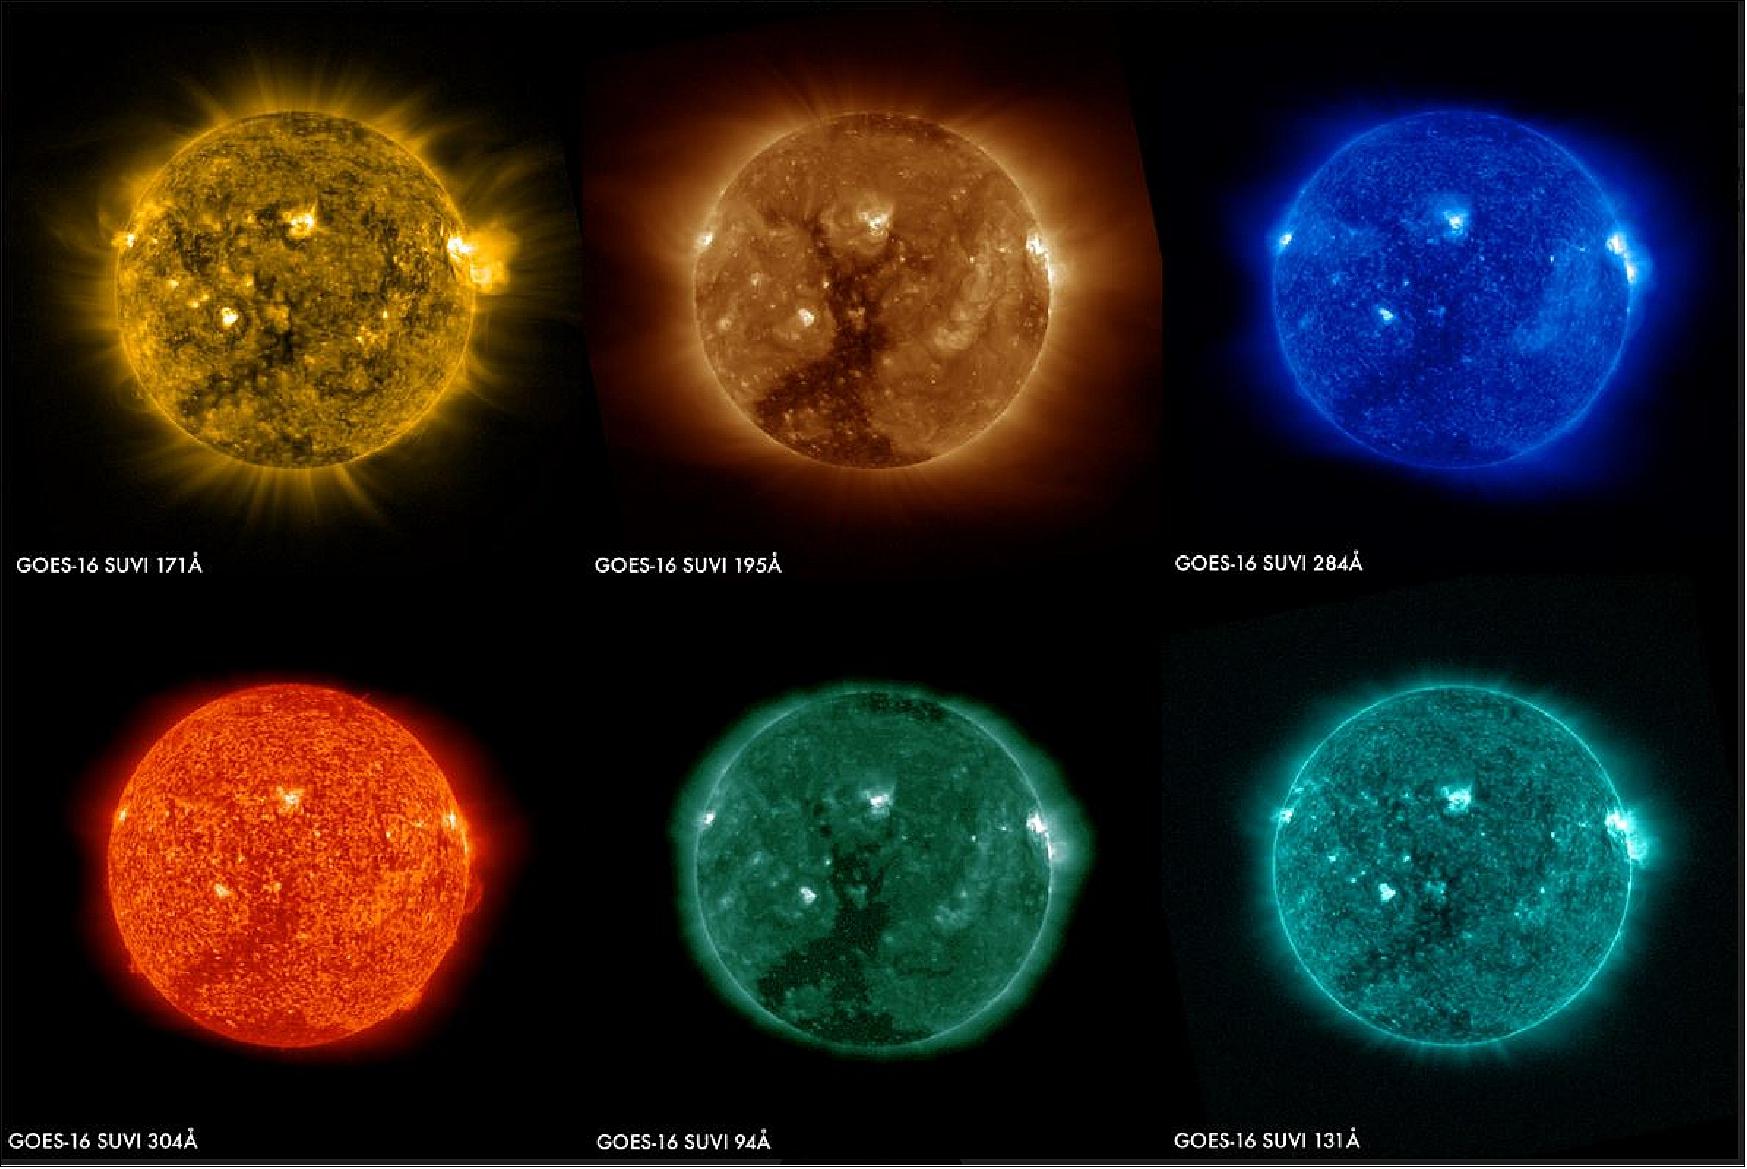
• February 27, 2017: The first test images from the SUVI (Solar Ultraviolet Imager) instrument aboard NOAA’s GOES-16 satellite have been successful, capturing a large coronal hole on Jan. 29, 2017. The sun’s 11-year activity cycle is currently approaching solar minimum and during this time powerful solar flares become scarce and coronal holes become the primary space weather threat. Once operational, SUVI will capture full-disk solar images around-the-clock and will be able to see more of the environment around the sun than earlier NOAA geostationary satellites. 17)
- The sun’s upper atmosphere, or solar corona, consists of extremely hot plasma, an ionized gas. This plasma interacts with the sun’s powerful magnetic field, generating bright loops of material that can be heated to millions of degrees. Outside hot coronal loops, there are cool, dark regions called filaments which can erupt and become a key source of space weather when the sun is active. Other dark regions are called coronal holes, which occur where the sun’s magnetic field allows plasma to stream away from the sun at high speed, resulting in cooler areas. The effects linked to coronal holes are generally milder than those of coronal mass ejections, but when the outflow of solar particles in intense, they can still pose risks to Earth.
- The solar corona is so hot that it is best observed with X-ray and EUV (Extreme-Ultraviolet) cameras. Various elements emit light at specific EUV and X-ray wavelengths depending on their temperature, so by observing in several different wavelengths, a picture of the complete temperature structure of the corona can be made. The GOES-16 SUVI observes the sun in six EUV channels.
- Data from SUVI will provide an estimation of coronal plasma temperatures and emission measurements which are important to space weather forecasting. SUVI is essential to understanding active areas on the sun, solar flares and eruptions that may lead to coronal mass ejections which may impact Earth. Depending on the magnitude of a particular eruption, a geomagnetic storm can result that is powerful enough to disturb Earth’s magnetic field. Such an event may impact power grids by tripping circuit breakers, disrupt communication and satellite data collection by causing short-wave radio interference and damage orbiting satellites and their electronics. SUVI will allow the NOAA Space Weather Prediction Center to provide early space weather warnings to electric power companies, telecommunication providers and satellite operators.
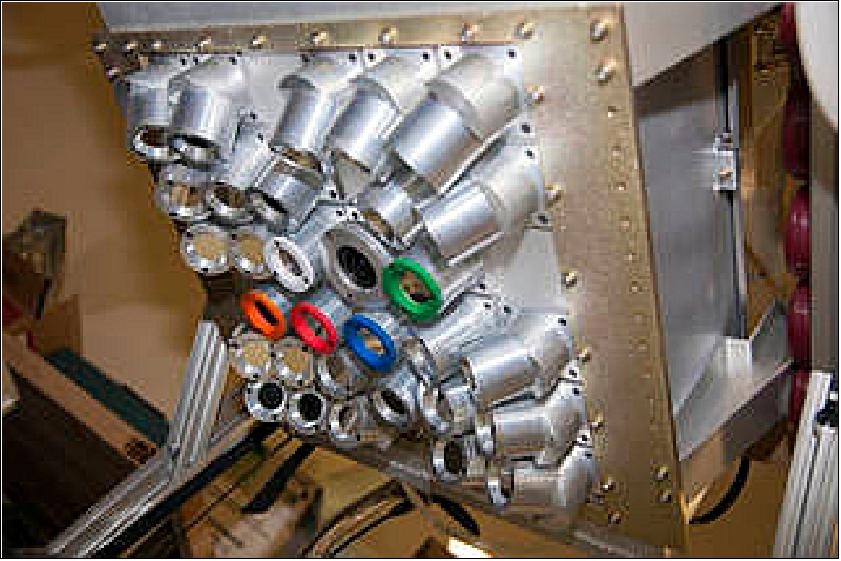
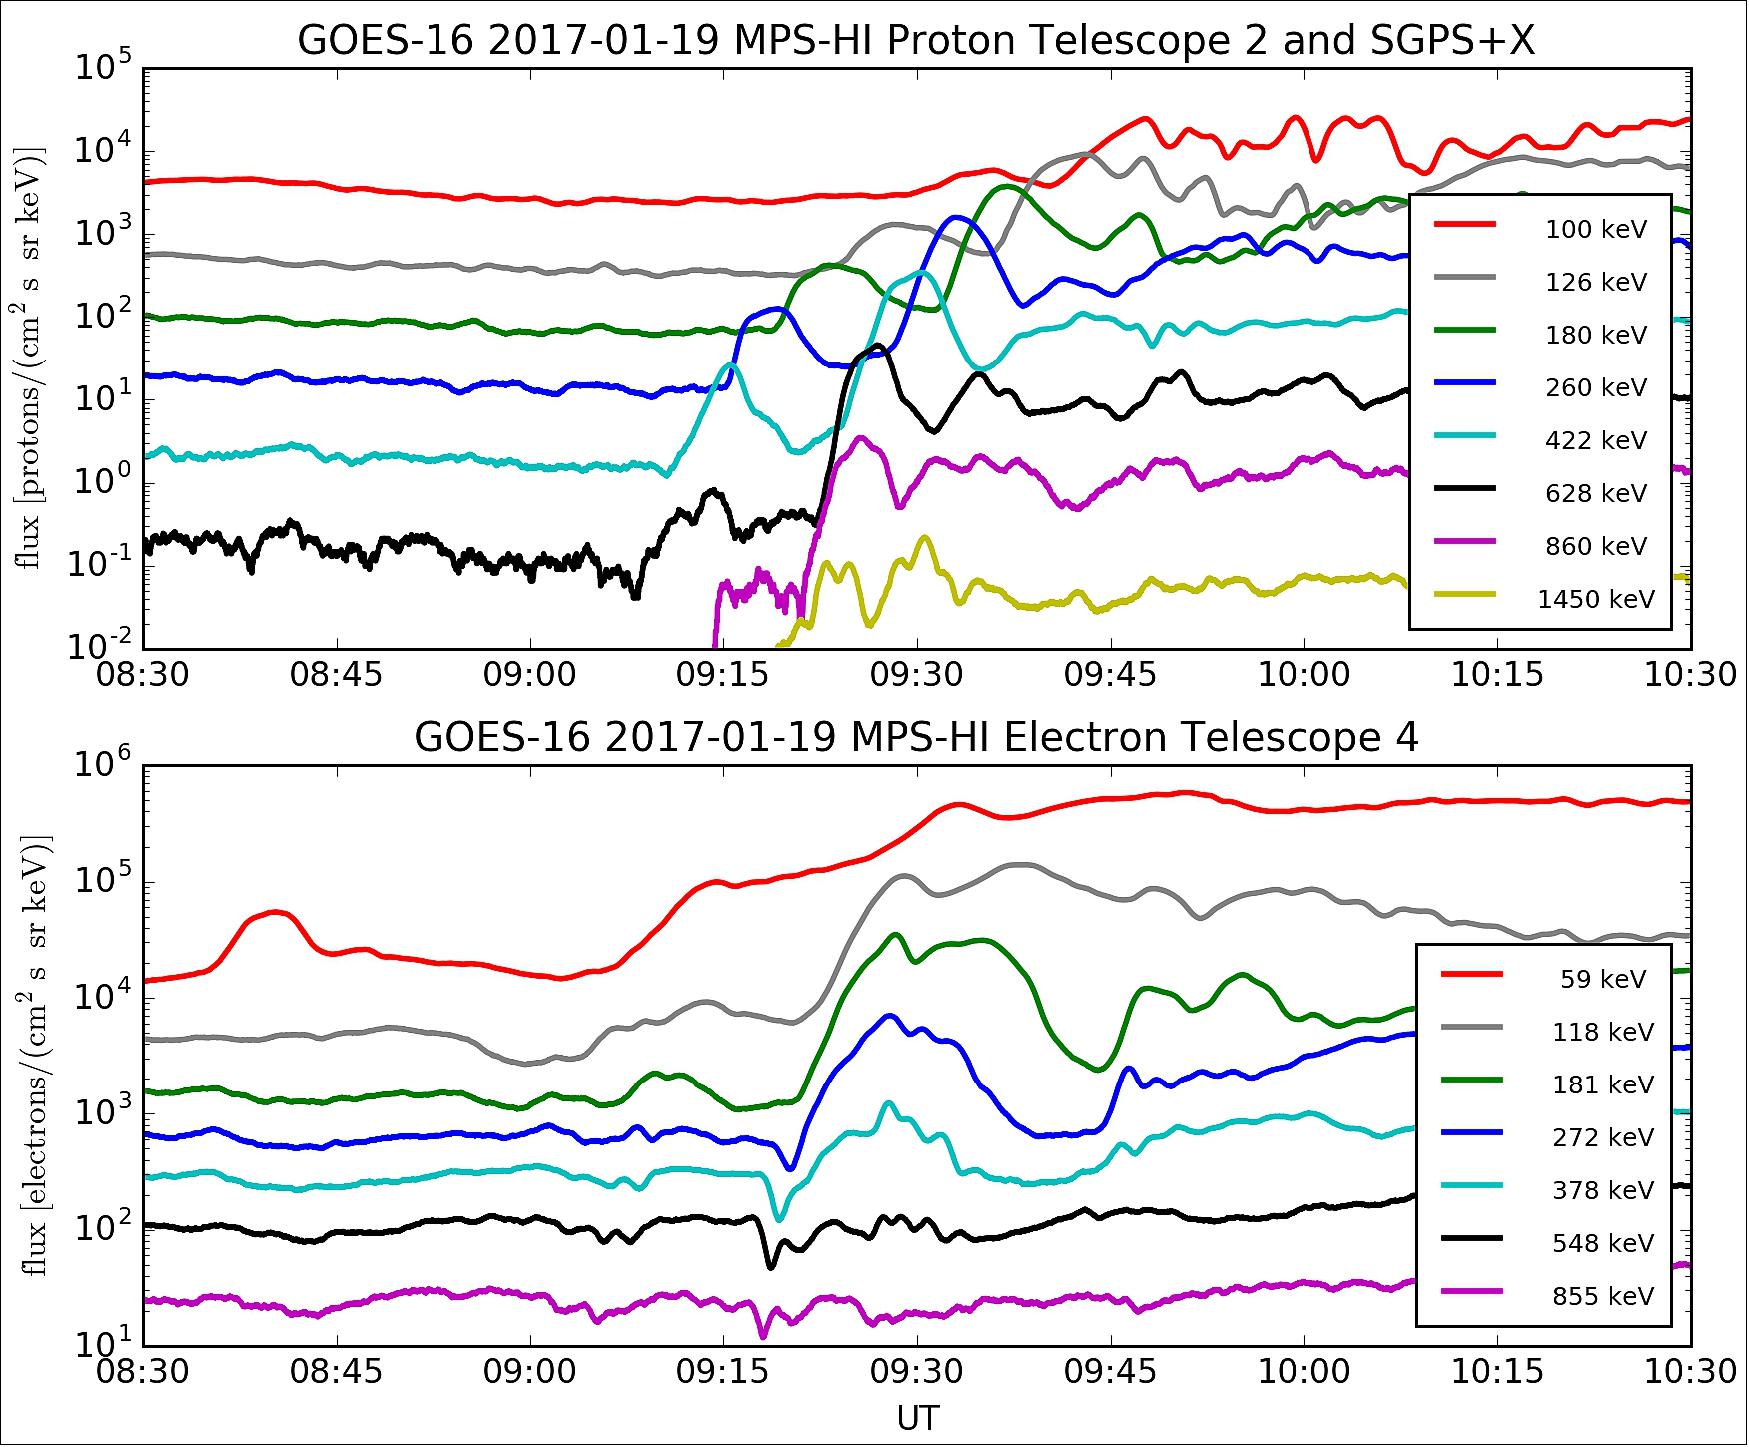
• February 10, 2017: The SEISS (Space Environment In‐Situ Suite) instrument onboard NOAA’s GOES-16 is working and successfully sending data back to Earth. A plot from SEISS data showed how fluxes of charged particles increased over a few minutes around the satellite on January 19, 2017. These particles are often associated with brilliant displays of aurora borealis at northern latitudes and borealis australis at southern latitudes; however, they can pose a radiation hazard to astronauts and other satellites, and threaten radio communications. 18)
- Information from SEISS will help NOAA's Space Weather Prediction Center provide early warning of these high flux events, so astronauts, satellite operators and others can take action to protect lives and equipment.
- SEISS is composed of five energetic particle sensor units. The SEISS sensors have been collecting data continuously since January 8, 2017, with an amplitude, energy and time resolution that is greater than earlier generations of NOAA’s geostationary satellites.
• February 3, 2017: On January 21, 2017, the GOES-16 EXIS (Extreme Ultraviolet and X-Ray Irradiance Sensors) observed solar flares. Solar flares are huge eruptions of energy on the sun and often produce clouds of plasma traveling more than a million miles an hour. When these clouds reach Earth they can cause radio communications blackouts, disruptions to electric power grids, errors in GPS navigation, and hazards to satellites and astronauts. The EXIS instrument on NOAA’s GOES-16, built by the University of Colorado’s LASP (Laboratory for Atmospheric and Space Physics) in Boulder, Colorado, measures solar flares at several wavelengths and improves upon current capabilities by capturing larger flares, measuring the location of the flares on the sun, and measuring flares in more wavelengths. The GOES-16 EXIS will provide forecasters at the NOAA’s Space Weather Prediction Center with early indications of impending space weather storms so they can issue alerts, watches and warnings. 19)
- Current geostationary satellites measure solar X-ray and extreme ultraviolet fluxes. The higher resolution EXIS instrument will provide new capabilities, including the ability to capture larger solar flares.
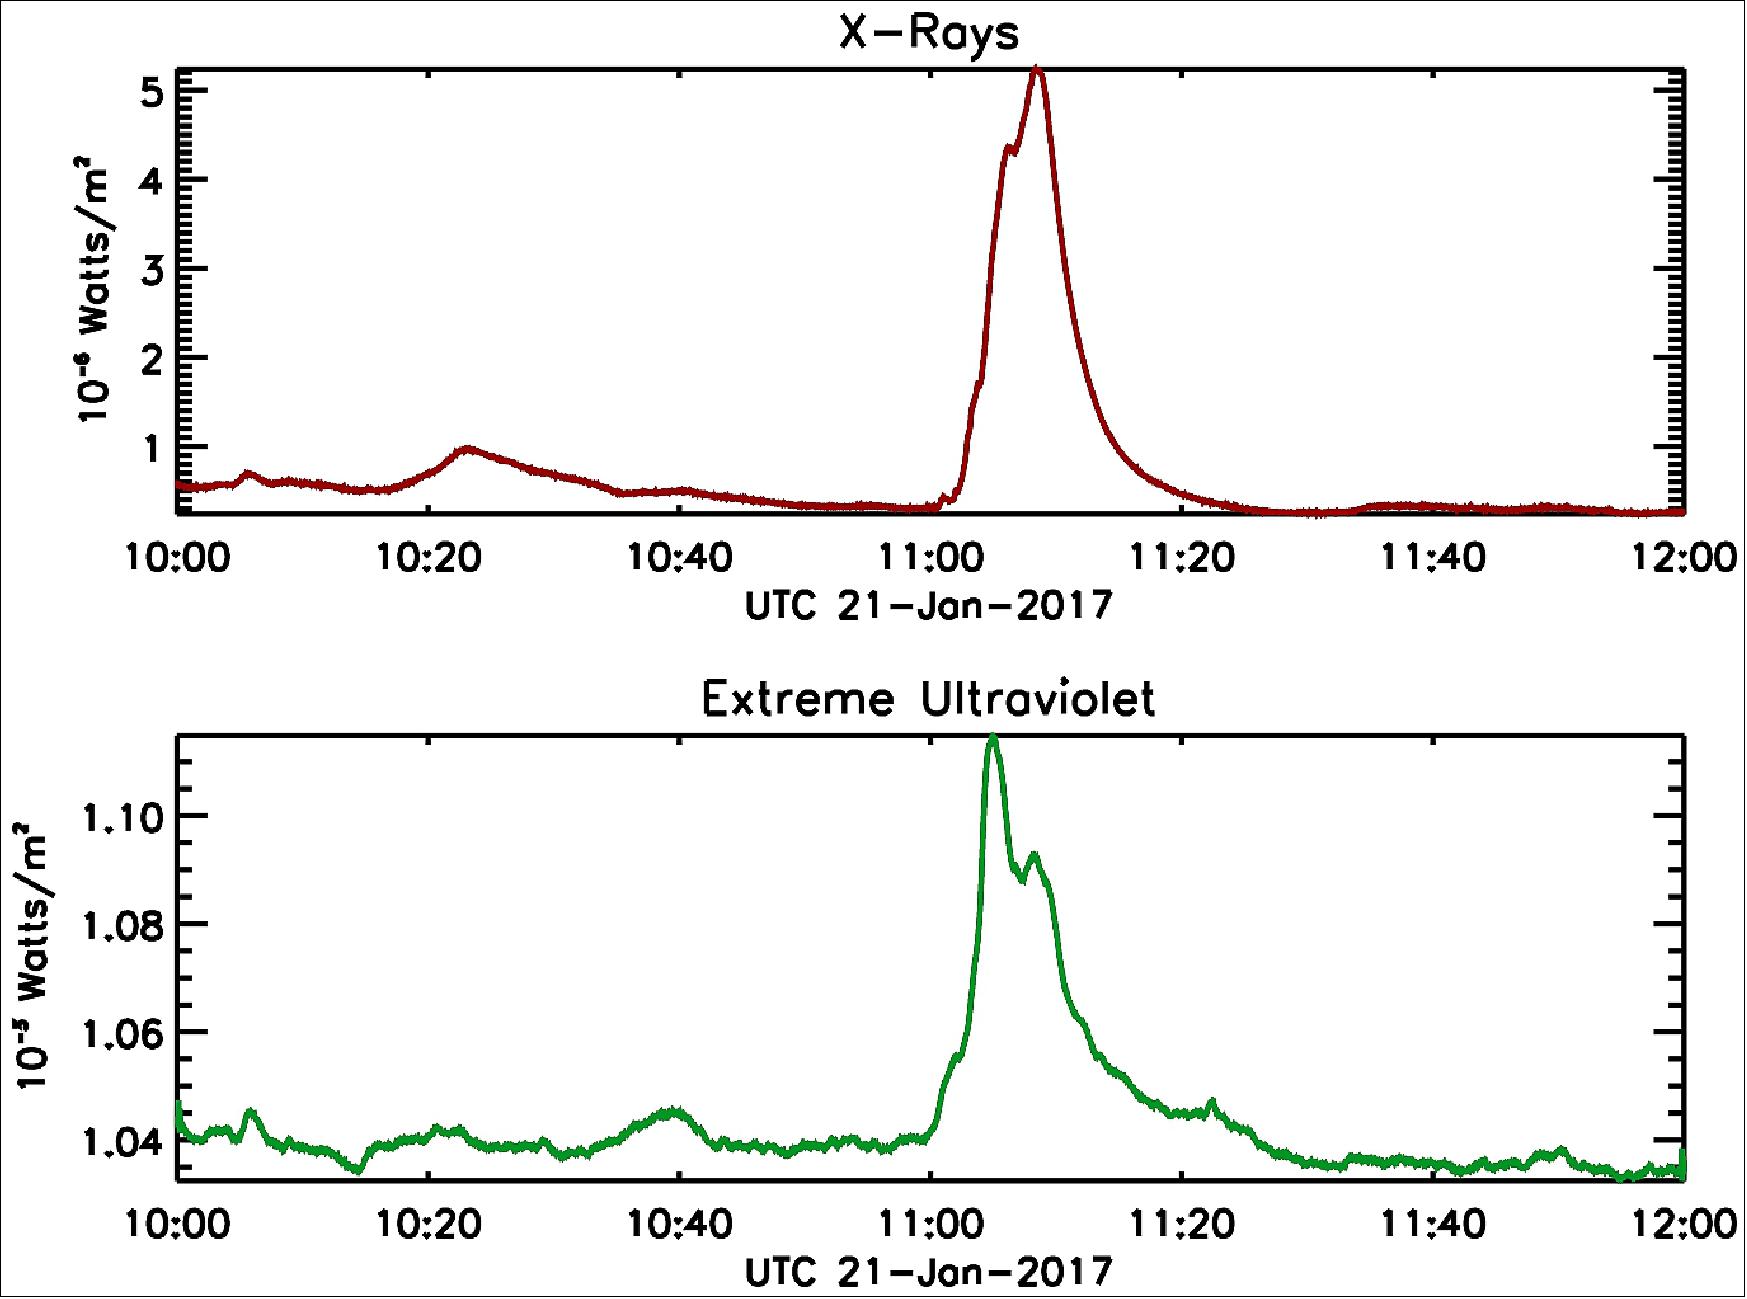
Legend to Figure 21: This was a relatively small flare, yet the brightness of the sun in soft (lower energy) X-rays increased by a factor of 16. EXIS will give NOAA and space weather forecasters the first indication that a flare is occurring on the sun, as well as the strength of the flare, how long it lasts, the location of the flare on the sun, and the potential for impacts here at Earth.
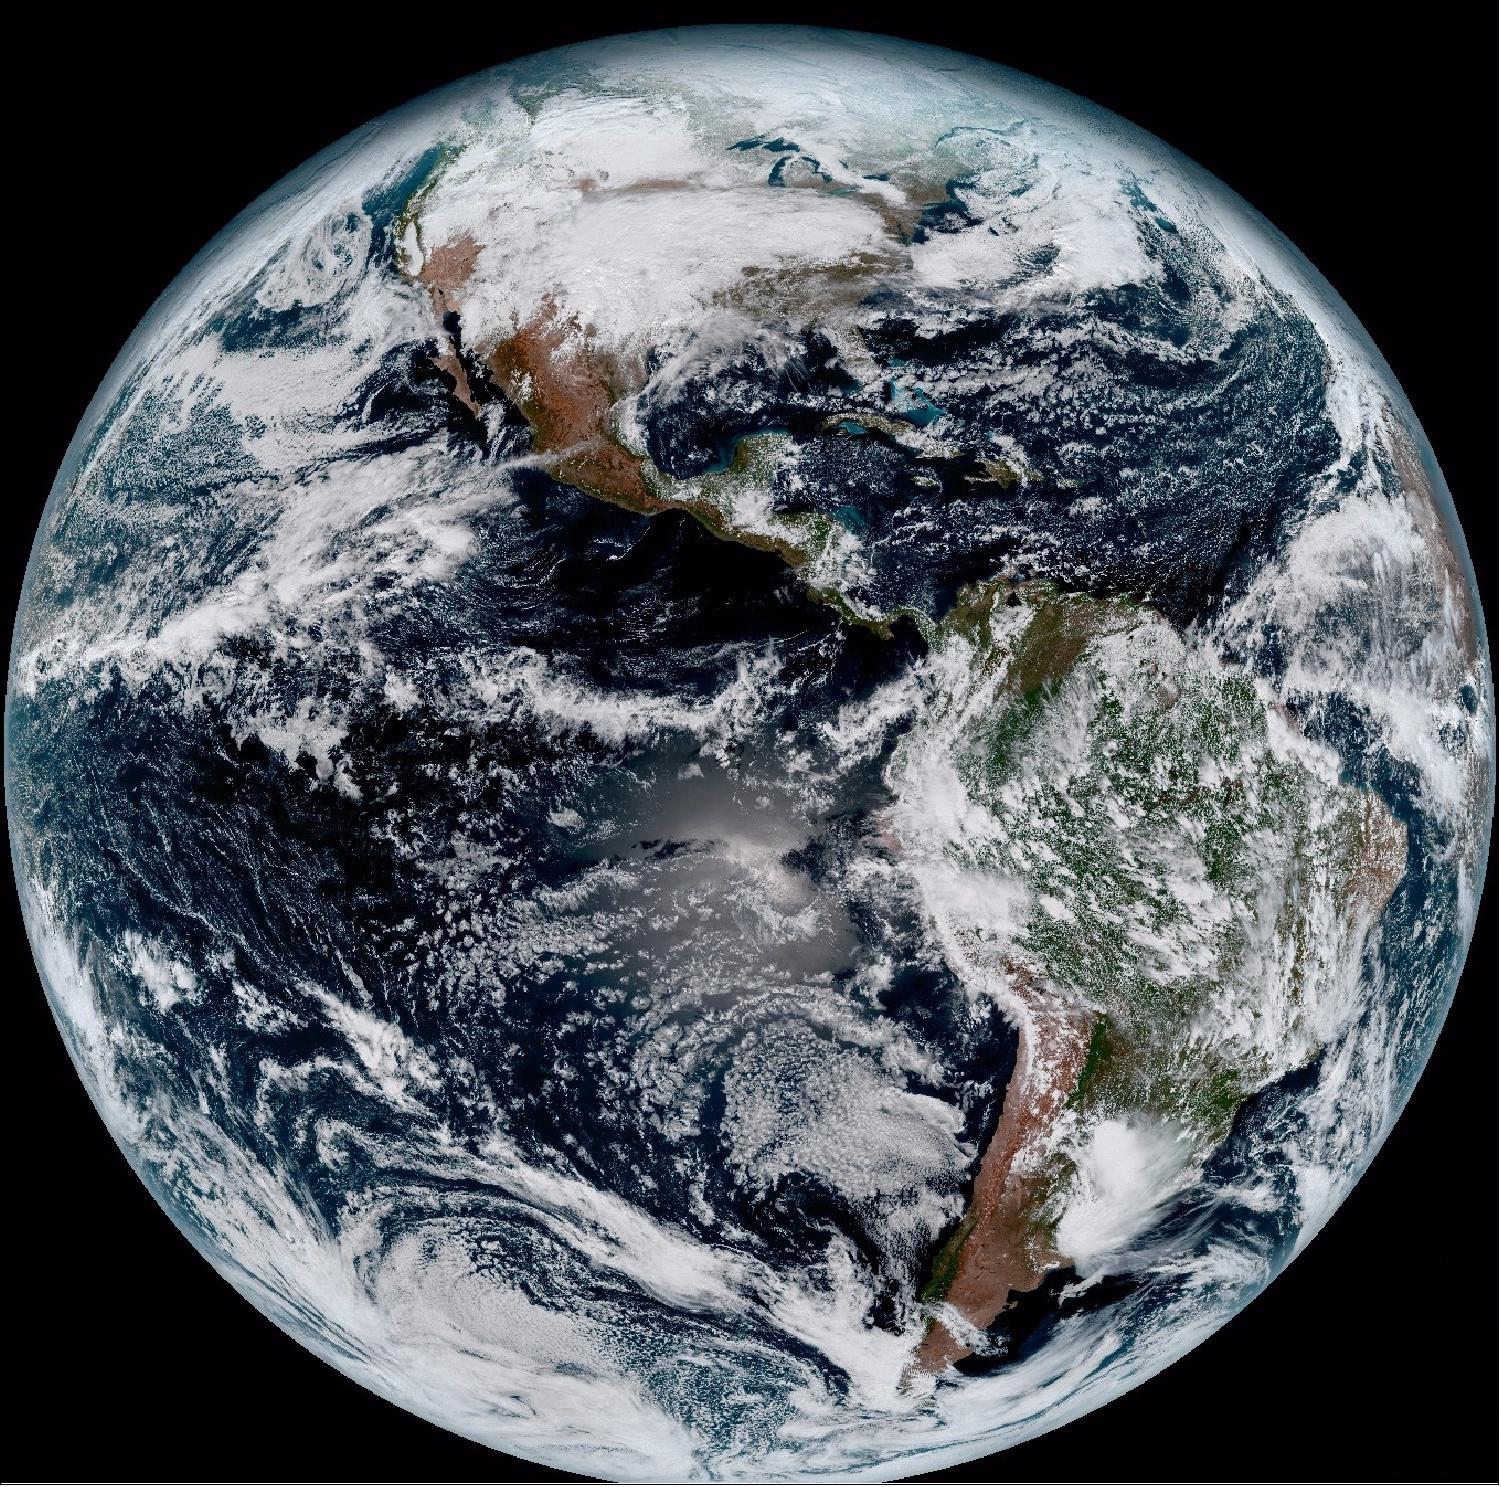
• On January 23, 2017, NOAA released the first images from the GOES-16 (formerly GOES-R) spacecraft. 20) 21) 22)
- The ABI can provide a full disk image of the Earth every 15 minutes, one of the continental U.S. every five minutes, and has the ability to target regional areas where severe weather, hurricanes, wildfires, volcanic eruptions or other high-impact environmental phenomena are occurring as often as every 30 seconds. The ABI covers the Earth five-times faster than the current generation GOES imagers and has four times greater spatial resolution, allowing meteorologists to see smaller features of the Earth’s atmosphere and weather systems.
- “Seeing these first images from GOES-16 is a foundational moment for the team of scientists and engineers who worked to bring the satellite to launch and are now poised to explore new weather forecasting possibilities with this data and imagery,” said Stephen Volz, NOAA’s assistant administrator for Satellite and Information Services, Silver Spring, Maryland. “The incredibly sharp images are everything we hoped for based on our tests before launch. We look forward to exploiting these new images, along with our partners in the meteorology community, to make the most of this fantastic new satellite.”
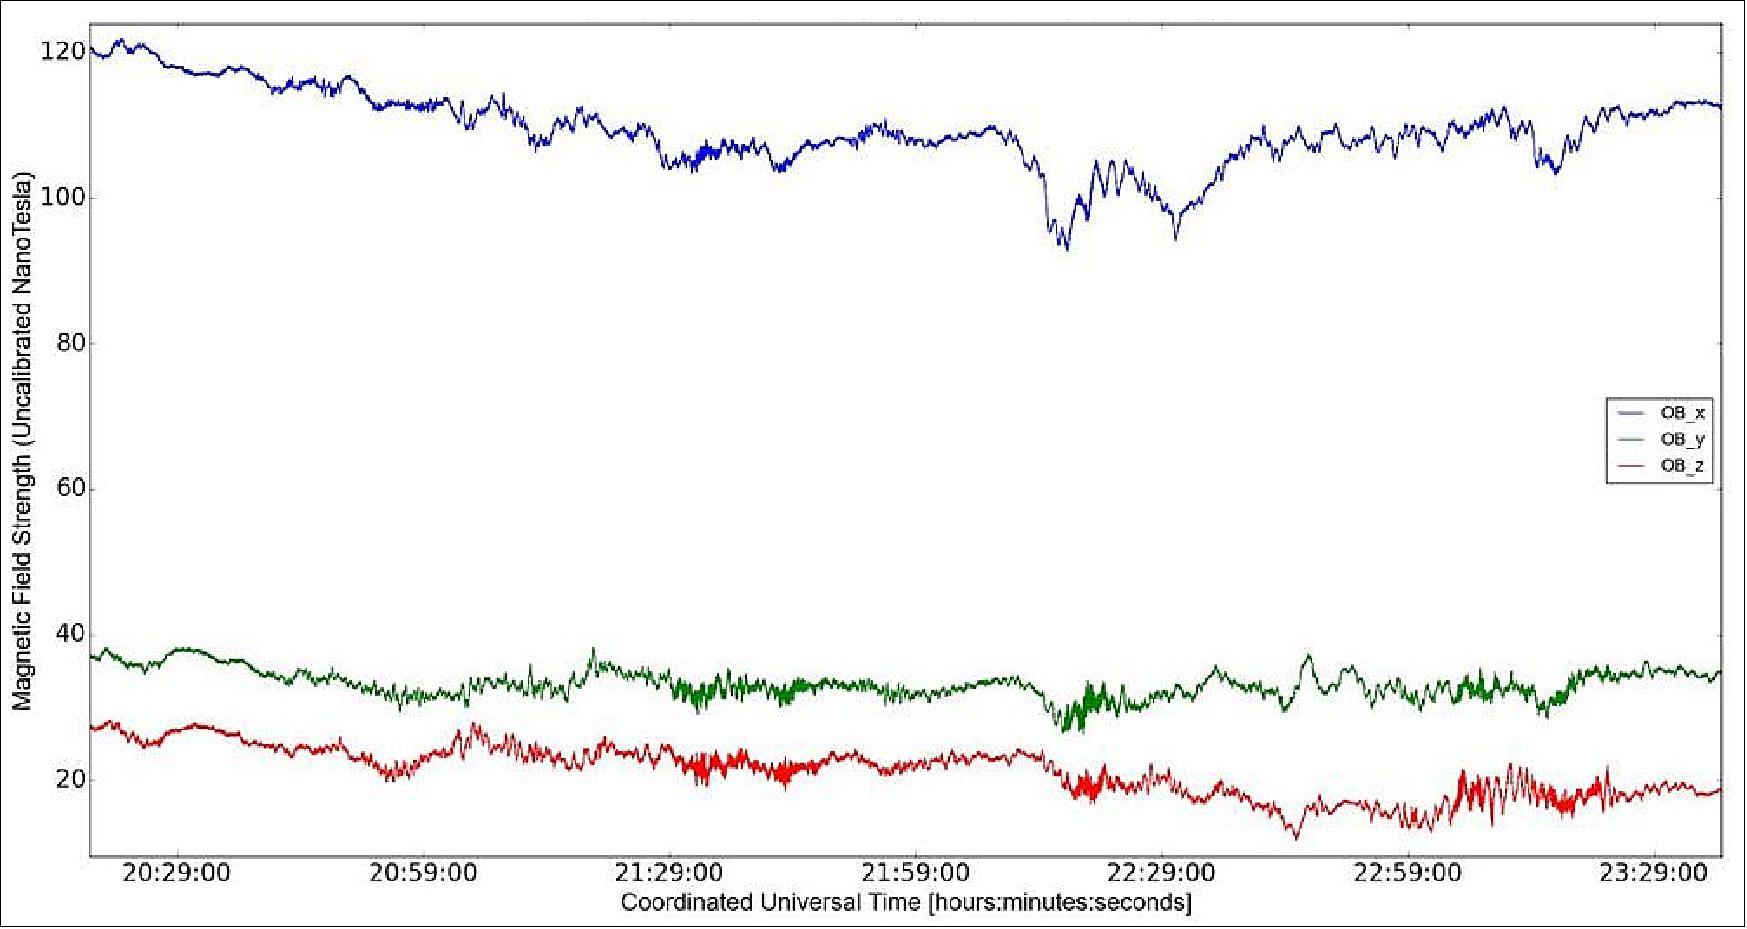
• January 5, 2017: On December 22, 2016, scientists received preliminary data from the outboard magnetometer (MAG) instrument aboard GOES-16. MAG observations of Earth's geomagnetic field strength are an important part of NOAA’s space weather mission, with the data used in space weather forecasting, model validation, and for developing new space weather models. The GOES-16 MAG samples five times faster than previous GOES magnetometers, which increases the range of space weather phenomena that can be measured. 23)
• December 12, 2016: Over the last week, GOES-16 has deployed its magnetometer boom; powered on its ABI, GLM, SUVI, and EXIS instruments; and its ground stations are now receiving space weather data from the spacecraft! The satellite's instruments will continue to progress through their planned testing and calibration phases over the next several weeks (Ref. 23).
• On November 29, 2016, NOAA's GOES-R satellite executed its final liquid apogee engine burn without anomaly. This has placed the satellite approximately 35,400 km away with an inclination of 0.0º, meaning it has reached geostationary orbit. GOES-R is now GOES-16! 24)
- On Nov. 30, GOES-16 will perform its second stage solar array deployment, releasing the solar array yoke and solar pointing platform. In the days that follow, the software will be transitioned from the 'orbit raising' mission phase to 'operational,' several maneuvers will be conducted to adjust the satellites precise orbit, and the magnetometer boom will be deployed. Testing and calibration of GOES-16 will then begin.
• November 23, 2016: Since launch on Nov. 19, GOES-R has transitioned to the ‘orbit raising’ phase of the mission and is making its way to geostationary orbit. The spacecraft is currently positioned in a sun-point attitude, which allows its solar array to harness the sun’s power (Ref. 24).
- The GOES-R team has performed the first LAE (Liquid Apogee Engine) burn without anomaly. This engine burn is part of a series of LAEs that will help position GOES-R in geostationary orbit. The next major milestone will be the second stage deployment of GOES-R’s solar array, which is currently scheduled to occur on November 30, 2016.
NASA Partnership The GOES partnership between NOAA and NASA is but one chapter in a long history of collaboration between the two organizations that goes well beyond the scope of this article.* The initial Basic Agreement between NOAA and NASA to work together on GOES, signed in 1975, established that NOAA would provide requirements and funding for the GOES Program, and that NASA would serve as NOAA’s agent in procuring and overseeing development of the satellites. In 1998 NOAA and NASA updated the Basic Agreement, assigning to NASA’s Goddard Space Flight Center (GSFC) the responsibility for procuring, developing, and testing GOES Program spacecraft and instruments, and with NOAA responsible for satellite operations, science algorithms, and ground processing. The partners agreed that NOAA would manage the GOES-R Series Program (including GOES-16 and the future satellites) through an integrated NOAA–NASA office, staffed with personnel from both agencies. Using NOAA’s requirements, NASA would then be responsible for acquiring and developing the platforms, including spacecraft and instrument testing, following NASA’s Science Mission Directorate’s rigorous flight program and project management processes. As part of this agreement, GSFC provides spacecraft launch services and then tests the satellite and instruments for the first 6–12 months in orbit before turning the mission over to NOAA/NESDIS (National Environmental Satellite, Data, and Information Service). NASA collaboration roles go further than providing engineering and acquisition services for GOES; the agency also provides scientific support by welcoming NOAA’s scientists to participate in its Earth science research mission teams. The collaborative efforts include algorithm development, pre- and post-launch testing, and designing and implementing the calibration and validation program (usually called “cal/val”), discussed later in this article. The collaboration is not limited to GOES, but includes NOAA’s polar-orbiting operational satellites, where there is considerable overlap of mission activities. NASA’s role in “Research to Operations,”** an effort that promotes the application of research space products to routine societal benefits, is a key component of the partnership. International Collaborations International collaboration is a high priority for NOAA to ensure that investments in satellite observations are interoperable and made available to the public, globally. To meet these goals, NOAA participates in the CEOS (Committee for Earth Observing Satellites), Group on Earth Observations, World Meteorological Organization, and the CGMS (Coordination Group for Meteorological Satellites). The primary objectives of the CGMS include providing a forum for technical exchange on meteorological satellite systems; coordinating missions, including establishing complementary orbits, sensors, data formats, processing algorithms, and cal/val activities; and encouraging mutual backup arrangements. As an example, JMA ( Japan Meteorological Agency) and NOAA have a mutual backup arrangement. The two agencies’ new-generation satellites carry similar advanced imagers [i.e., the Advanced Baseline Imager (ABI) on the GOES-R series is similar to the JMA’s Advanced Himawari Imager (AHI) on Himawari-8 and -9.*** Along similar lines, AMI (Advanced Meteorological Imager) on the KMA (Korean Meteorological Agency’s) GEO-KOMPSAT-2A satellite is almost identical to ABI, except for a single band. Another example is the NOAA and the European Organisation for the Exploitation of Meteorological Satellites (EUMETSAT)’s Long-Term Cooperation Agreement, signed in 2013, which builds on a 30-year partnership in geostationary, polar-orbiting, and ocean altimetry satellites that has resulted in cost-saving benefits and increased the robustness of both agencies’ observing systems. Similar agreements are in place with China, Korea, France, Canada, India, Australia, and other European agencies. *Another chapter of the story of NASA–NOAA collaboration was told in “Nimbus Celebrates 50 Years” article in the March-April 2015 issue of The Earth Observer [Volume 27, Issue 2, pp. 18-31 — https://eospso.nasa.gov/sites/default/files/eo_pdfs/Mar_Apr_2015_color_508.pdf ] ** The concept of “Research to Operations” has steadily evolved under the direction of NASA and NOAA, and has been extensively studied by the National Academy of Science. To learn more, visit https://www.nap.edu/read/10658/chapter/4#13 or https://www.nap.edu/read/10658/chapter/7 *** Animated images from the JMA’s AHI on Himawari-8, which is positioned over the Western Pacific, are available at http://www.goes.noaa.gov/f_himawari-8.html |
1) J. D. Harrington, ”GOES-17 Mishap Investigation Board Study Completed,” NASA Release 19-057, 1 August 2019, URL: https://www.nasa.gov/
press-release/goes-17-mishap-investigation-board-study-completed
2) ”GOES-17 Is Now Operational. Here’s What It Means for Weather Forecasts in the Western U.S.,” NOAA NESDIS, 12 February 2019, URL: https://www.nesdis.noaa.gov/content/
goes-17-now-operational-here%E2%80%99s-what-it-means-weather-forecasts-western-us
3) ”Get Ready to Drift: GOES-17 Begins Move to Its New Operational Position,” NOAA/NESDIS, 22 October 2018, URL: https://www.nesdis.noaa.gov/content/
get-ready-drift-goes-17-begins-move-its-new-operational-position
4) ”NASA, NOAA Convene GOES 17 Mishap Investigation Board,” NASA Release 18-082, 2 October 2018, URL: https://www.nasa.gov/press-release/nasa-noaa-convene-goes-17-mishap-investigation-board
5) ”NOAA Shares First Infrared Imagery from GOES-17,” NOAA. 8 August 2018, URL:
https://www.goes-r.gov/featureStories/firstInfraredImageryFromGOES-17.html
6) ”GOES-S Reaches Geostationary Orbit,” NOAA, 12 March 2018, URL:
http://goes-r.noaa.gov/featureStories/GOES-SReachesGeostationaryOrbit.html
7) ”GOES-East Full Disk View - GeoColor,” NOAA, March 2018, URL: https://www.star.nesdis.noaa.gov/GOES/GOES16_FullDisk_Band.php?band=GEOCOLOR&length=24
8) ”Exciting Imagery Available from the NEW GOES-East!,” NOAA/NESDIS, 18 Dec. 2017, URL: https://www.nesdis.noaa.gov/GOES-R-Series
9) ”NOAA’s GOES-16, now at GOES-East, ready to improve forecasts even more,” NOAA, 18 Dec. 2017, URL: http://www.noaa.gov/media-release/
noaa-s-goes-16-now-at-goes-east-ready-to-improve-forecasts-even-more
10) ”NOAA Prepares to Move GOES-16 into GOES East Position,” NOAA NESDIS, 23 Oct. 2017, URL: https://web.archive.org/web/20171101211903/https://www.nesdis.noaa.gov/GOES-16
11) ”Fog Fills the Strait of Juan de Fuca,” NASA Earth Observatory, June 14, 2017, URL: https://earthobservatory.nasa.gov/IOTD/view.php?id=90356
12) ”NOAA’s newest geostationary satellite will be positioned as GOES-East this fall,” NOAA, May 25, 2017, URL: http://www.noaa.gov/media-release/
noaa-s-newest-geostationary-satellite-will-be-positioned-as-goes-east-fall
13) ”Scientists Begin Field Campaign for NOAA’s GOES-16,” NOAA/NESDIS, March 22, 2017, URL: https://www.nesdis.noaa.gov/content/scientists-begin-field-campaign-noaa%E2%80%99s-goes-16
14) Kyle Herring, ”NASA's High-Altitude Plane Takes to the Sky for GOES-16 Field Campaign,” Space Daily, April 12, 2017, URL: http://www.spacedaily.com/reports/
NASAs_High_Altitude_Plane_Takes_to_the_Sky_for_GOES_16_Field_Campaign_999.html
15) Michelle Smith, ”Flashy First Images Arrive From NOAA’s GOES-16 Lightning Mapper,” NASA, March 6, 2017, URL: https://www.nasa.gov/feature/goddard/2017/
flashy-first-images-arrive-from-noaa-s-goes-16-lightning-mapper
16) http://www.goes-r.gov/mission/firstGLM_images.html
17) ”SUVI Instrument On Board NOAA's GOES-16 Sends First Solar Images,” NOAA, Feb. 27, 2017, URL: https://www.nesdis.noaa.gov/GOES-16
18) Rob Gutro, ”New Data from NOAA GOES-16’s Space Environment In-Situ Suite (SEISS) Instrument,” NASA, Feb. 10, 2017, URL: https://www.nasa.gov/feature/goddard/2017/
new-data-from-noaa-goes-16-s-space-environment-in-situ-suite-seiss-instrument
19) ”NOAA's GOES-16 EXIS Instrument Observes Solar Flares,” NASA, Feb. 3, 2017, URL: https://www.nasa.gov/feature/goddard/2017/
noaas-goes-16-exis-instrument-observes-solar-flares
20) John Leslie, ”NOAA’s GOES-16 satellite sends first images to Earth,” NOAA News, Jan. 23, 2017, URL: http://www.spacedaily.com/reports/NOAAs_GOES_16_Satellite_Sends_First_Images_to_Earth_999.html
21) ”New Weather Satellite Sends First Images of Earth,” NASA, Jan. 23, 2017, URL: https://www.nasa.gov/image-feature/new-weather-satellite-sends-first-images-of-earth
22) ”GOES-16 image gallery,” NOAA/NESDIS, URL:
https://www.nesdis.noaa.gov/content/goes-16-image-gallery
23) ”Scientists Receive Preliminary Data from GOES-16's Magnetometer,” NOAA, January 5, 2017, URL: https://web.archive.org/web/20170111173135/https://www.nesdis.noaa.gov/GOES-R-Launch
24) ”GOES-R is now GOES-16!,” NOAA/NESDIS, Nov. 30, 2016, URL:
https://www.nesdis.noaa.gov/GOES-R-Launch
25) Ernest Hilsenrath, Heather Hanson, Mitchell K. Hobish, ”GOES-16: The First in a New Generation of Geostationary Satellites,” NASA, The Earth Observer, November-December 2017, Volume 29, Issue 6, pp: 4-14, URL: https://eospso.nasa.gov/sites/default/files/eo_pdfs/Nov_Dec_2017_color_508.pdf
The information compiled and edited in this article was provided by Herbert J. Kramer from his documentation of: ”Observation of the Earth and Its Environment: Survey of Missions and Sensors” (Springer Verlag) as well as many other sources after the publication of the 4th edition in 2002. - Comments and corrections to this article are always welcome for further updates (herb.kramer@gmx.net).