GOLD (Global-scale Observations of the Limb and Disk)
EO
Atmosphere
NASA
Space environment
Quick facts
Overview
| Mission type | EO |
| Agency | NASA |
| Mission status | Operational (nominal) |
| Launch date | 25 Jan 2018 |
| Measurement domain | Atmosphere |
| Instrument type | Space environment, Magnetic field |
| CEOS EO Handbook | See GOLD (Global-scale Observations of the Limb and Disk) summary |
GOLD (Global-scale Observations of the Limb and Disk) Hosted Payload in GEO
Spacecraft Launch Mission status Instrument References
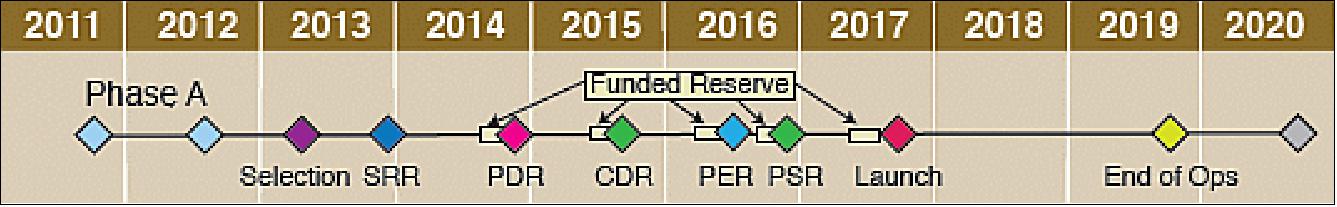
The GOLD project is a mission of opportunity and part of NASA’s Explorer Program, designed to provide frequent, low-cost access to space for heliophysics and astrophysics missions with small to mid-sized spacecraft. The mission is a collaboration between LASP (Laboratory for Atmospheric and Space Physics) at the University of Colorado in Boulder, CO, UCF (University of Central Florida) in Orlando, FL, and the commercial communications satellite company, SES-GS (Government Solutions), Reston, VA. Note: In 2011, SES-GS was introduced as part of the global SES family. 1) 2) 3) 4) 5)
UCF was awarded a $55 million NASA grant to build and launch into space an instrument the size of a microwave oven that will provide unprecedented imaging of the Earth’s upper atmosphere. The award is the largest single grant in UCF’s history, and UCF will become the first Florida university to lead a NASA mission. 6)
GOLD is a NASA Explorer mission of opportunity to build and launch an instrument to provide unprecedented imaging of the Earth’s upper atmosphere from a geostationary orbit. The information collected by the GOLD mission will have a direct impact on understanding space weather and its impact on communication and navigation satellites, which we’ve come to rely on for everything from television programming to cell phone coverage and GPS in our vehicles.
In addition to providing the compact instrument, LASP will provide project management, systems engineering, safety and mission assurance, instrument operations, and Education and Public Outreach (E/PO) for the mission. Under the leadership of GOLD PI (Principal Investigator) Richard Eastes of UCF, UCF will oversee the project, and build the data center that will collect, process, and distribute the science data for the mission.
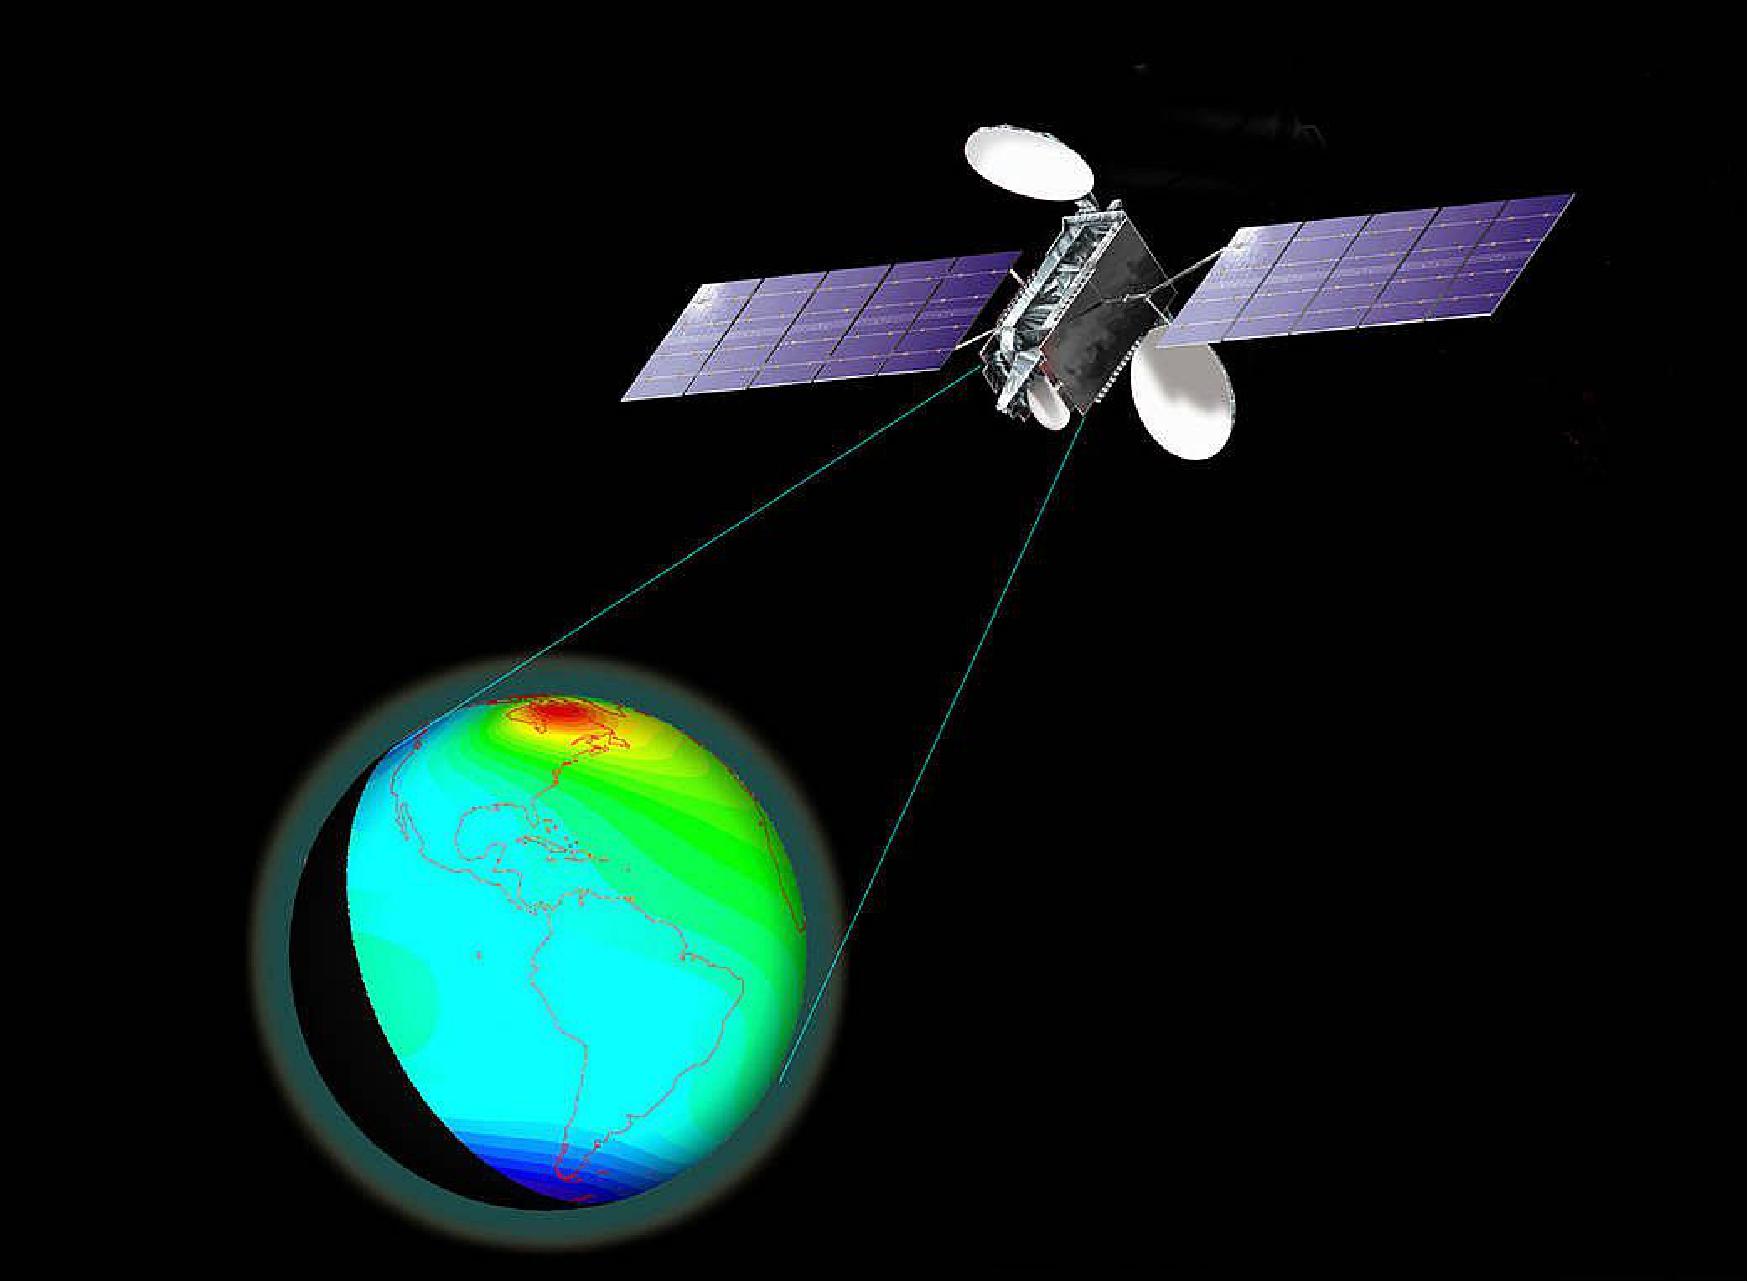
An important aspect of the mission is that GOLD will be one of the first NASA science missions to fly as a hosted payload on a commercial communications satellite. This is by far the most cost-effective way to put a science instrument into geostationary orbit, where it can observe nearly a full hemisphere of the Earth all of the time.
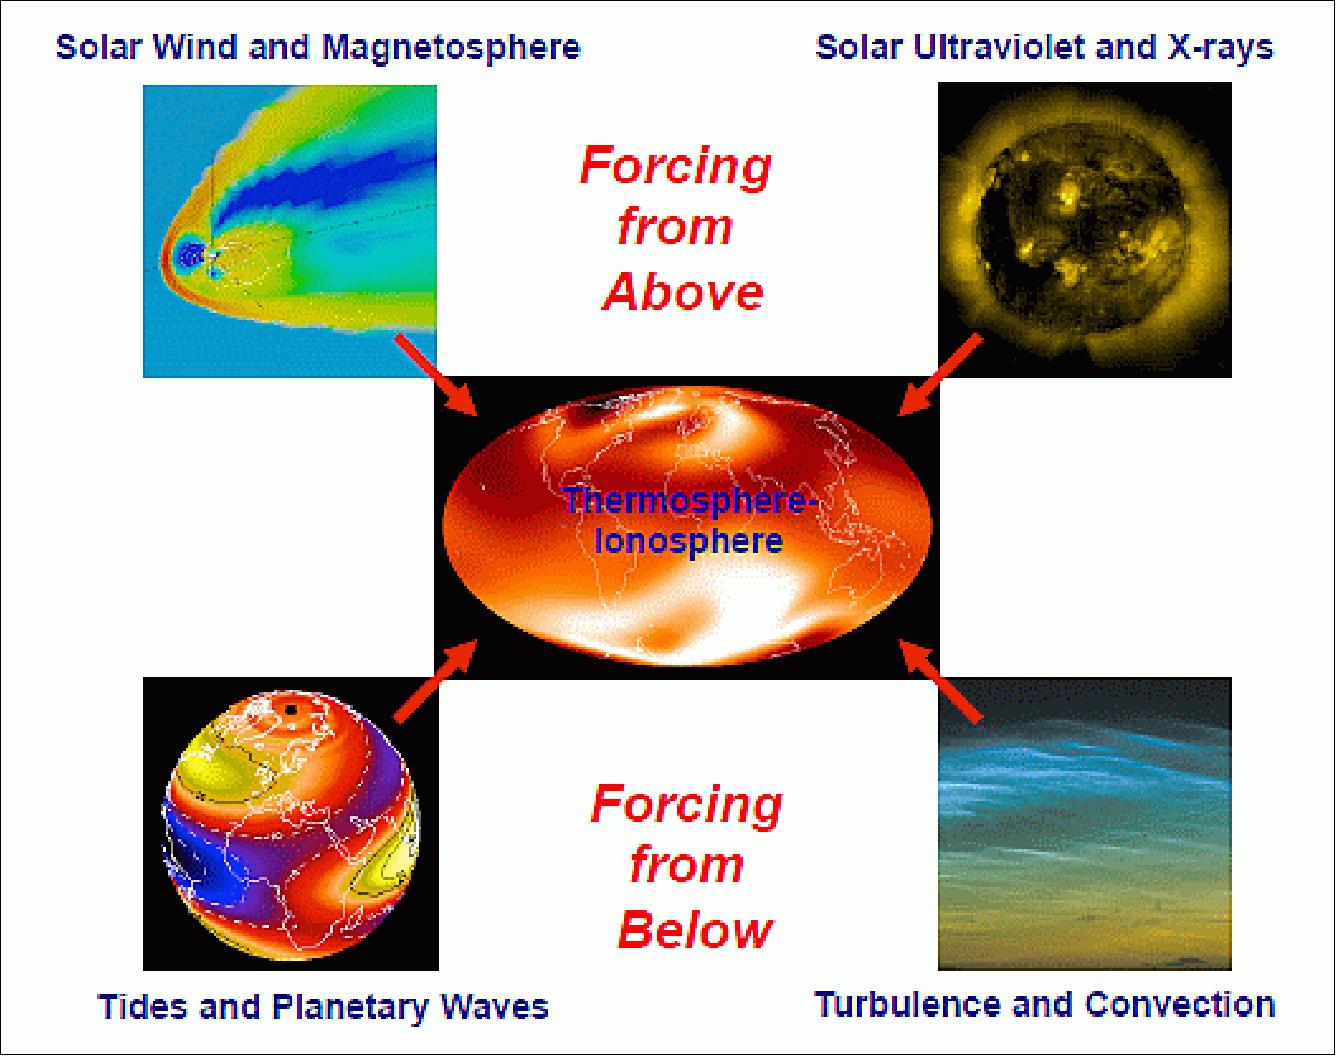
The goal of the GOLD imaging mission is the study of the boundary layer between Earth and space and to address four primary science questions:
1) How do geomagnetic storms alter the temperature and composition structure of the thermosphere?
2) What is the global-scale response of the thermosphere to solar extreme-ultraviolet variability?
3) How significant are the effects of atmospheric waves and tides propagating from below on thermospheric temperature structure?
4) How does the nighttime equatorial ionosphere influence the formation and evolution of equatorial plasma density irregularities?
GOLD is a NASA PI (Principal Investigator) mission, lead by Richard W. Eastes of UCF (University of Central Florida). UCF will oversee the project and build the data center that will collect, process and distribute the data for the mission. LASP will build the compact instrument, which will operate in a geostationary orbit, and SES-GS is scheduled to launch the hosted payload on one of its communication satellites in 2017.
Other members of the GOLD team that will be supporting the mission include NCAR (National Center for Atmospheric Research), UCB (University of California at Berkeley), Computational Physics Inc., and NOAA (National Oceanic and Atmospheric Administration).
Spacecraft
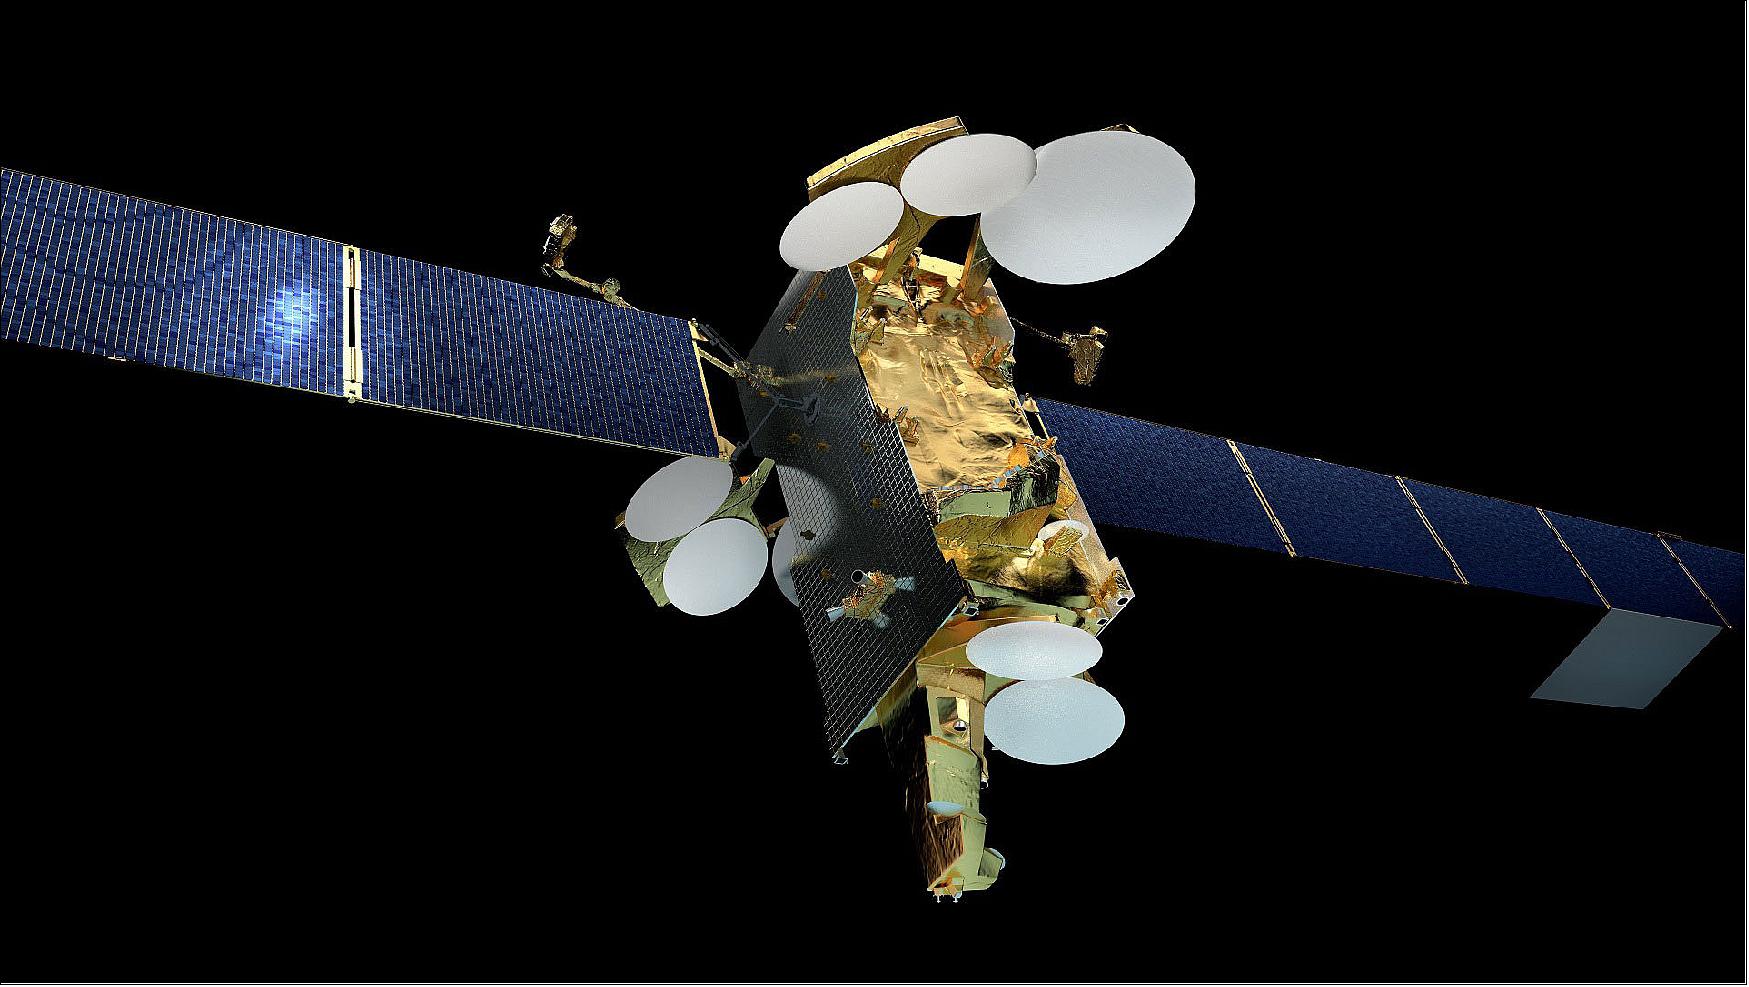
SES-14 is a geostationary communications satellite operating in C- and Ku-bands across the Americas and the North Atlantic region, which uses electric propulsion for initial orbit raising and all on-orbit maneuvers. The spacecraft is being built by Airbus Space and Defence, based on the Eurostar E3000 EOR (Electric Orbit Raising) platform, which exclusively uses electric propulsion for orbit raising. SES-14 will replace SES's satellite NSS-806 and add new capacity. 7)
The satellite combining power and flexibility will have a double mission. The first will be a wide-beam payload of C- and Ku-band, covering the Americas plus a link to Europe. The other payload, called HTS (High Throughput Satellite) with numerous user beams, will combine an on-board processor with multi-beam coverage of the Americas and the North Atlantic. The Ku-band wide beams will bring augmented capacity to serve growing video neighborhoods in the Americas and support existing VSAT services. The HTS Ku-band multi-spot beams (20) are ideal for traffic-intensive data applications such as mobile backhaul, maritime and aeronautical services.
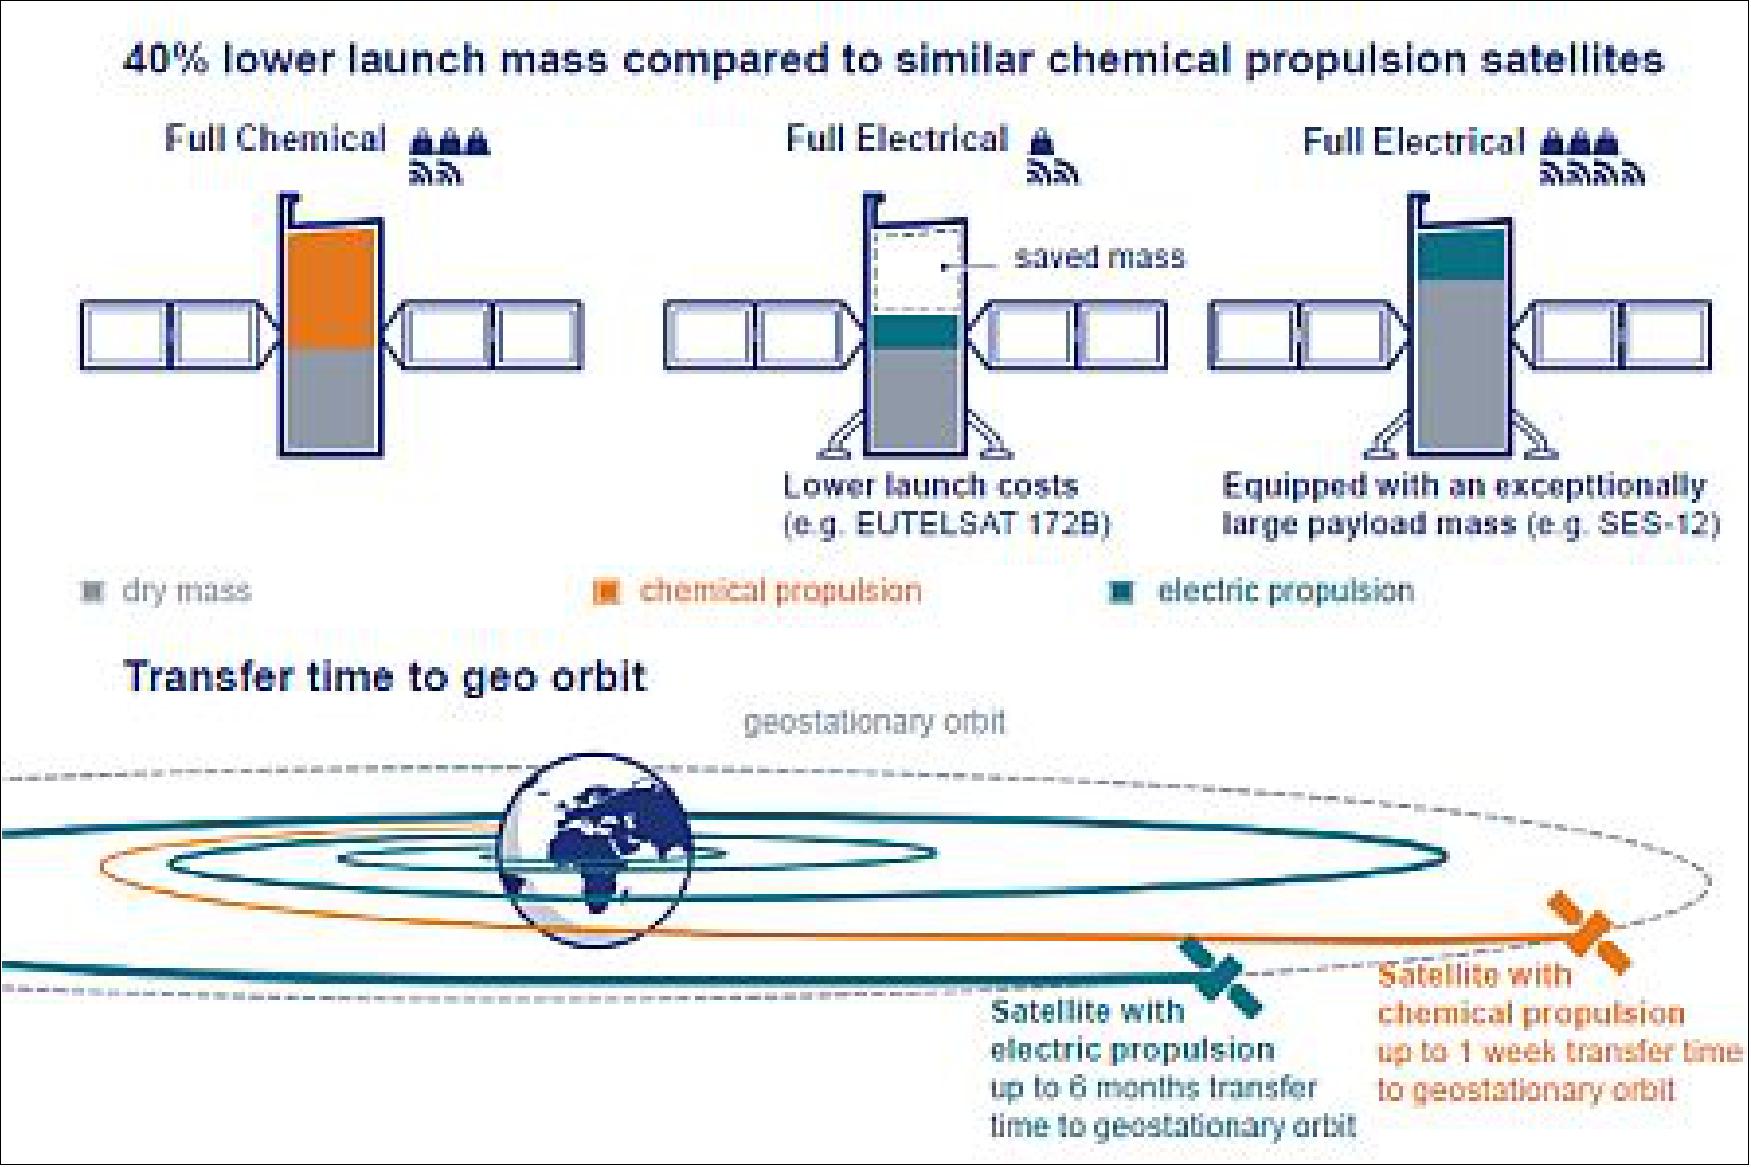
SES-14 will carry seven antennas. It will have a take-off weight of 4,200 kg and an electric power of 16 kW. The satellite is scheduled for launch in late 2017 and its electric propulsion system will enable it to reach geostationary orbit in four months, depending on the type of launcher used.
Electric propulsion makes it possible to reduce the mass of satellites, leading to lower launch costs for a given mission and/or a more capable satellite for a given mass. Airbus Defence and Space has been using electric propulsion for station keeping for more than ten years, and is building the first large satellites using only electric propulsion for initial orbit raising. 8)
GOLD will transmit data from a geostationary orbit at a fast pace, to build up a full-disk view every half hour, providing detailed large-scale measurements of the response of the upper atmosphere to forcing from the Sun, the magnetosphere, and the lower atmosphere.
Hosted GOLD Payload
Flying as a hosted payload on a commercial communications satellite, GOLD takes advantage of the resource margins available in the early years of the commercial mission’s planned 15-year life. This hosted payload approach is a pathfinder for cost-effective NASA science missions. 9)
The affordable ride to GEO makes it possible for an Explorer-class Mission of Opportunity to perform FUV (Far UltraViolet) imaging of nearly a complete hemisphere on a 30-minute cadence. This global-scale, high-cadence imaging will enable GOLD to distinguish between spatial and temporal variations in the TI (Thermosphere Ionosphere) system caused by geomagnetic storms, variations in solar EUV, and forcing from the lower atmosphere.
The most significant difference between developing instrumentation for a NASA-owned mission and accomplishing the same task for a commercial satellite is that communications satellites are procured on a faster schedule - 24 to 36 months from satellite contract to launch - than the instrument development. GOLD has partnered with SES Government Solutions (SES-GS), the comsat mission owner-operator, to define instrument interfaces and requirements that will be included in the eventual Request for Proposal to candidate spacecraft vendors. SES-GS launches 3 to 4 missions per year, which allows the GOLD-SES-GS partnership to match the instrument’s launch readiness date with a suitable mission.
Development Status
• December 22, 2017: SES-14 has arrived safely at the Guiana Space Center in Kourou, French Guiana, in preparation for launch by an Ariane 5 vehicle in January 2018. 11)
- SES-14 was built by Airbus Defence and Space and is an electric satellite. It will rely fully on electric propulsion and will be equipped with an electric plasma propulsion system for orbit raising and in-orbit maneuvers. The new spacecraft also features a Digital Transparent Processor (DTP), which increases payload flexibility and will provide customized bandwidth solutions to SES’s customers.
• May 23, 2017: SES-GS (Société Européenne des Satellites-Government Solutions) today announced the successful integration of NASA’s GOLD (Global-Scale Observations of the Limb and Disk) hosted payload with the SES-14 communication satellite. 13) 14)
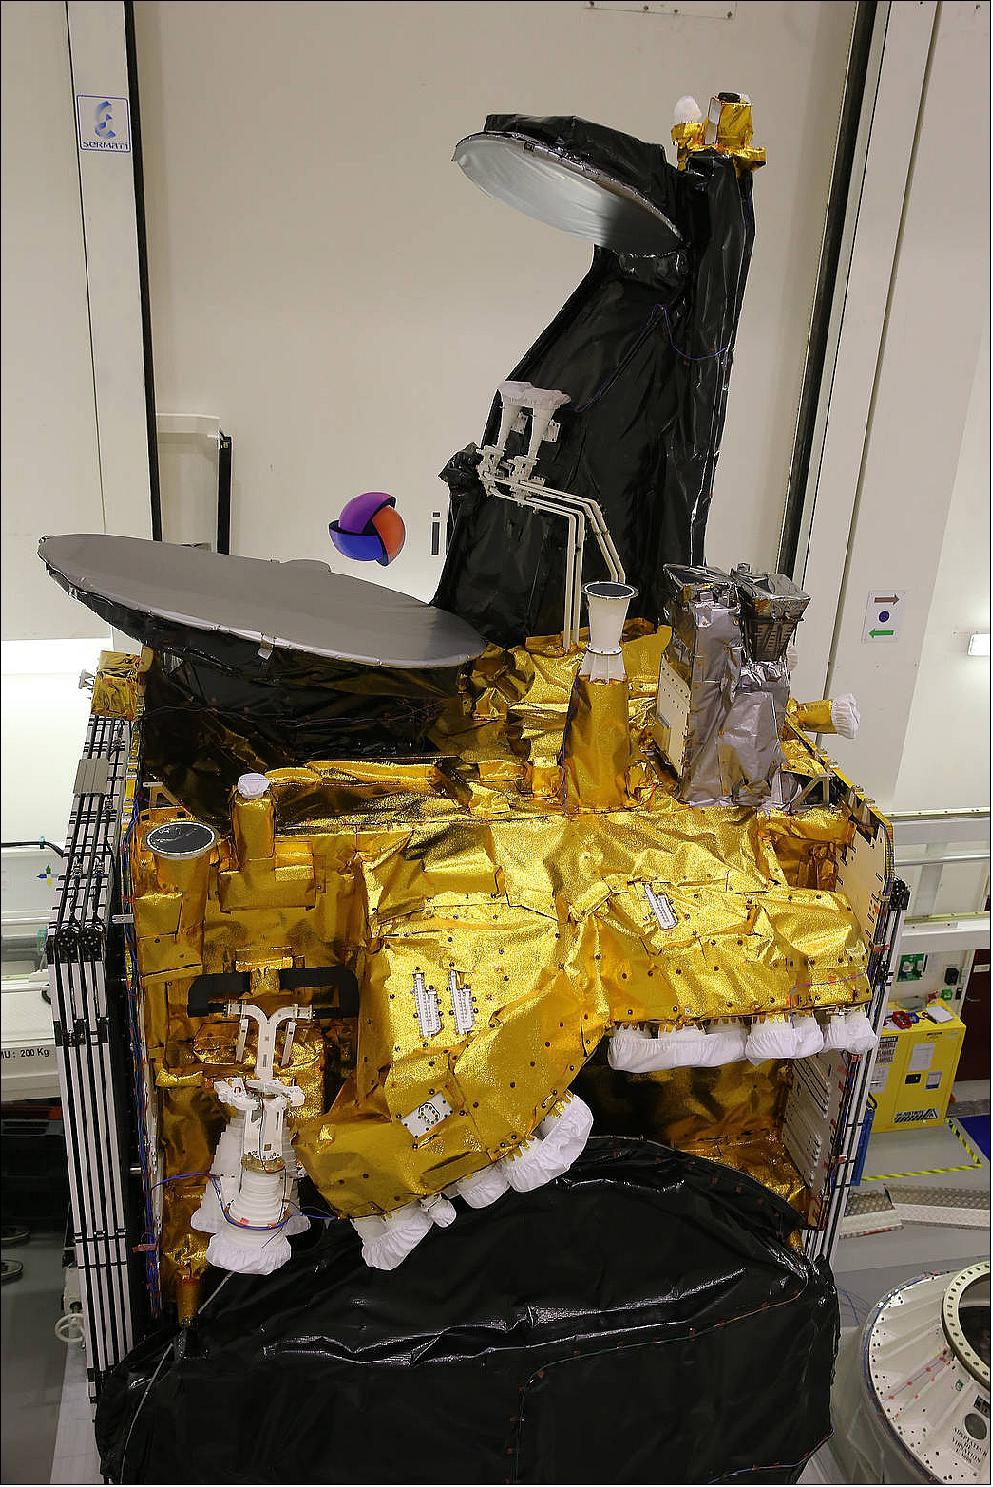
- Marking a significant milestone in the lead up to launch, GOLD was integrated onto the SES-14 satellite in preparation for a series of environmental tests at Airbus Defence and Space in Toulouse, France. Airbus DS is building the SES-14 satellite for SES-GS.
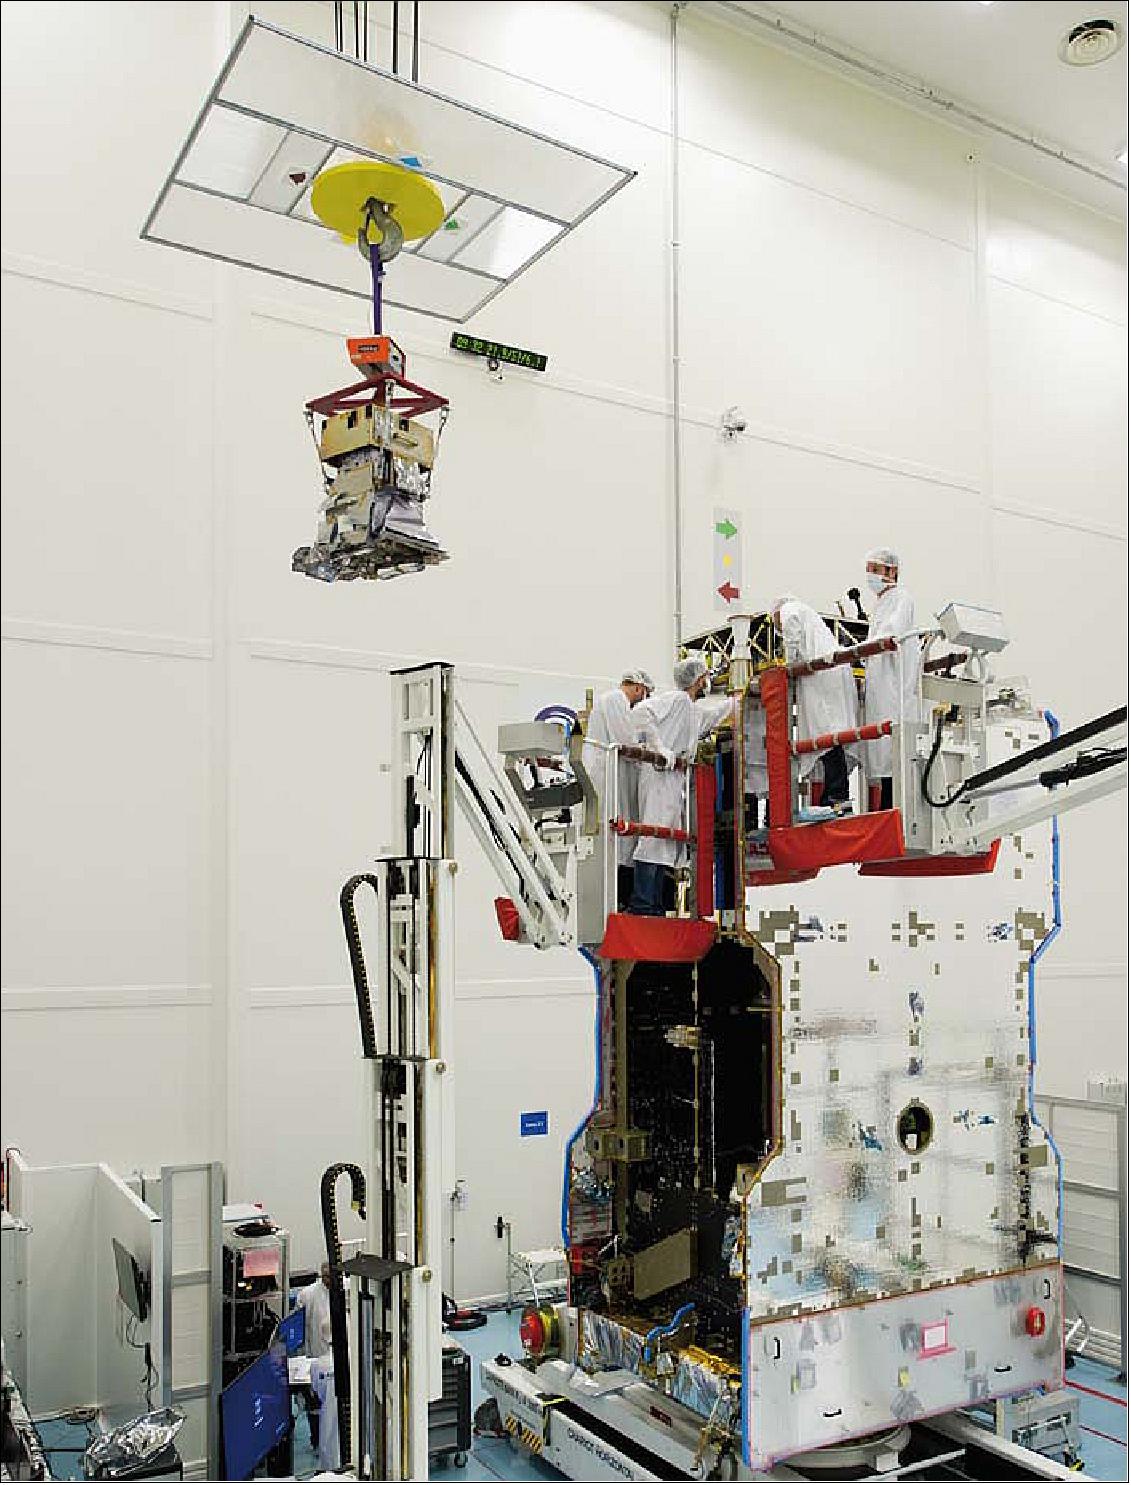
• January 4, 2017: A NASA instrument that will study the upper atmosphere and the impact of space weather on Earth is a step closer on its journey into space. The LASP-built instrument was shipped to Airbus Defence and Space in Toulouse, France, for integration on the SES-14 communications satellite. 15)
- GOLD is a pathfinder for NASA’s use of commercial spacecraft for science missions. UCF and LASP partnered with SES Government Solutions (SES-GS), based in Reston, VA, to provide GOLD with its ride into geostationary orbit on the SES-14 satellite that is owned and operated by SES, the parent company of SES-GS.
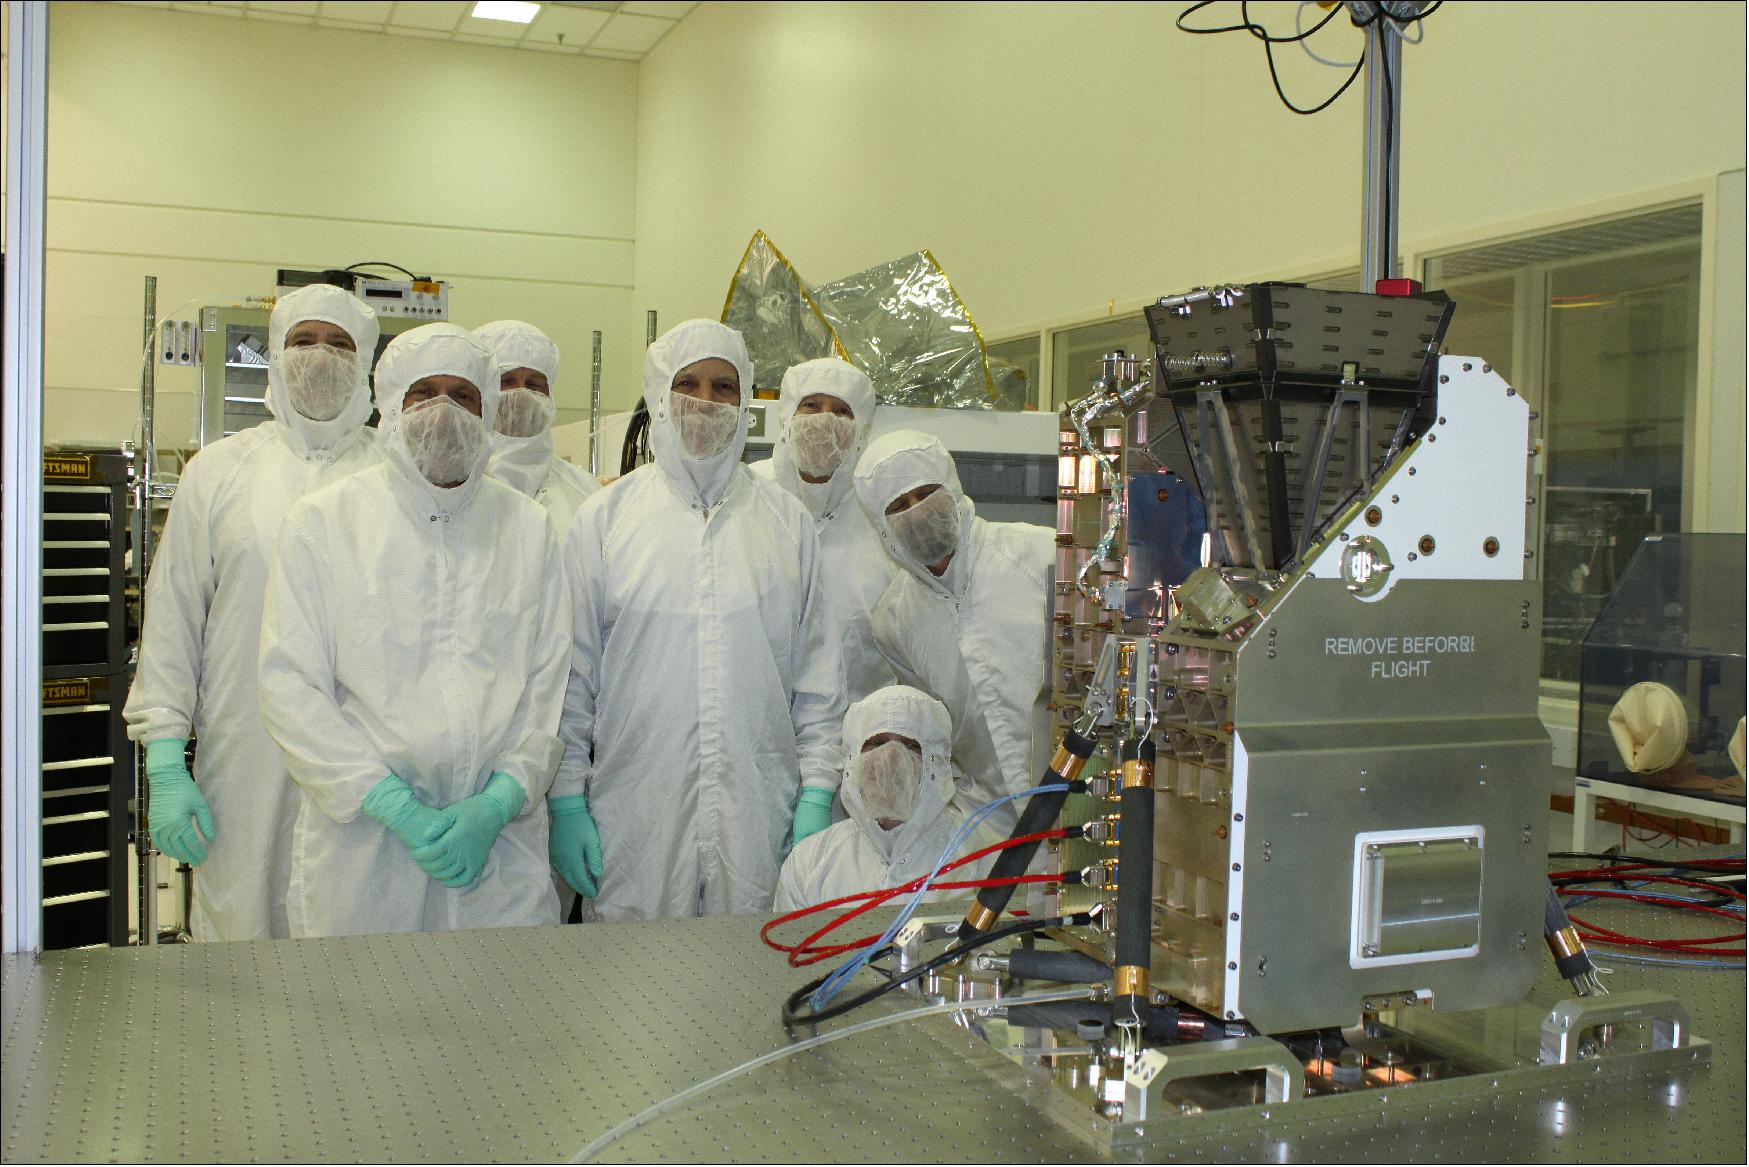
• December 1, 2016: Photo of the GOLD science team and the GOLD instrument. 16)
Launch
The GOLD payload was launched as a hosted payload on the SES-14 communication satellite of SES-GS (SES Government Solutions) on 25 January 2018 (22:20 UTC). SES-14 was built by Airbus DS. The launch vehicle was Ariane-5 ECA and the launch complex was ELA-3 in Kourou (flight VA241). - The second communication satellite on this flight was Al Yah-3 of Yahsat. Built by Orbital ATK, Al Yah-3 will support broadband Internet and data services over Africa and Brazil for Yahsat Satellite Communications Company of Abu Dhabi.
According to Arianespace, a few seconds after ignition of the upper stage, the second tracking station located in Natal, Brazil, did not acquire the launcher telemetry. This lack of telemetry lasted throughout the rest of powered flight. Subsequently, both satellites were confirmed separated, acquired and they are on orbit. SES-14 and Al Yah 3 are communicating with their respective control centers. Both missions are continuing. 17)
Both satellites, SES-14 and Al Yah-3, use all-electric propulsion for orbit raising in GTO (Geosynchronous Transfer Orbit) and in-orbit maneuvers.
The University of Colorado announced in April 2015 that it had awarded a five-year contract to SES- GS VA, to host a NASA-funded science instrument on board SES-14, a communications satellite to be stationed over the Americas. 18)
The contract award, made by the University of Colorado, a partner in the project, will give the GOLD payload the ride it needs to geostationary orbit on board SES-14, a communications satellite to be stationed over the Americas. From there, the microwave-sized device will transmit data of how Earth’s upper atmosphere responds to solar impacts back to scientists for analysis. 19)
Orbit of SES-14: Geostationary orbit, altitude of 35,786 km, location = 47.5º W.
SES-14 will fulfill two primary missions: its C-band wide beams are specifically designed for SES's expanding cable neighborhood in Latin America, while its Ku-band HTS spot beams will provide expansion capacity to serve the dynamic aeronautical and maritime markets and other traffic-intensive applications, such as cellular backhaul or broadband delivery services.
With the launch of Al Yah-3, Yahsat's commercial Ka-band coverage will be extended to an additional 20 markets, reaching 60% of Africa's population and over 95% of Brazil's population. - Al Yah-3 will be positioned at 20 West Longitude.
The Al Yah-3 satellite carries 53 active Ka-band user beams and four gateway beams, and produces approximately 8.0 kW of payload electrical power. The Ka-band spot beams provide two-way communications services to facilitate high-speed delivery of data to end-user applications such as broadband Internet and corporate networking as well as IP backhaul for telecommunications service providers.
Al Yah-3 was built by Orbital ATK using its new GEOStar-3 hybrid platform, the first application of this platform.
Mission Status
• October 18, 2021: New results from NASA satellite data show that space weather – the changing conditions in space driven by the Sun – can heat up Earth’s hottest and highest atmospheric layer. 20)
- The findings, published in July in Geophysical Research Letters, used data from NASA’s GOLD (Global Observations of the Limb and Disk) mission. Launched in 2018 aboard the SES-14 communications satellite, GOLD looks down on Earth’s upper atmosphere from what’s known as geosynchronous orbit, effectively “hovering” over the western hemisphere as Earth turns. GOLD’s unique position gives it a stable view of one entire face of the globe – called the disk – where it scans the temperature of Earth’s upper atmosphere every 30 minutes. 21)

- “We found results that were not previously possible because of the kind of data that we get from GOLD,” said Fazlul Laskar, who led the research. Dr. Laskar is a research associate at the Laboratory for Atmospheric and Space Physics at the University of Colorado, Boulder.
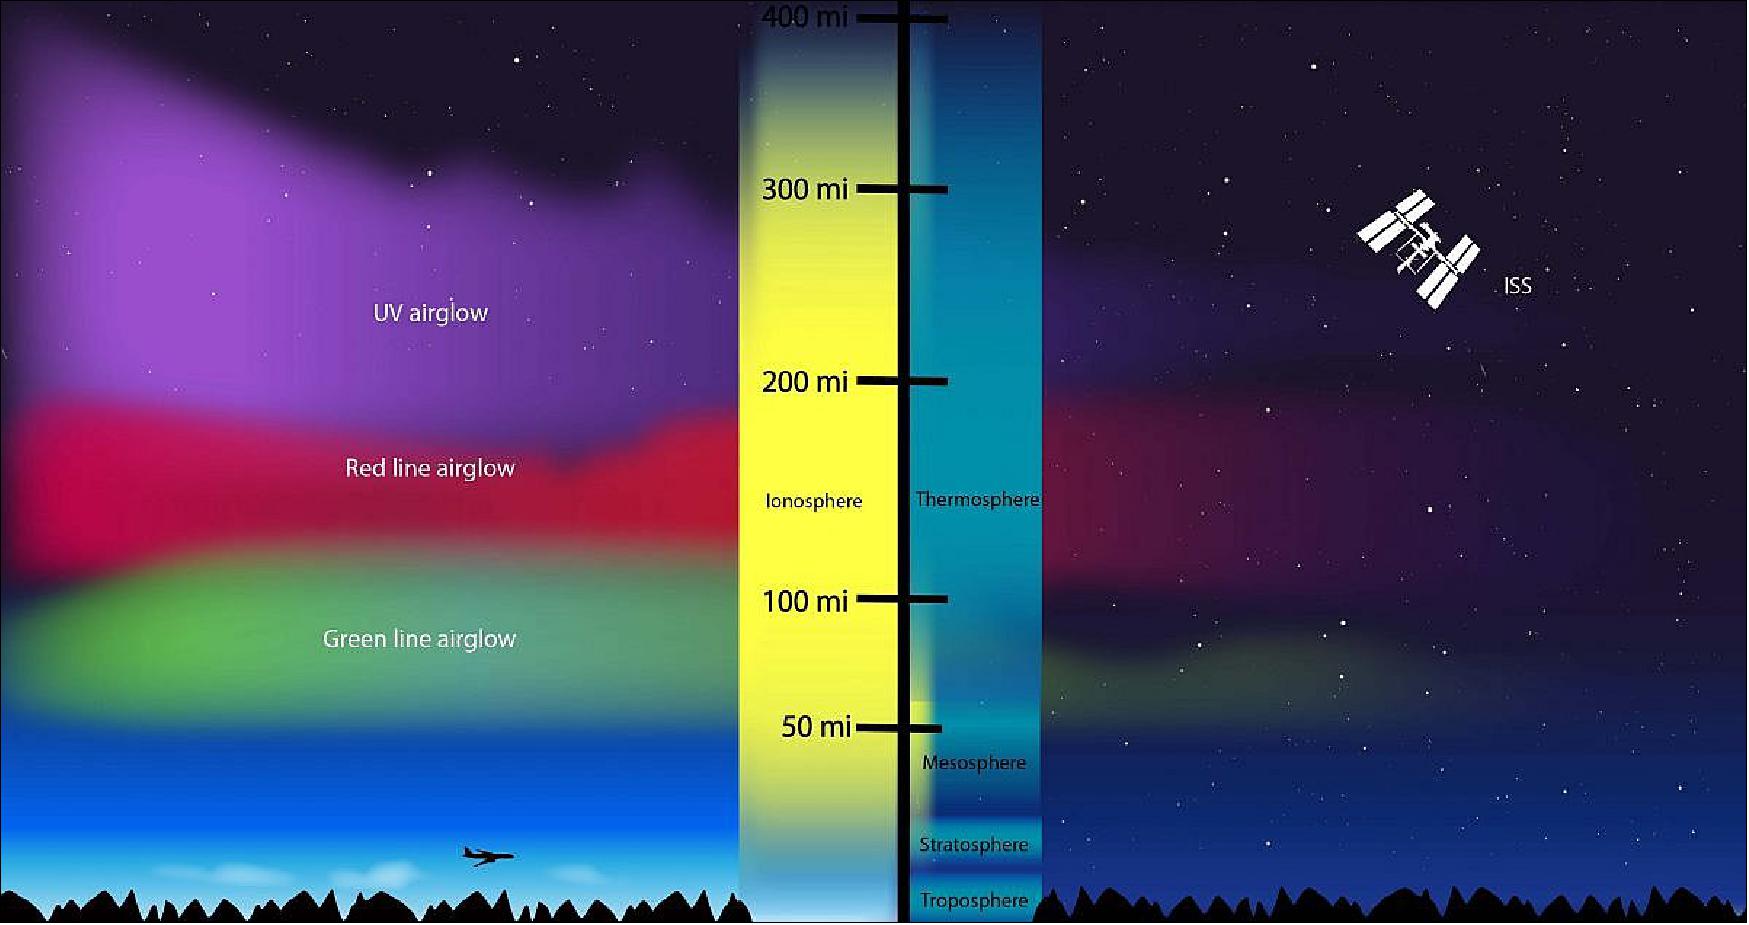
- From its perch some 35,786 kilometers above us, GOLD looks down on the thermosphere, a region of Earth’s atmosphere between about 53 and 373 miles (85 and 600 km) high. The thermosphere is home to the aurora, the International Space Station, and the highest temperatures in Earth’s atmosphere, up to 2,700 °F (1,500 °C). It reaches such incredible temperatures by absorbing the Sun’s high-energy X-rays and extreme ultraviolet rays, heating the thermosphere and stopping these types of light from making it to the ground.
- But the new findings point to some heating not driven by sunlight, but instead by the solar wind – the particles and magnetic fields continuously escaping the Sun.
- The solar wind is always blowing, but stronger gusts can disturb Earth’s magnetic field, inducing so-called geomagnetic activity. Laskar and his collaborators compared days with more geomagnetic activity to days with less, and found an increase of over 160 °F (90 °C) in thermospheric temperatures. Magnetic disturbances, driven by the Sun, were heating up Earth’s hottest atmospheric layer.
- Some amount of heating was expected near Earth’s poles, where a weak point in our magnetic field allows some solar wind to pour into our upper atmosphere. But GOLD’s data showed temperature increases across the whole globe – even near the equator, far from any incoming solar wind.
- Laskar and colleagues suggest it has to do with changing circulation patterns. There’s a swirling of air high above us — a global circulation that pushes air from the equator up to the poles and back around at lower altitudes. As the solar wind pours into the thermosphere near the poles, the added energy can alter this circulation pattern, driving winds and atmospheric compression that can raise temperatures even far away.
- Changing circulation might also underlie another surprise finding. GOLD’s data showed the amount of heat added depended on the time of day. The team discovered a stronger effect in the morning hours compared to that in the afternoon. They suspect that geomagnetic activity might especially strengthen the circulation during the night and early morning hours, though this explanation awaits confirmation in further studies.
- Laskar was most impressed with the subtlety of the changes they could detect in GOLD’s data.
- “We used to believe that only prominent geomagnetic events could change the thermosphere,” Laskar said. “We are now seeing that even minor activity can have an impact.”
- With its steady stream of temperature measurements, GOLD is painting a picture of an upper atmosphere much more sensitive to the magnetic conditions around Earth than previously thought.
• August 30, 2021: New research of the GOLD mission has revealed unexpected behavior in the swaths of charged particles that band Earth’s equator – made possibly by GOLD’s long-term global view, the first of its kind for this type of measurement. 22)
- GOLD is in geostationary orbit, which means it orbits around Earth at the same pace the planet turns and “hovers” over the same spot overhead. This allows GOLD to watch the same area for changes over time across longitude and latitude, something that most satellites studying the upper atmosphere can’t do.
- “Since GOLD is on a geostationary satellite, we can capture 2D time evolution of these dynamics,” said Dr. Xuguang Cai, a researcher at the High Altitude Observatory in Boulder, Colorado, and lead author on a new research paper.
- GOLD focuses on parts of Earth’s upper atmosphere stretching from about 50 to 400 miles in altitude, including a neutral layer called the thermosphere and the electrically charged particles that make up the ionosphere. Unlike the neutral particles in most of Earth’s atmosphere, the ionosphere’s charged particles respond to the electric and magnetic fields threading through the atmosphere and near-Earth space. But because the charged and neutral particles are mixed together, something that influences one population can also impact the other.
- This means the ionosphere and upper atmosphere are shaped by a host of complex factors, including space weather conditions – such as geomagnetic storms, driven by the Sun – and terrestrial weather. These regions also act as a highway for many of our communications and navigation signals. Changes in the ionosphere’s density and composition can muddle the signals passing through, like radio and GPS.
- From its vantage point on a commercial communications satellite in geostationary orbit, GOLD makes hemisphere-wide observations of the ionosphere about every 30 minutes. This unprecedented birds-eye view is giving scientists new insights into how this region changes.
Mysterious Movement
- One of the nighttime ionosphere’s most distinctive features are twin bands of dense charged particles on either side of Earth’s magnetic equator. These bands – called the Equatorial Ionization Anomaly (EIA) – can change in size, shape, and intensity, depending on the conditions in the ionosphere.
- The bands can also move position. Until now, scientists have relied on data captured by satellites passing through the region, averaging measurements over months to see just how the bands might be shifting in the long term. But short-term changes were more difficult to track.
- Before GOLD, scientists suspected that any quick changes that happen in the bands would be symmetrical. If the northern band moves north, the southern band makes a mirror motion south. One night in November 2018, though, GOLD saw something that challenged this idea: the southern band of particles drifted southward, while the northern band remained steady – all in less than two hours.
- This isn’t the first time scientists have seen the bands move like this, but this shorter event – only about two hours, compared to a more typical six to eight hours seen prior – was seen for the first time, and could only have been observed by GOLD. The observations are outlined in a paper published on Dec. 29, 2020, in the Journal of Geophysical Research: Space Physics. 23)
- The symmetrical drifting of these bands is caused by rising air that drags charged particles along with it. As night falls and temperatures cool, warmer pockets of air surge upwards. The charged particles carried within these warmer air pockets are bound by magnetic field lines, and for those pockets near Earth’s magnetic equator the shape of Earth’s magnetic field means that upward motion also pushes the charged particles horizontally. This creates the symmetrical northward and southward drift of the two charged particle bands.
- The exact cause of the asymmetric drift observed by GOLD is still a mystery – though Cai suspects the answer lies in some combination of the many factors that shape the motion of electrons in the ionosphere: ongoing chemical reactions, electric fields, and high-altitude winds blowing through the region.
- Though surprising, these findings can help scientists peer behind the curtain of the ionosphere and better understand what drives its changes. Because it’s impossible to observe every process with a satellite or ground-based sensor, scientists rely heavily on computer models to study the ionosphere, much like models that help meteorologists predict weather on the ground. To create these simulations, scientists code in what they suspect are the underlying physics at work and compare the model’s prediction to observed data.
- Before GOLD, scientists got that data from occasional passing satellites and limited ground-based observations. Now, GOLD gives scientists a bird’s-eye view.
• April 2, 2021: New versions of Level 1 and Level 2 data from NASA’s Global-scale Observations of the Limb and Disk (GOLD) mission are now available via the GOLD website at https://gold.cs.ucf.edu
• January 14, 2021: A special collection of research in the Journal of Geophysical Research: Space Physics highlights the initial accomplishments of NASA’s GOLD mission. GOLD, short for Global-scale Observations of the Limb and Disk, is an ultraviolet imaging spectrograph that observes Earth from its vantage point on a commercial communications satellite in geostationary orbit. 24)
- Since beginning science operations in October 2018, GOLD has kept a constant eye on Earth’s dynamic upper atmosphere, watching changes in the Western Hemisphere, marked by changes in the temperature, composition and density of the gases in this region.
Highlights
- Results on one source of airglow seen at night, which relies on electrons on Earth’s day side becoming ionized by sunlight, then being transported along magnetic field lines to the nightside, where they create visible airglow (Solomon, et al)
- New evidence supporting the idea that the equatorial ionization anomaly appearing in the early morning — a prominent feature in the ionosphere with poorly-understood triggers that can disrupt radio signals — is linked to waves in the lower atmosphere (Laskar, et al)
- New observations of planet-scale waves in the lower atmosphere that drive change in the ionosphere (Gan, et al & England, et al)
- Multi-instrument measurements of plasma bubbles — “empty” pockets in the ionosphere that can disrupt signals traveling through this region because of the sudden and unpredictable change in density — that suggest they are could be seeded by pressure waves traveling upwards from the lower atmosphere (Aa, et al)
- Observations showing that plasma bubbles occur frequently at all of the longitudes covered by GOLD with different onset times, providing new information on the influence of the particular configuration of the geomagnetic field at these longitudes (Martinis, et al)
- Measurements of changes in the chemical composition of the thermosphere during the total solar eclipse of July 2, 2019, which give scientists an unprecedented hemisphere-wide look at how the reduction in solar radiation throughout an eclipse affects this part of the atmosphere (Aryal, et al)
- ”GOLD Publication,” Mission website, URL: https://gold.cs.ucf.edu/publications/
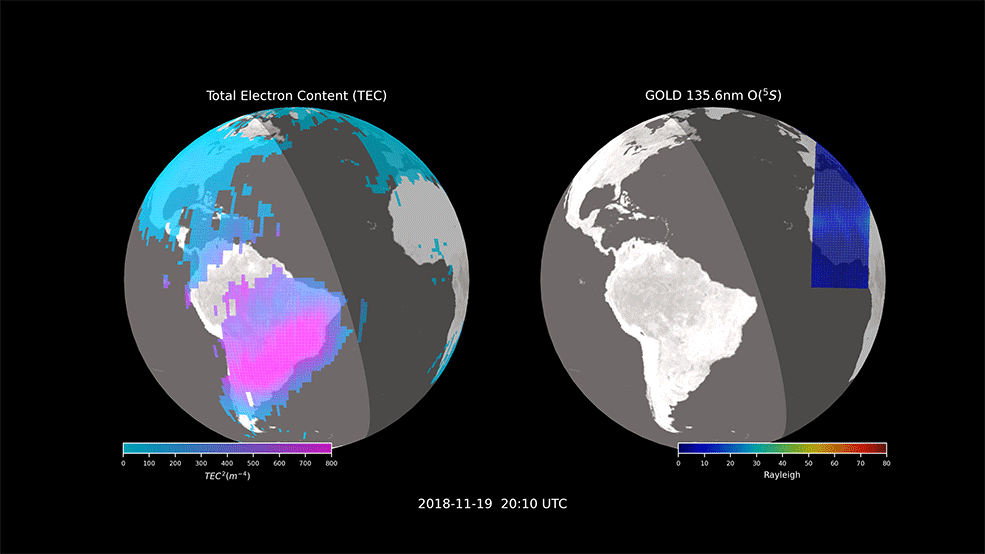
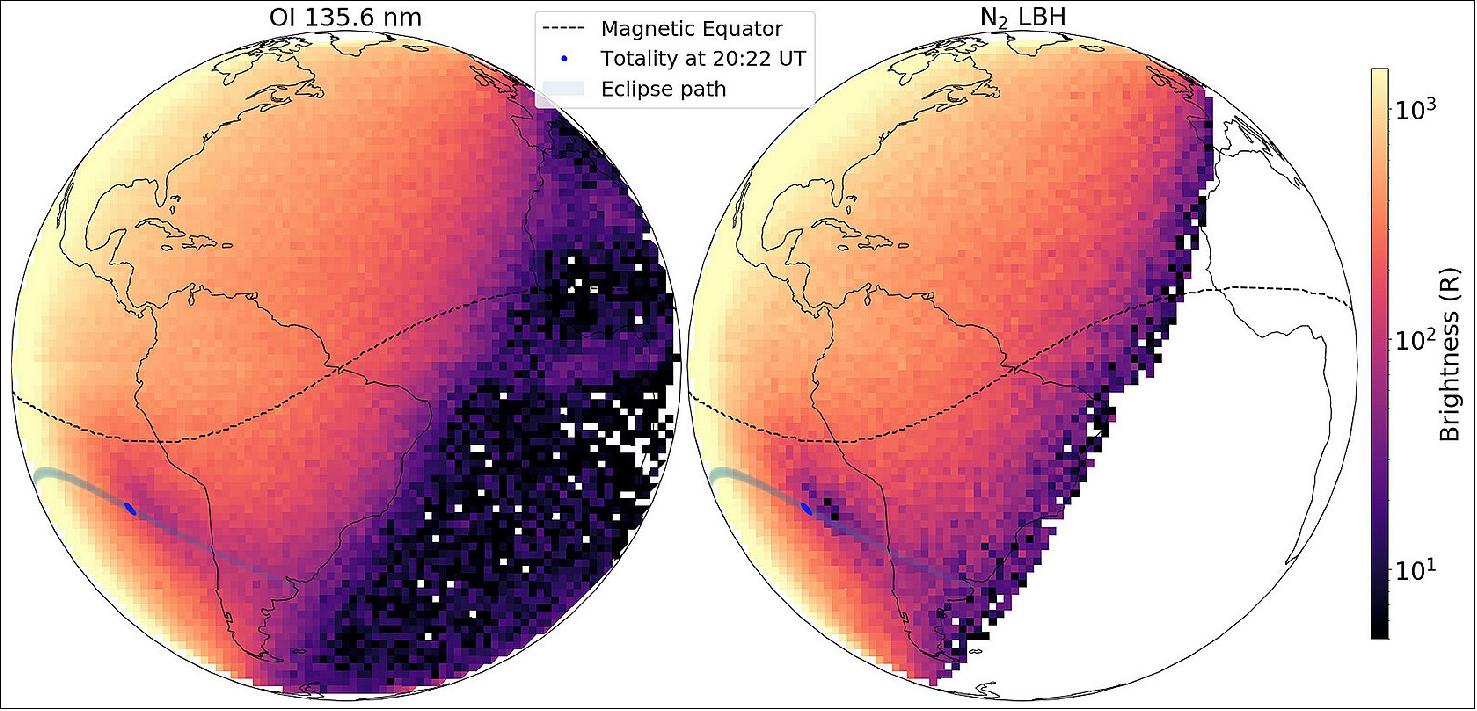
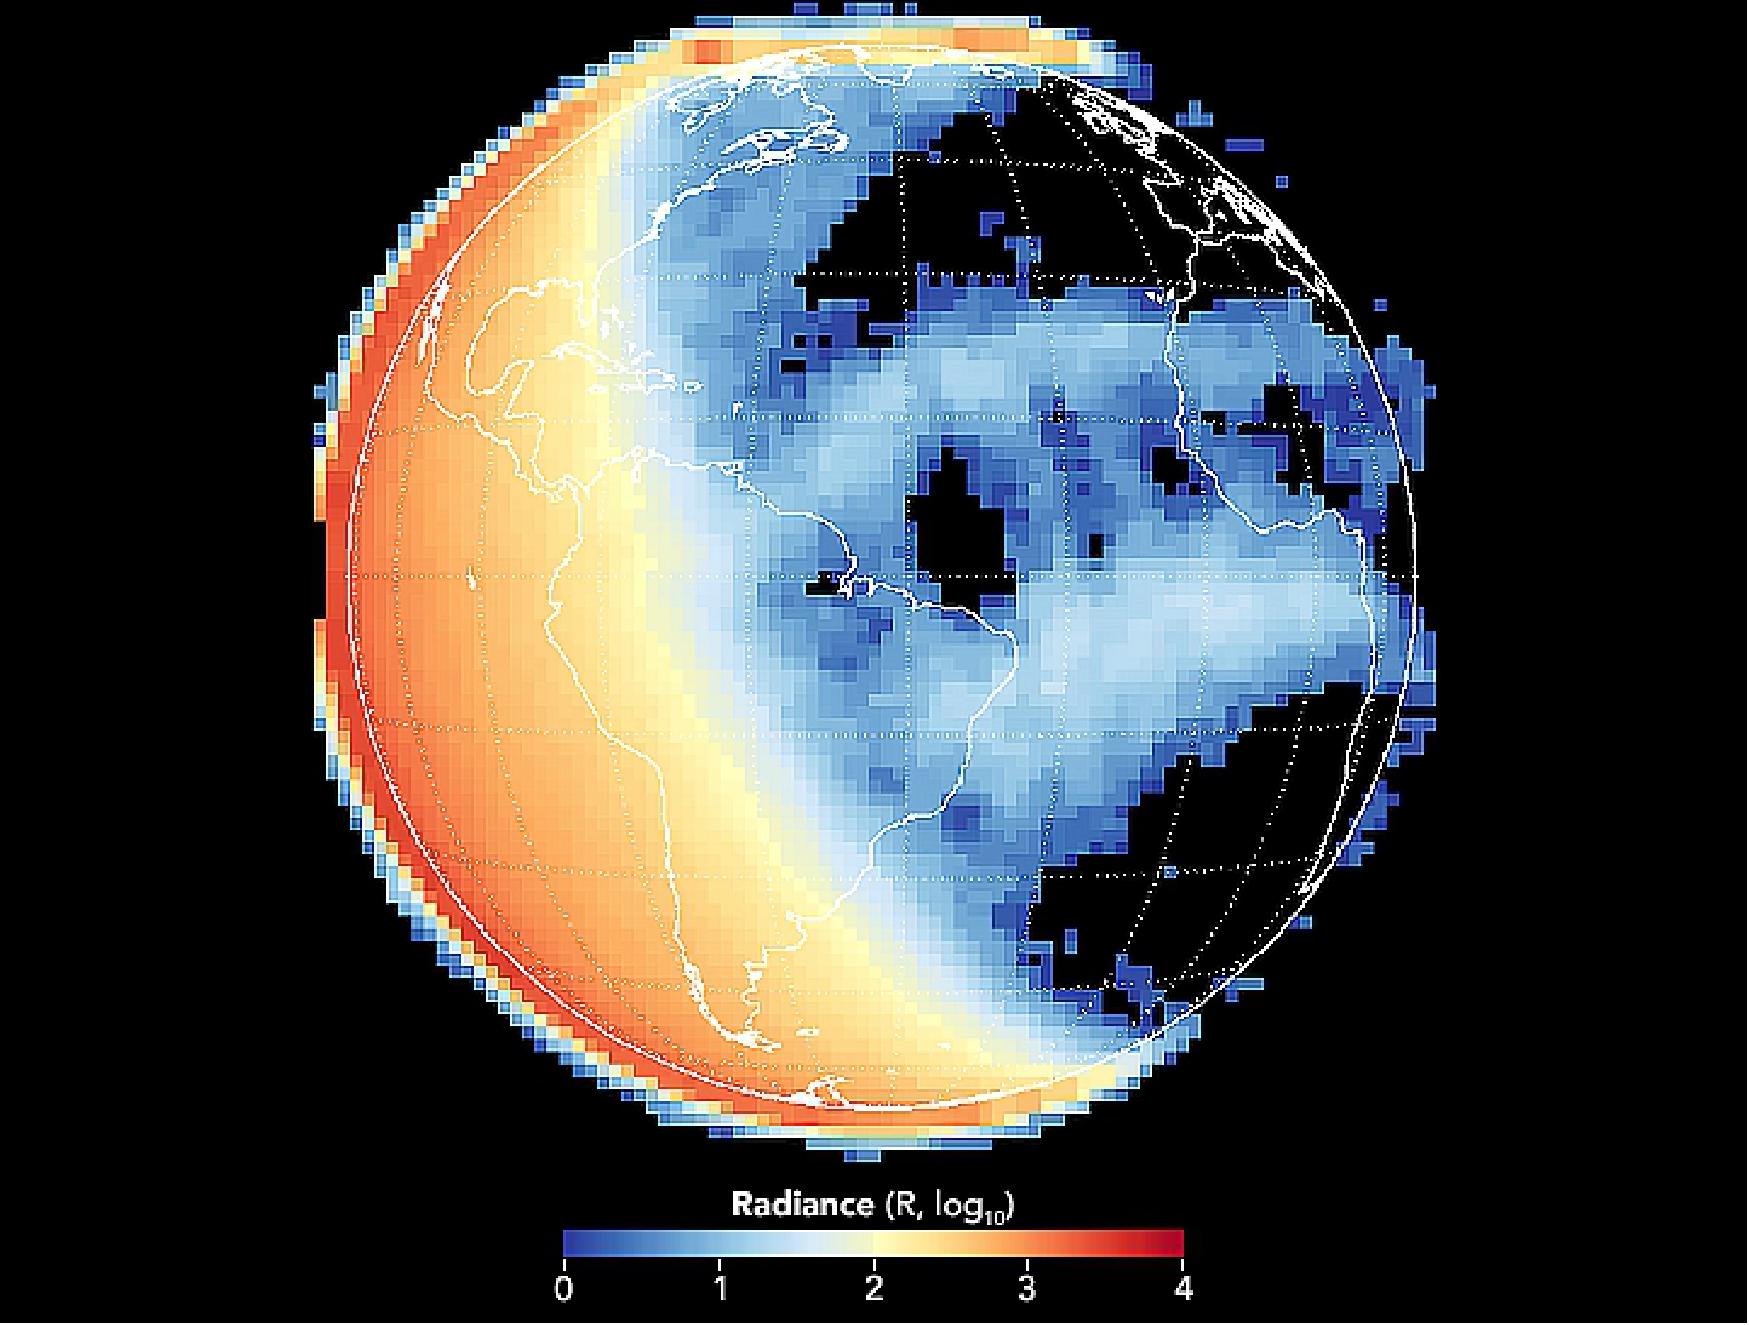
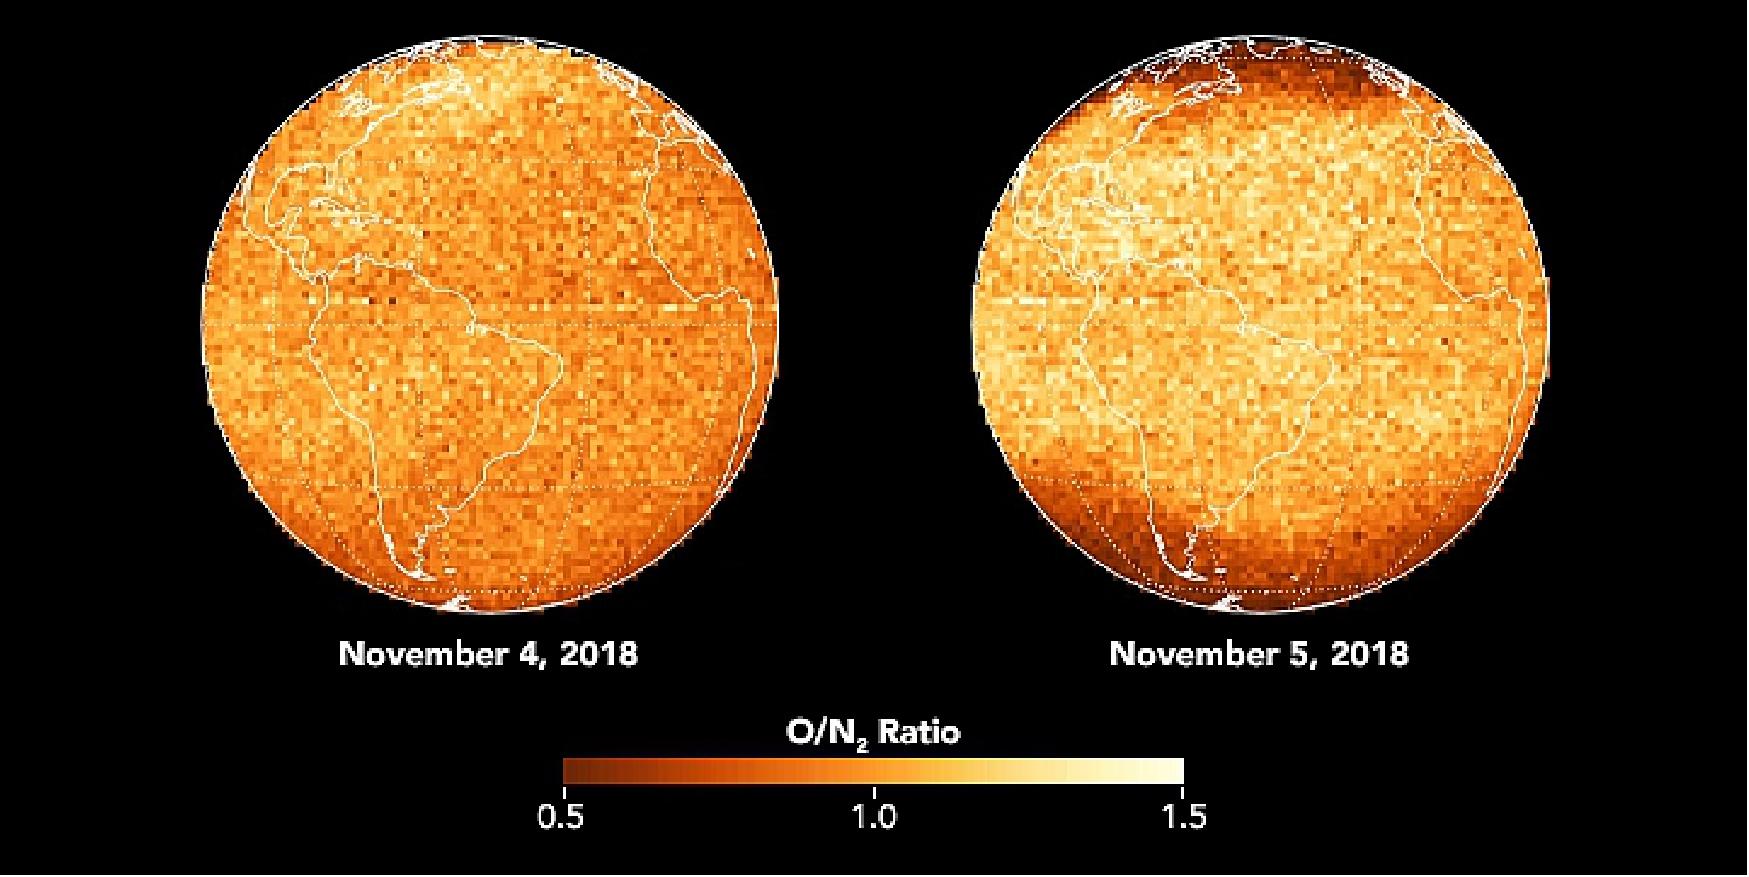
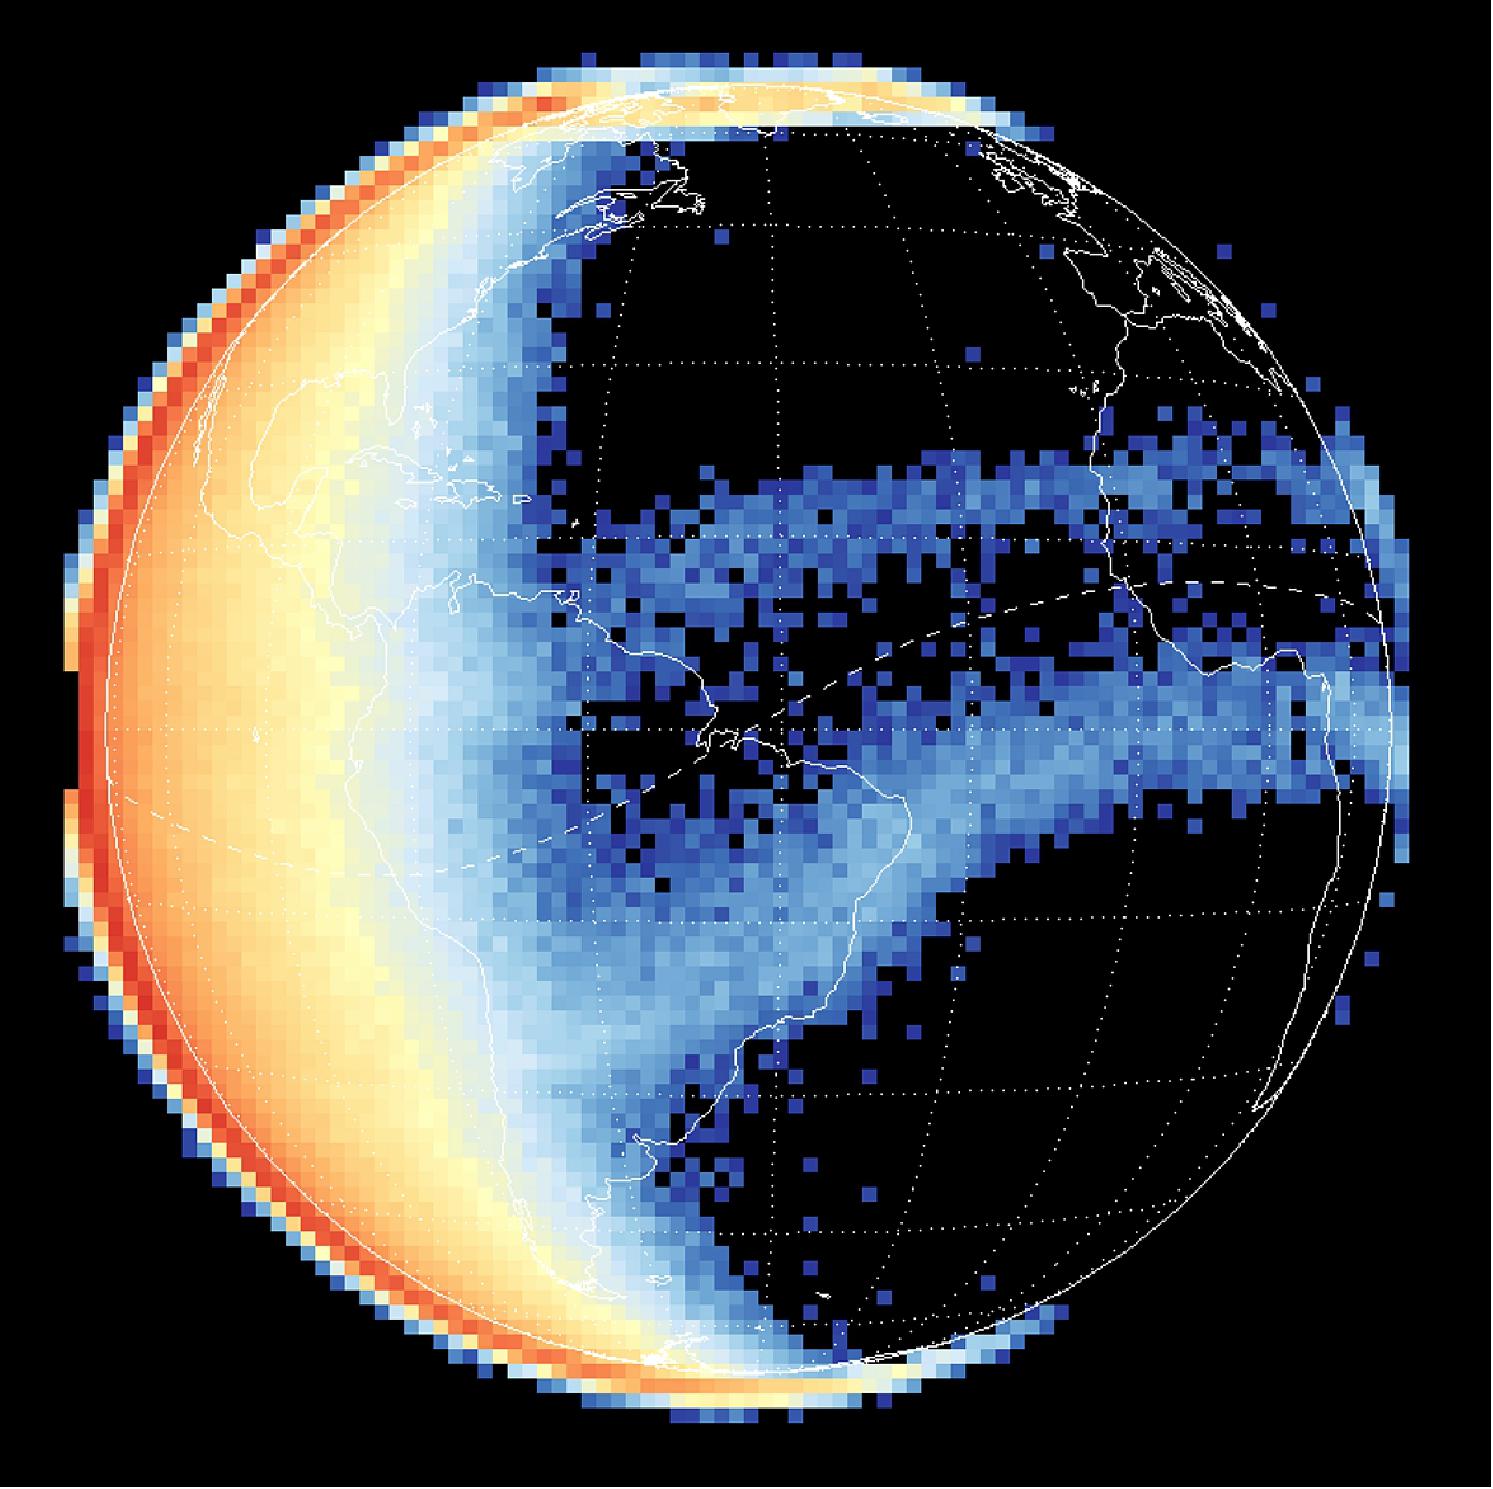
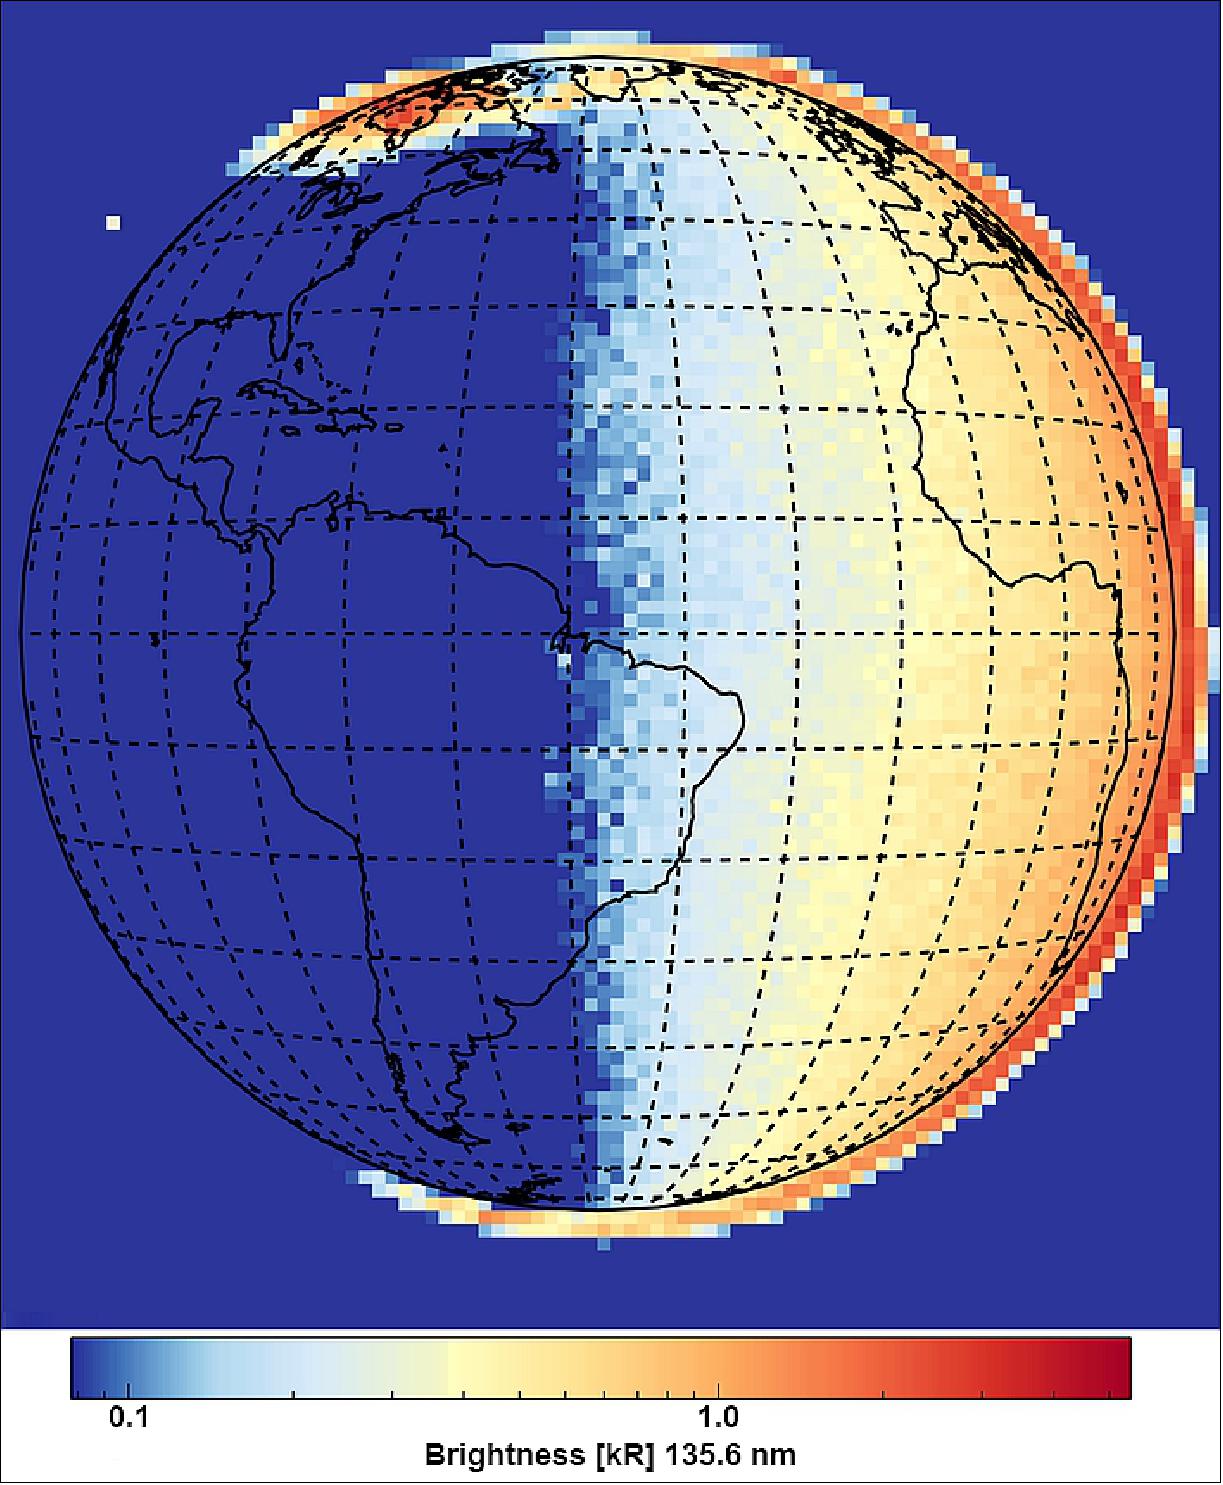
• September 4, 2020: A total solar eclipse occurred in the Southern Hemisphere on 2 July 2019 from approximately 17 to 22 UT. Its effect in the thermosphere over South America was imaged from geostationary orbit by NASA's Global‐scale Observation of Limb and Disk (GOLD) instrument. GOLD observed a large brightness reduction (>80% around totality) in OI 135.6 nm and N2 LBH (Lyman‐Bridge‐Hopfield) band emissions compared to baseline measurements made 2 days prior. In addition, a significant enhancement (with respect to the baseline) in the ΣO/N2 column density ratio (~80%) was observed within the eclipse's totality. This enhancement suggests that the eclipse induced compositional changes in the thermosphere. After the eclipse passed, a slight enhancement in ΣO/N2 column density ratio (~7%) was also seen around the totality path when compared to measurements before the eclipse. These observations are the first synoptic imaging measurements of an eclipse's thermospheric effects with the potential to drastically improve and test our understanding of how the thermosphere responds to rapid, localized changes in solar short wavelength radiation. 25)
GOLD Observations of the 2019 Solar Eclipse
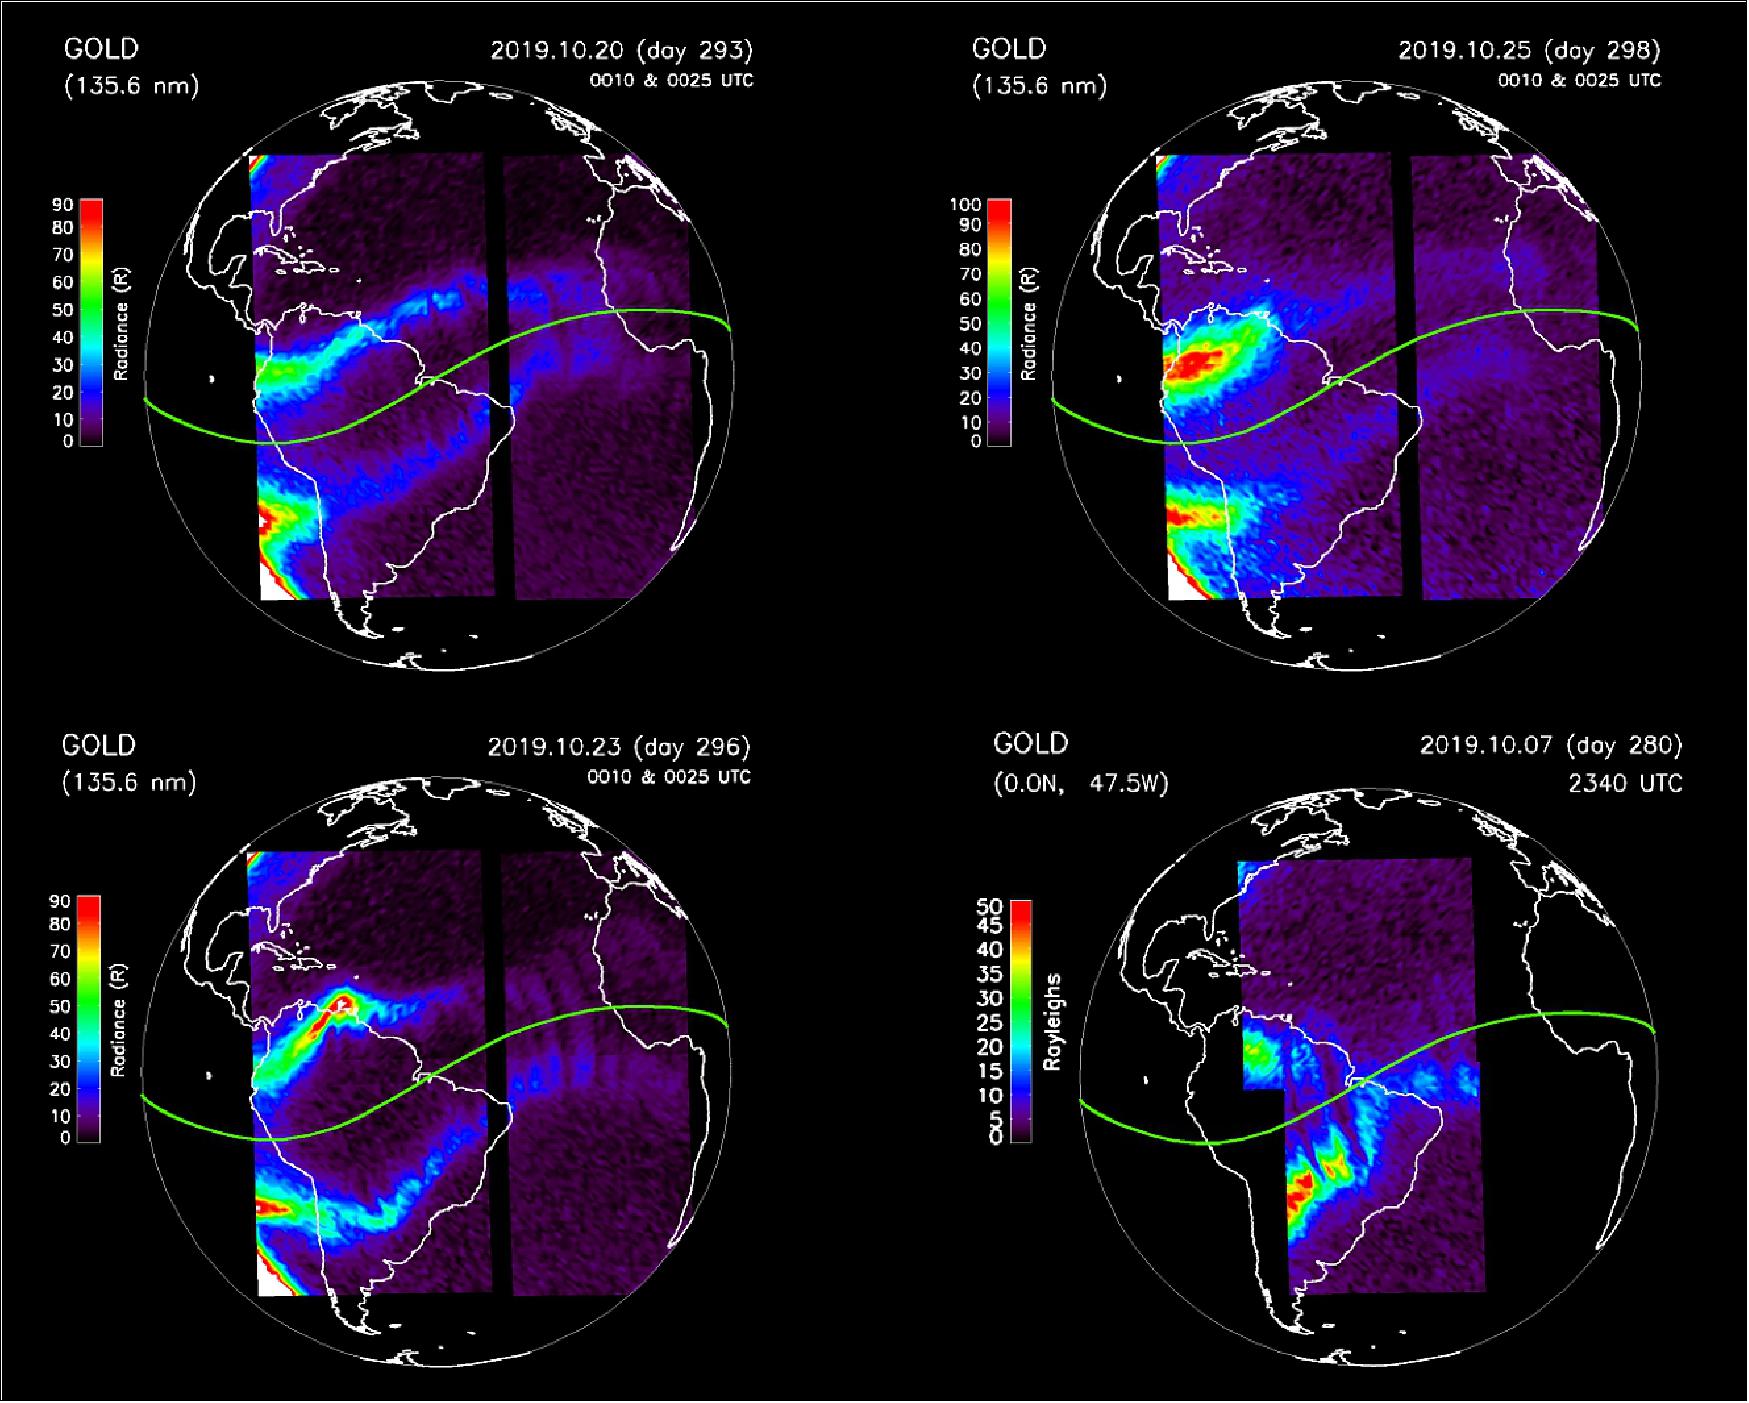
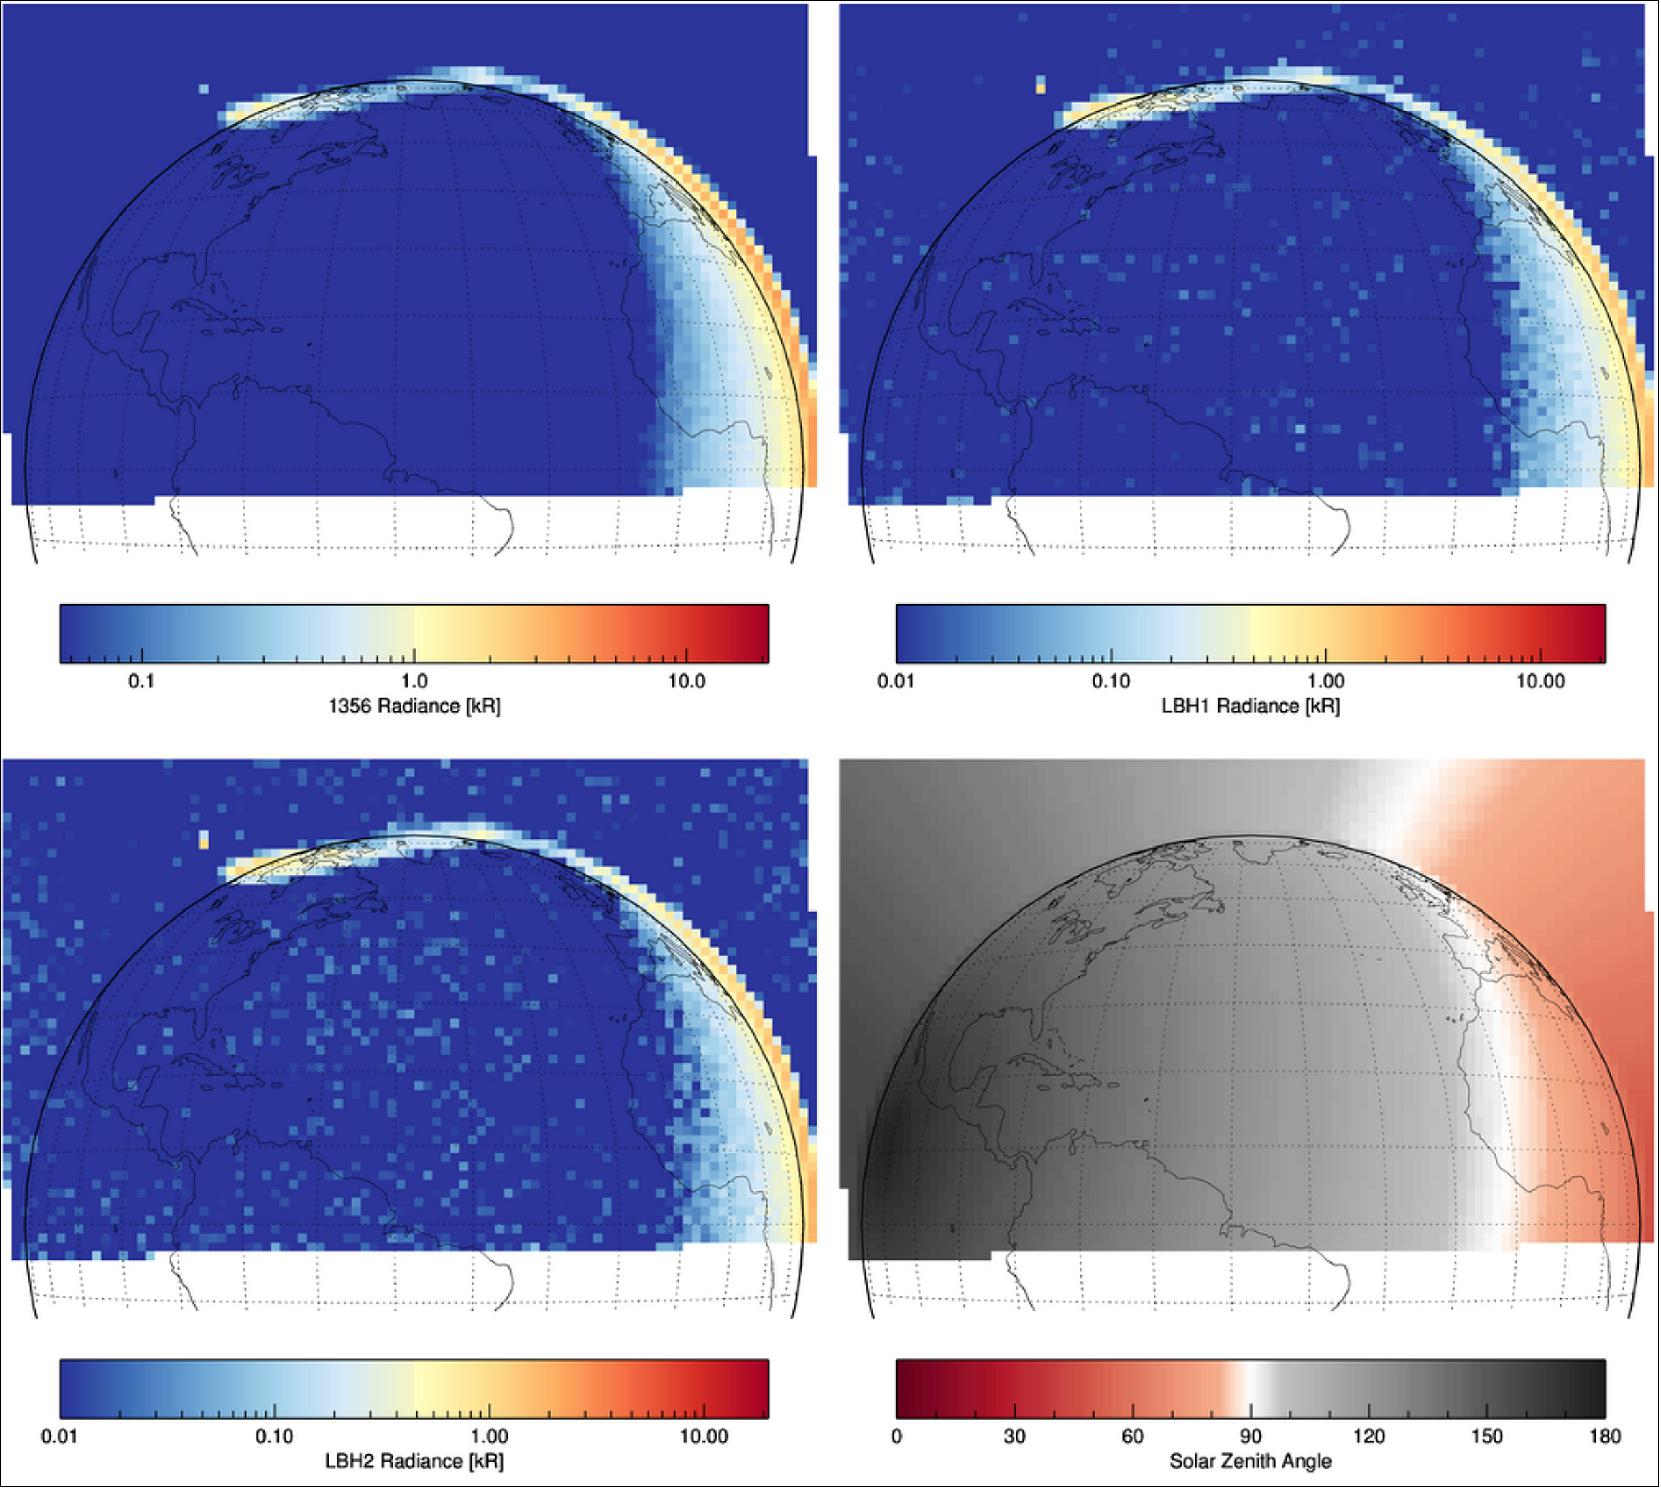
- GOLD is a FUV imaging spectrometer (~133–165 nm) with three interchangeable entrance slits that can be selected to achieve different resolutions (0.21, 0.35, or 2.16 nm). GOLD also has two identical channels, each with its own mirror that can independently scan the Earth from a geostationary orbit above 47.5°W longitude. These mirrors are used to reflect light into one of the three entrance slits where the light gets dispersed. The spectral and spatial information of the dispersed light is then recorded and reduced.
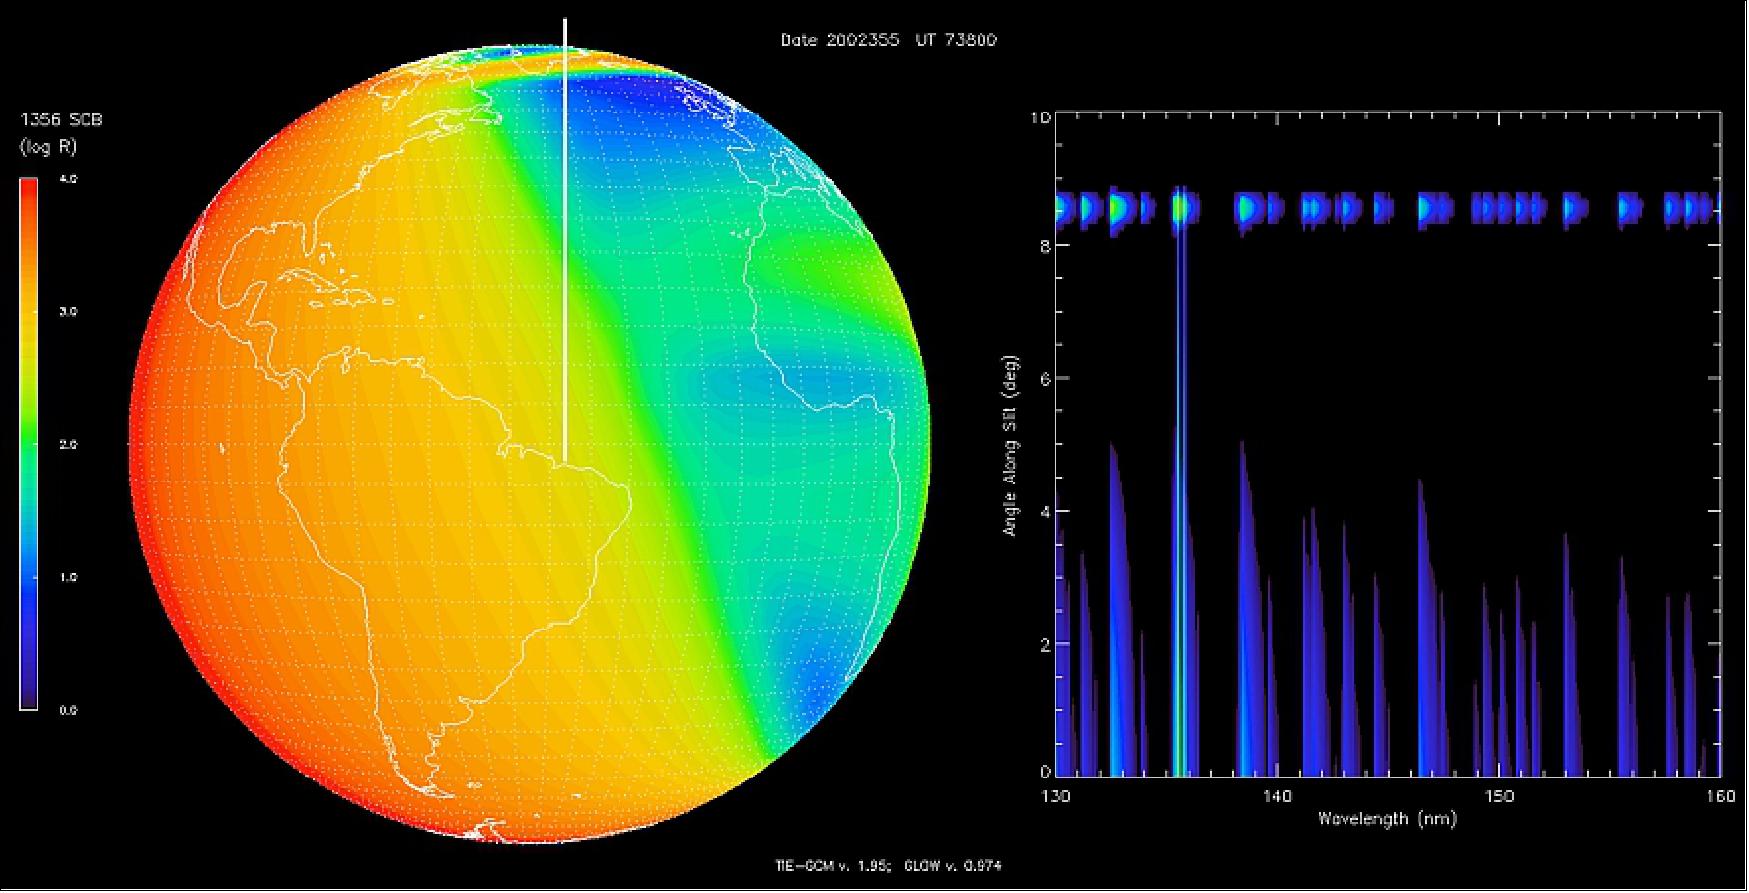
- GOLD makes daytime disk, limb, occultation, and nighttime disk measurements at different cadences. For this study, we used day disk imaging of the OI 135.6 nm and N2 LBH band emission brightnesses. The full disk day images were generated by scanning east to west starting from the northeastern limb and ending at the southwestern limb. Northern and Southern Hemisphere scans were made separately (~15 min cadence each) at a spectral dispersion of 0.04 nm/pixel. Data counts were then converted to radiance in Rayleighs (R) per nanometer. Integrating the radiance over the desired wavelength range gives the brightness in R (1R = 1010 photons m-2 s-1 steradian-1). Figure 17 shows an example of typical daytime 135.6 nm and LBH brightness imaging. Integration from 134 to 137 nm for the 135.6 nm emission and from 140 to 160 nm (excluding the N I 149.1 nm feature) for the LBH band emission was used to calculate the brightnesses. The scans in the Northern Hemisphere were made starting at 22:10 UT, while the southern scan started at 22:22 UT on 30 June 2019 (total cadence ~30 min).
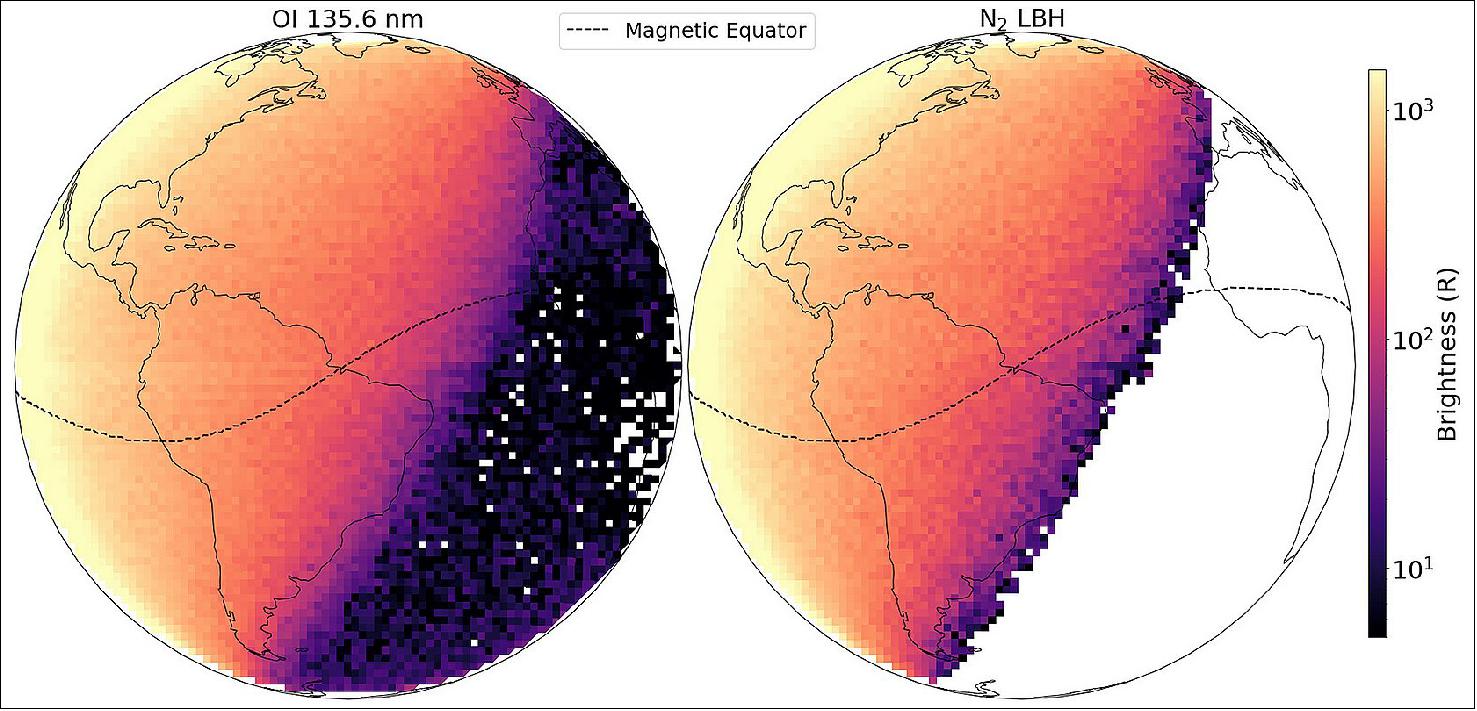
- The 2 July 2019 total solar eclipse started around 17 UT close to 36°S, 157°W and ended about 22 UT near 37°S, 57°W. Its greatest duration and extent occurred at ~19 UT, with a maximum totality of ~5 min (https://eclipse.gsfc.nasa.gov/). At a given time, the totality covered an area of ~1–2° latitude by 1–2° longitude. As the Moon's shadow moved toward the South American west coast from the west, it came within GOLD's field of view (FOV). Figure 18 shows GOLD's imaging of the eclipse in terms of 135.6 nm and the LBH brightnesses at 20:10 UT (scan start) on 2 July 2019. A reduction in both 135.6 nm and LBH brightnesses are seen near the totality. The observed reductions are a direct result of attenuated solar ultraviolet and X‐ray radiation within the eclipsed region. High‐energy solar radiation ionizes the upper atmosphere of the Earth creating energetic photoelectrons. The main production mechanism for 135.6 nm and the sole production mechanism for LBH are photoelectron impact on O and N2, respectively. Thus, a reduction in the photoelectron flux within the eclipse's shadow leads to a reduction in the observed brightnesses of 135.6 nm and LBH emission. GOLD's observation shows that the brightness reduction in both 135.6 nm and LBH is immediate, suggesting rapid reduction in photoelectron flux due to eclipse's shadow. In addition to photoelectron impact, the 135.6 nm emission has an ~10% contribution from radiative recombination (RR) of O+. This is most likely the reason that the observed brightness reduction in LBH emission, which is produced entirely by photoelectron impact, is greater than the reduction in 135.6 nm emission.
• December 26, 2019: High above the Earth, there is a dynamic region where the atmosphere meets space. Home to astronauts on the space station and to many Earth-observing and commercial satellites, the ionosphere constantly fluctuates and responds to changes from above and below. A NASA-funded instrument is shedding new light on the invisible processes and rhythms at play in this intersection between Earth and space. 26)
- Between 80 and 600 km above the ground, radiation from the Sun cooks some of the gases in our upper atmosphere until they lose an electron or two. The result is a sea of electrically charged particles—ions—intermingled with the neutral upper atmosphere. Energy is constantly streaming in from the Sun and from near-Earth space, an expression of what scientists call space weather. But the ionosphere also responds to weather patterns that ripple up from the lower parts of Earth’s atmosphere. Such changes can make it challenging to work in space, and they regularly affect key communications systems such as high-frequency (HF) radio and GPS.
- According to atmospheric scientist Richard Eastes of the University of Colorado, the region is far more variable than scientists expected. That insight comes from work with the Global-scale Observations of the Limb and Disk (GOLD) instrument, which images the ionosphere in ultraviolet light to track changes in temperature, density, and composition.
- Eastes noted that on one night, the crests may be evenly spaced over the equator; the next night, they can be far apart and in an entirely different position. The paths that radio waves take—such as those used by GPS—depend on the density of the ionosphere. Sometimes changes in the density and location of these hot spots can interfere with communications signals.
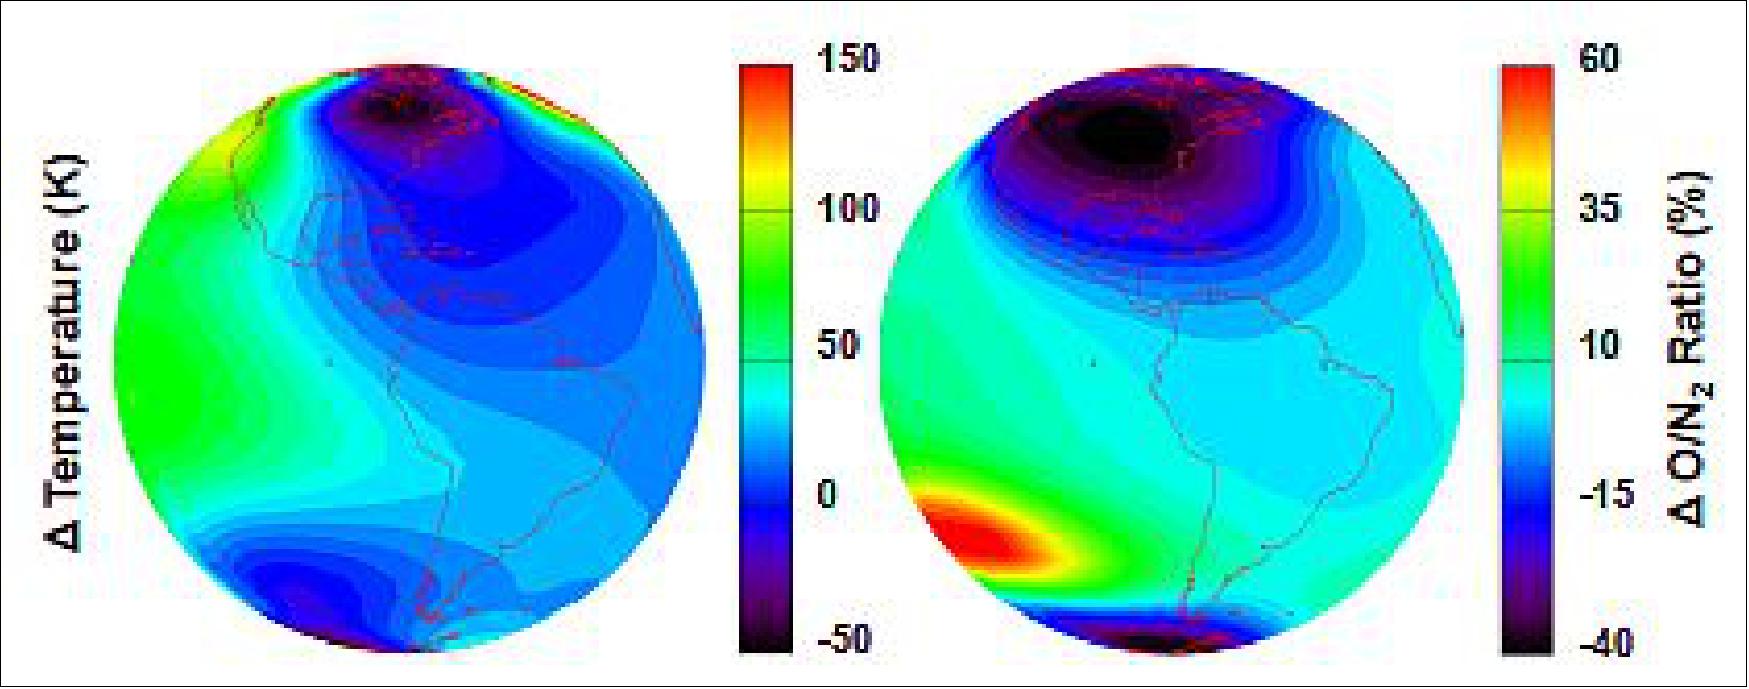
- During such storms, the neutral atmosphere near the magnetic poles is heated by energy coming from the magnetosphere, and the density ratio decreases rapidly and dramatically. At lower latitudes, the opposite happens, as large amounts of atomic oxygen move from high to low latitudes. Since the neutral atmosphere and ionosphere are coupled, composition changes alter the ionosphere density and the behavior of radio communications signals.
- Though some features like the Appleton anomaly are not new to scientists, the GOLD research team was surprised by how much the ionosphere varies from night to night. “These were very surprising findings to me, and to the rest of the team that has been looking at this stuff for many years,” said Eastes, the principal investigator for GOLD. “It was not something we anticipated.”
• December 10, 2019: In a Dec. 10 press event at the fall meeting of the American Geophysical Union in San Francisco, three scientists presented new images of the ionosphere, the dynamic region where Earth’s atmosphere meets space. Home to astronauts and everyday technology like radio and GPS, the ionosphere constantly responds to changes from space above and Earth below. 27)
- The collection of images presented include the first images from NASA’s ICON, new science results from NASA’s GOLD, and observations of a fleeting, never-before-studied aurora. Together, they bring color to invisible processes that have widespread implications for the part of space that is closest to home.
- Earth’s ionosphere stretches from 50 to 400 miles above the ground and overlaps the top of the atmosphere and the very beginning of space. Radiation from the Sun cooks a small portion of gases in the upper atmosphere until they lose an electron or two. The result: a sea of electrically charged particles intermingled with the neutral upper atmosphere.
- Besides energy streaming in from the Sun and near-Earth space, the ionosphere also responds to weather patterns that ripple up from the lower atmosphere below. These changes — which can impact astronauts and key communications systems — are complex and unpredictable. A range of specialized instruments is key to studying and understanding them.
New GOLD Results
- While all-sky cameras provide views of the ionosphere from the ground, GOLD surveys the region from geostationary orbit, 22,000 miles above Earth. GOLD Principal Investigator Richard Eastes, from the University of Colorado, Boulder, presented new results from the mission: observations that show the region is far more variable than scientists ever expected.
- GOLD (Global-scale Observations of the Limb and Disk) is an instrument that images the ionosphere in far ultraviolet light. This particular wavelength of light is invisible to our eyes, but useful for tracking changes in the ionosphere’s temperature, density and composition.
- Since GOLD can see the entire Western Hemisphere at once, it can observe ionospheric changes and patterns across the globe. In the past year, GOLD has helped scientists pin down how the ionosphere responds to geomagnetic storms: Atomic oxygen increases at low latitudes and decreases at high latitudes, while molecular nitrogen does the opposite.
- GOLD’s unique vantage point also enabled observations of the July 2 total solar eclipse in South America. In typical day-night cycles, the pool of electrically charged atmospheric gases waxes and wanes with the Sun. During the day, the ionosphere is dense. At night, when the Sun is no longer energizing the atmosphere, the atmosphere cools. Charged particles gradually recombine. The ionosphere thins. In a total eclipse, the same thing happens over a much shorter amount of time. As the July 2 eclipse crossed over the bottom of South America, scientists were, for the first time, able to watch this thinning evolve across the Southern Hemisphere, from space.
- The GOLD scientists were also surprised by how much the nighttime ionosphere varies night to night. The paths that radio frequency waves take, such as those used by GPS, depend on the density of the ionosphere. Sometimes, changes in the density can interfere with these signals.
- At night, charged particles tend to settle in crests beside Earth’s magnetic equator. Eastes likened the images to a T-rex’s toothy grin. On one night, the crests are evenly spaced over the equator, as if the T-rex is baring its teeth. The next night, the crests are far apart like the T-rex’s mouth is open wide, and the night after that, in a different position entirely. Why the nighttime ionosphere varies so much is still unclear.
- “These were very surprising findings to me, and to the rest of the team who’s been looking at this stuff for many years,” Eastes said. “It’s not something we anticipated at all.”
• December 7, 2019: Additional Level 1 data from NASA’s Global-scale Observations of the Limb and Disk (GOLD) mission are now available via the GOLD website at https://gold.cs.ucf.edu
- Channel A L1C and L1D data are now available through 11/30/2019. Data will continue to be released on a regular basis going forward. The dates currently available for each data product can be found on the Current Data Product Versions page at https://gold.cs.ucf.edu/data/current-data-product-versions/
- Channel B L1C and L1D night time (NI1) data are also now available through 11/30/2019. The CHB NI1 data from the period 12/15/18-3/15/19 are available by special request only through a link on the GOLD download page at https://gold.cs.ucf.edu/data/search/. See section 3.1.5 of the GOLD data release notes for details on the issues with the CHB NI1 data during that time period.
- Updated release notes for GOLD data is available at https://gold.cs.ucf.edu/documentation/
- Information about data rights and rules for data use can be found at https://gold.cs.ucf.edu/gold-data-usage/
• August 13, 2019: NASA's GOLD (Global-scale Observations of the Limb and Disk) mission has observed dramatic and unexplained shifts in the location of features in the Earth’s ionosphere surrounding the equator. Unanticipated changes in the nighttime ionosphere can lead to disruptions in communication and navigation that depend on satellites, such as GPS. 28)
- GOLD is an ultraviolet imaging spectrograph that was designed and built at the University of Colorado Boulder’s Laboratory for Atmospheric and Space Physics (LASP) and is hosted on the SES-14 communications satellite. The latest discoveries from the mission are challenging mission scientists and were published last week in Geophysical Research Letters.
- Since reaching orbit in October 2018, GOLD has been making observations of the Equatorial Ionization Anomaly (EIA), regions of the ionosphere with enhanced electron density north and south of the magnetic equator. One of the primary goals of the mission is to better understand the behavior of the EIA and the instabilities within it. GOLD presents a new ability to image the variability of ionospheric plasma and, ultimately, to understand its causes.
- “The variability of the nighttime ionosphere has been a puzzle that scientists have studied for more decades than most of us have lived,” said Richard Eastes, GOLD principal investigator and LASP research scientist. “Today it’s an important problem to solve because better forecasts are needed for reliable navigation and communication by airplanes and others.”
- Density variations in the ionosphere can cause localized plasma depletions called “bubbles.” Radio waves, including those used for communications and navigation, can be disrupted when they encounter these bubbles. The occurrence of bubbles and other ionospheric irregularities presents a critical challenge for efforts to predict how changes in solar and geomagnetic activity affect the nighttime ionosphere.
- Because of GOLD’s unique perspective from geostationary orbit and its rapid imaging cadence (a complete scan of each hemisphere every 15 minutes), GOLD is providing new information that has not been available in previous EIA observations. From its geostationary vantage some 22,000 miles (35,786 km) above the Earth, GOLD observes the same longitudes repeatedly every night and provides large scale images of the EIA.
- GOLD has observed gaps occurring on a majority of the nights and has more irregularly detected abrupt changes in the location of the EIA. The team will rely on additional measurements before attempting to determine the cause of variability in the EIA and its changing location.
- GOLD is a NASA mission of opportunity managed by the Goddard Space Flight Center in Greenbelt, MD. The GOLD principal investigator is based at LASP, which built the instrument, provides project management and systems engineering, as well as instrument operations for the GOLD mission. GOLD is a hosted payload on a commercial communications satellite, SES-14, built by Airbus for Luxembourg-based satellite operator, SES.
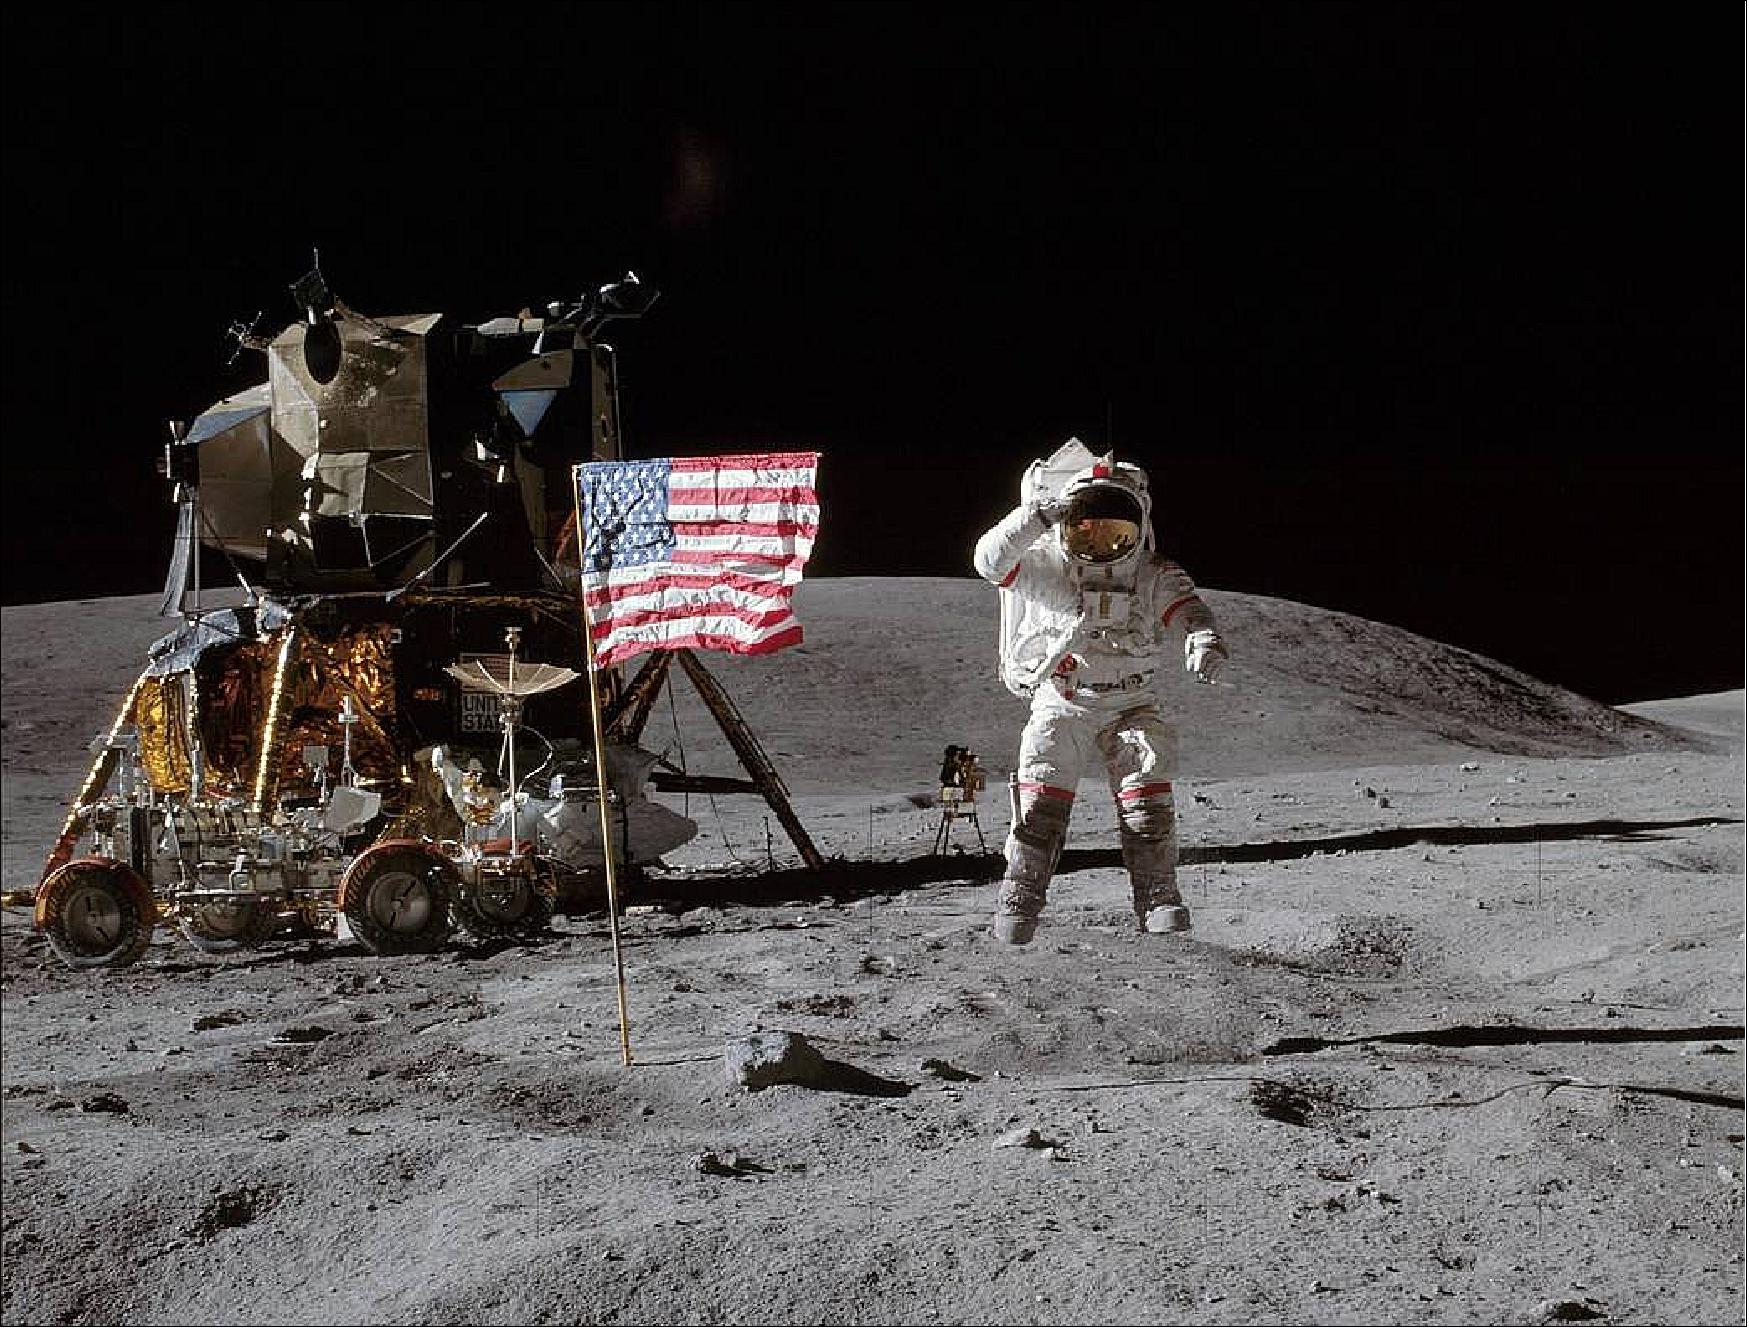
• July 17, 2019: In 1972, Apollo 16 astronauts John Young and Charles Duke stood on the Moon and looked back at Earth (Figure 26). From the lunar surface, they took a picture of Earth like none before: the first view of our planet in far ultraviolet light (Figure 24). 29)
- This picture highlights Earth’s ionosphere, a region of the upper atmosphere that is mostly invisible to our eyes — aside from aurora or airglow, if you’re in the right place at the right time — but shines in ultraviolet, or UV, wavelengths of light. Named for the electrically charged ions that move about freely there, the ionosphere absorbs UV light from the Sun and re-emits it to space. The effect can be seen in this UV image. The Sun-facing side of Earth is bright. The rest of the planet, which is not receiving UV light from the Sun, remains dark, shrouded in night.
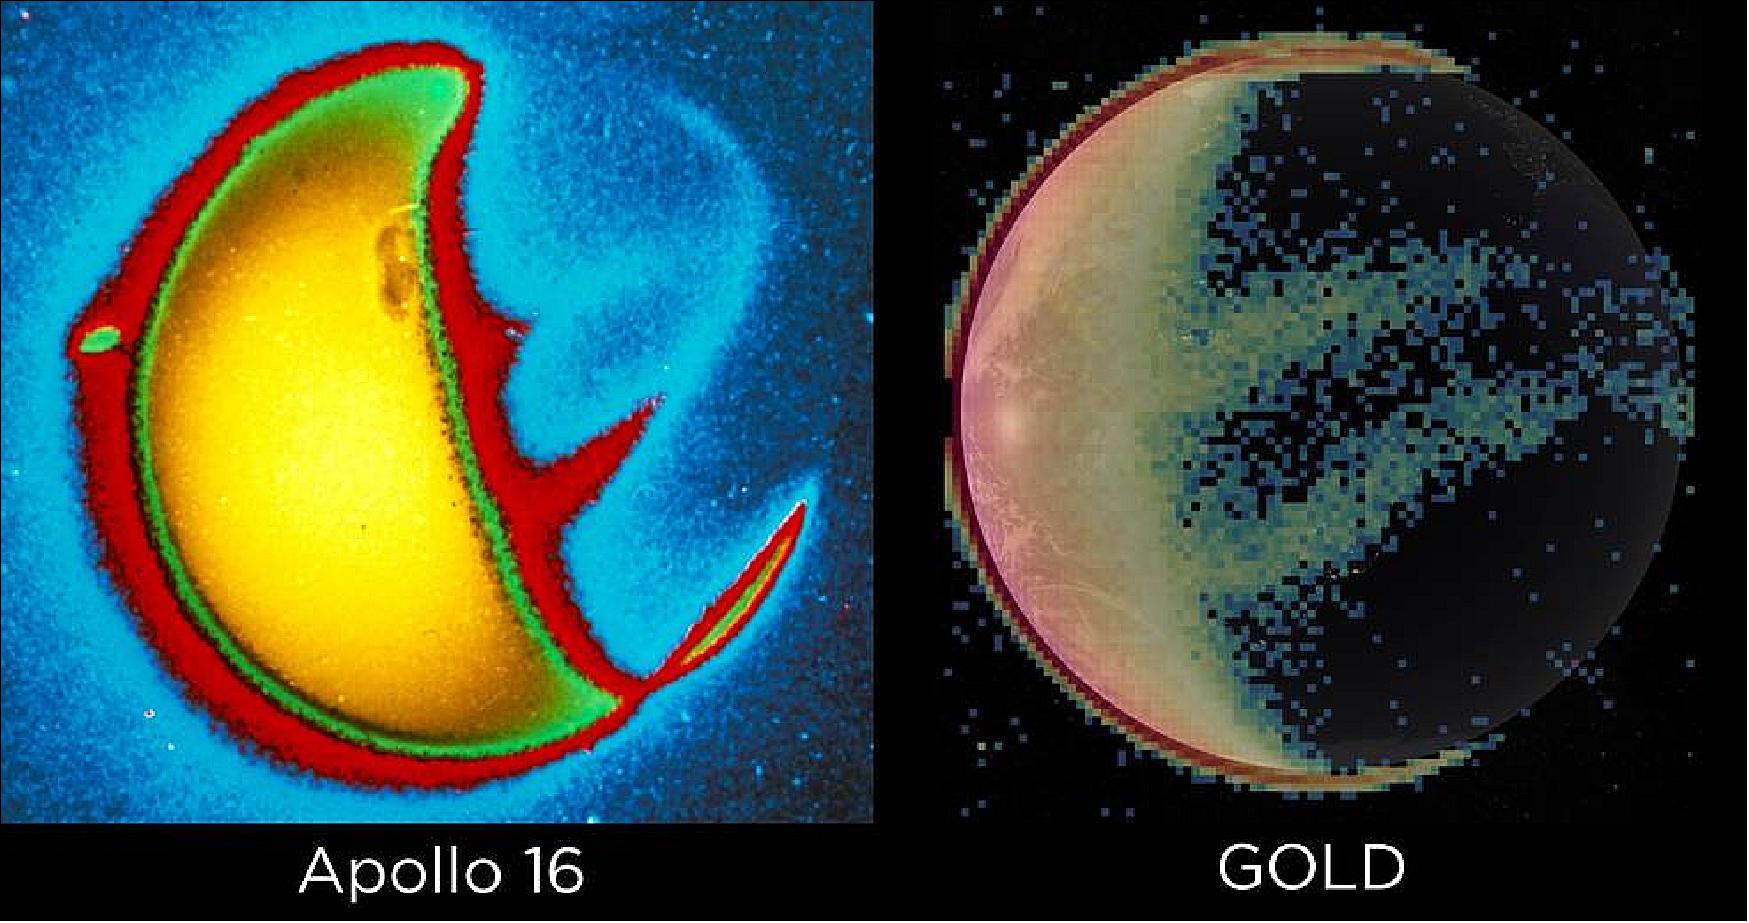
- Attentive observers may notice three strips of UV emission that extend onto Earth’s night side. The two strips just above and below the equator are known as the Appleton Anomaly. They mark where Earth’s magnetic field interacts with the upper ionosphere to trigger dense fountains of uprising plasma. The southernmost strip is UV light from the aurora australis, or the Southern Lights.
- Launched in 2018, NASA’s GOLD mission is now one of our key tools for ionosphere observations, providing the first day-to-day weather measurements of the region. By measuring far UV light, GOLD tracks changes in the ionosphere’s ever-changing temperature, density and composition — enabling scientists to piece together the forces that shape conditions in a part of the atmosphere critical to many Earth-orbiting satellites and everyday technology, including the successful transmission of radio signals and GPS.
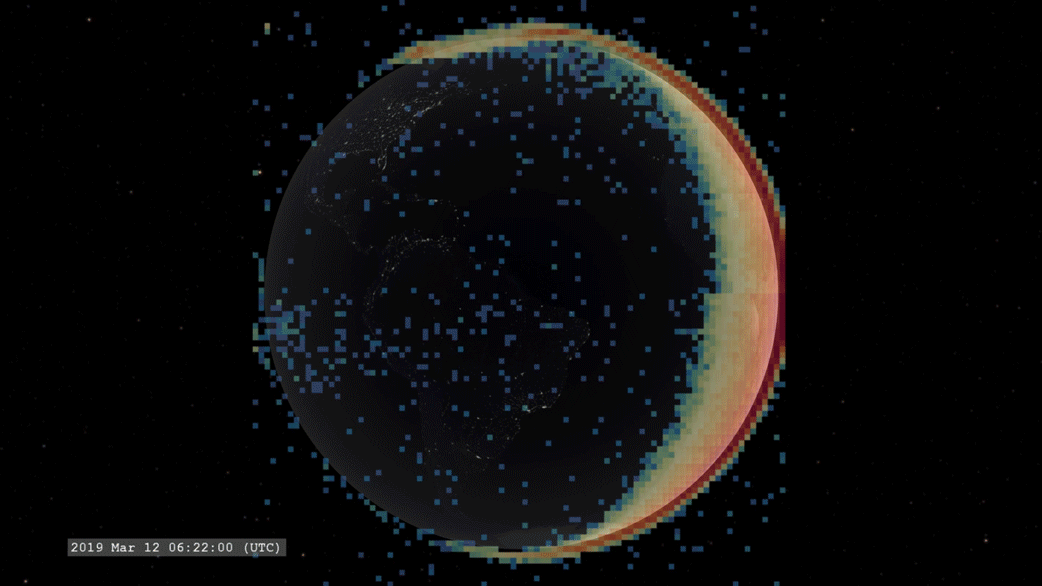
- This visualization of GOLD data from March 2019 shows the transition from day to night, as well as the Appleton anomaly, which appears as two horizontal arcs of light that extend into night. The aurora can be seen at the top and bottom of Earth, also extending into night.
• June 3, 2019: The first release of Level 2 data from NASA’s Global-scale Observations of the Limb and Disk (GOLD) mission is now available via the GOLD website at http://gold.cs.ucf.edu. Information about these L2 data products is available in the updated data documentation that can be accessed at http://gold.cs.ucf.edu/documentation/
• March 12, 2019: Data from GOLD are now available from the GOLD Science Data Center (SDC). The L1C (spatial-spectral image cubes), L1D (“Quicklook” – thumbnail images and plots) data and relevant information about these data can be accessed under “DATA” near the top of the page. 30)
• September 17, 2018: NASA's GOLD ( Global-scale Observations of the Limb and Disk) instrument powered on and opened its cover to scan the Earth for the first time, resulting in a “first light” image of the Western Hemisphere in the ultraviolet. 31) 32)
- The instrument was launched from Kourou, French Guiana, on 25 January 2018, onboard the SES-14 satellite and reached geostationary orbit in June 2018. After checkout of the satellite and communications payload, GOLD commissioning—the period during which the instrument performance is assessed—began on 4 September.
- Team scientists conducted one day of observations on 11 September, during instrument checkout, enabling them to produce GOLD’s “first light” image shown here. Commissioning will run through early October, as the team continues to prepare the instrument for its planned two-year science mission.
- “GOLD is an amazing technological breakthrough,” said GOLD Principal Investigator Richard Eastes, a research scientist at LASP. “After years of reviews, testing, testing, and more testing, the instrument is finally making observations of the Earth. The main act has begun. It’s a testament to the engineering and science teams, who were responsible for building and calibrating the instrument, that we’ve reached this significant mission milestone.”
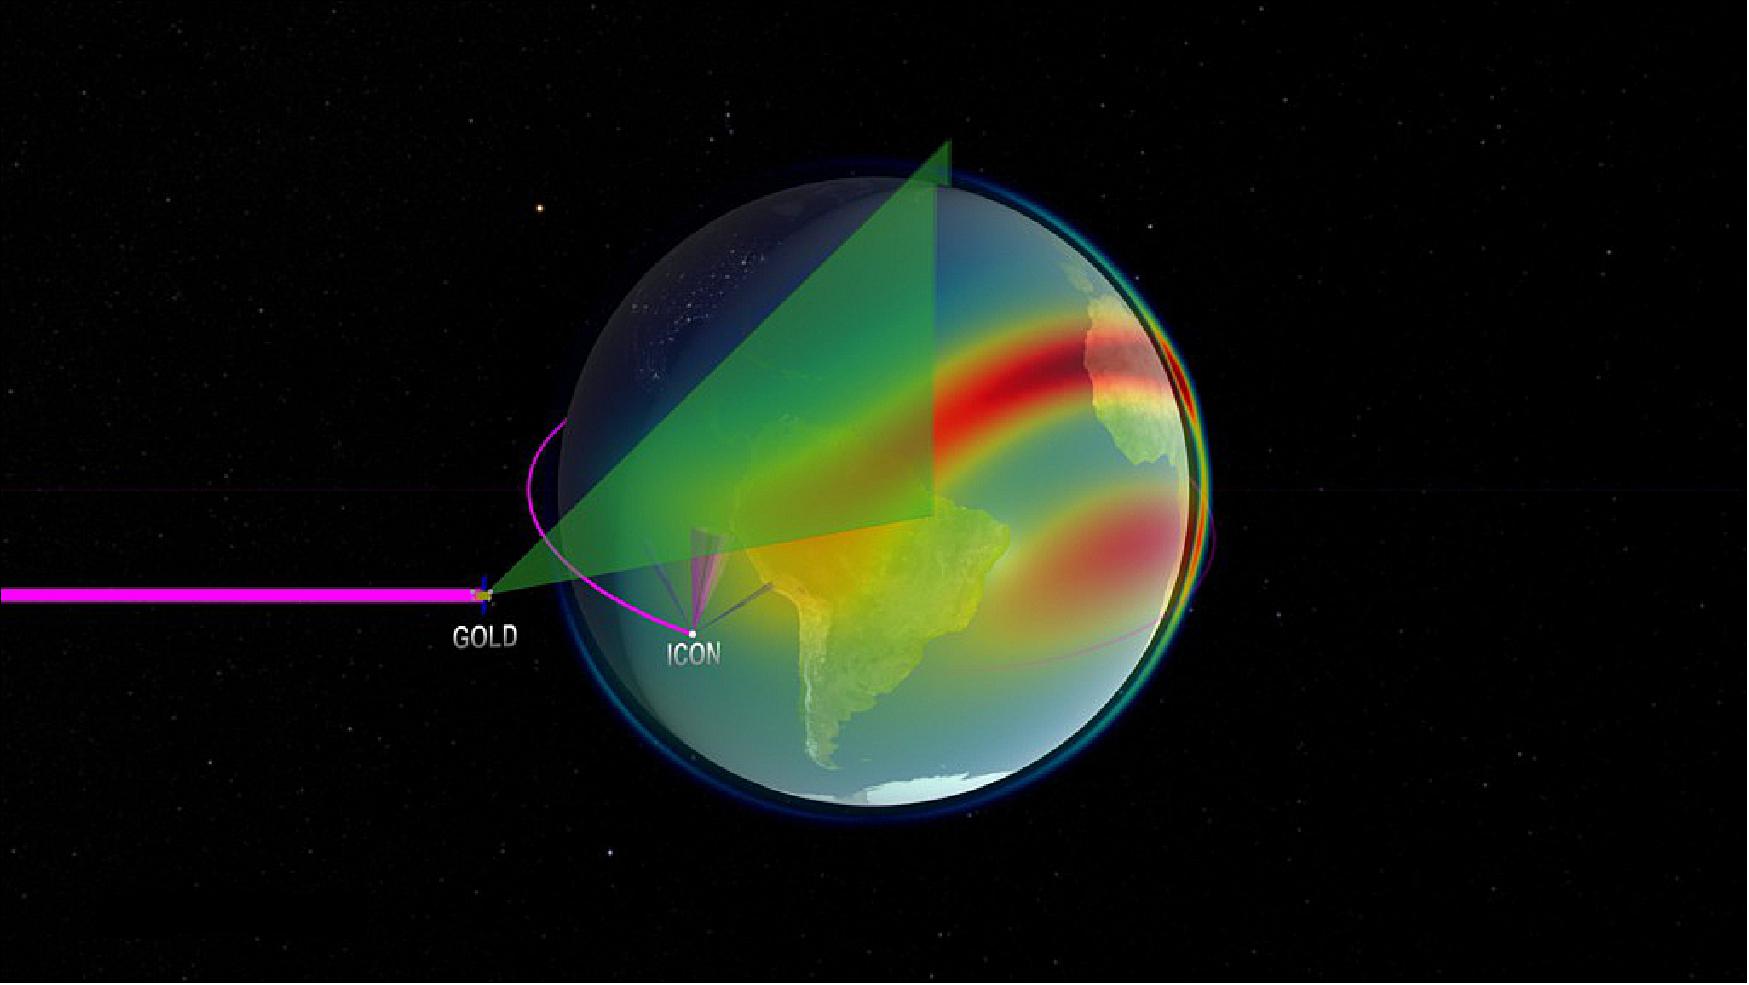
- Along with NASA’s ICON (Ionospheric Connection Explorer), scheduled for launch later this fall, GOLD is a key element of NASA’s program to explore Earth’s boundary with space, as the two missions explore this unpredictable near-Earth region to determine how it responds to solar and atmospheric inputs.
- “The successful launch of GOLD and acquisition of initial data is a fantastic result,” said Bill McClintock, GOLD instrument scientist at LASP. “Its data will help us understand the critical role the Sun plays in space weather and allow us to better protect astronauts and our technological assets that we’ve become so reliant upon in today’s society.”
- Changes in near-Earth space can affect our lives on Earth by disrupting the use of satellites for communications and navigation. The result can be lost messages, aircraft flight delays, interruptions in GPS signals, and satellite TV outages. Incoming solar energy can also damage spacecraft electronics and detectors, and expose astronauts to health risks from radiation. The more we understand about the fundamental nature of our space environment, the better we can protect these interests.
- Scientists expect to begin operations of the GOLD instrument in early October 2018.
• September 4, 2018: The high-powered SES-14 satellite, positioned at 47.5 degrees West, is now operational and is serving Latin America, the Caribbean, North America, North Atlantic and West Africa. 33)
- The commercial communications satellite also carries a hosted payload for NASA’s GOLD (Global-scale Observations of the Limb and Disk) mission. GOLD will provide unprecedented imaging of the Earth’s upper atmosphere from geostationary orbit to deepen scientists' understanding of the boundary between Earth and space.
• February 23, 2018: The Independent Enquiry Commission formed after the Ariane 5 launcher’s trajectory deviation during its January 25, 2018 mission issued its conclusions on Thursday, February 22. The anomaly’s cause is perfectly understood and recommendations are clearly identified. Arianespace and ArianeGroup are immediately implementing the Independent Enquiry Commission’s recommended corrective measures. The current Soyuz and Ariane 5 launch campaigns are continuing at the Guiana Space Center in French Guiana for the two launches planned in March. 34)
During the Ariane 5 VA241 mission, carried out on January 25, 2018 from the Guiana Space Center in French Guiana (South America), telemetry from the launcher was lost 9 minutes and 26 seconds into the flight because of a deviation in the trajectory. Signals from the two satellites were acquired after the nominal mission duration, and the spacecraft were confirmed to be in good health, but in an orbit at an inclination of 20 degrees, rather than the targeted 3 degrees. The apogee and perigee attitudes, however, were very close to the targeted values (249 x 45,234 km.). The analysis of data received during the first minutes of the flight, and the reconstitution of the trajectory, confirmed that the launcher and the flight program operated perfectly. The two satellites are now in the process of reaching their final orbital positions, using their own propulsion systems.
Following the launch anomaly, Arianespace asked ESA (European Space Agency) on January 26 to set up an Independent Enquiry Commission. Chaired by Toni Tolker-Nielsen, ESA Inspector General, this Commission submitted its conclusions on Thursday, February 22, 2018.
Investigations by the Independent Enquiry Commission showed that the trajectory anomaly resulted from an incorrect value in specifications for the implementation of the launcher’s two inertial reference systems. Given the special requirements of this mission, the azimuth required for the alignment of the inertial units was 70 degrees instead of 90 degrees, as is most often the case for missions to geostationary transfer orbit. This gap led to the 20-degree shift to the south in the launcher trajectory from the initial seconds of flight. The cause of the trajectory deviation, therefore, was due to a bad specification of one of the launcher mission parameters that was not detected during the standard quality checks carried out during the Ariane 5 launches’ preparation chain.
The Independent Enquiry Commission’s work has highlighted the need to increase the robustness of the control of certain data used in preparation of the mission. Its recommendations are intended to strengthen the process of developing and verifying the documents required for launcher preparation and to introduce additional consistency checks.
With the cause of the anomaly perfectly understood and corrective measures clearly identified, Arianespace and ArianeGroup immediately implemented the recommendations of the Independent Enquiry Commission. Applied to the current Ariane 5 launch campaign, they should enable the next flight of this heavy-lift launcher in March 2018, following a Soyuz mission.
Stéphane Israël, Chief Executive Officer of Arianespace, said: “I would like to thank ESA Inspector General Toni Tolker-Nielsen, who chaired the Independent Enquiry Commission, as well as all of its members. The Commission was able to quickly identify the cause of the anomaly and issue recommendations. Arianespace and ArianeGroup already are deploying the measures recommended by the Commission, paving the way for the next launch of Ariane 5, planned for March. Thanks to the establishment of these corrective measures, we will be able to further enhance the outstanding reliability of Ariane 5.”
• January 29, 2018: NASA's GOLD mission powered on the GOLD instrument for the first time after launch on Jan. 28, 7:23 p.m. EST. The systems engineers successfully established communication with the GOLD instrument and its detector doors opened when commanded. After their tests, the engineers powered off the instrument the same day, at 7:40 p.m. EST. The instrument will remain powered off until its host satellite, SES-14, reaches geostationary orbit and GOLD operations commence later this year. 35)
- GOLD will investigate the dynamic intermingling of space and Earth’s uppermost atmosphere and seek to understand what drives change in this critical region. Resulting data will improve forecasting models of the space weather events that can impact life on Earth, as well as satellites and astronauts in space.
• January 26, 2018: Both spacecraft launched on Flight VA241 – SES-14 and Al Yah 3 – have been acquired and are operating in orbit nominally, despite a trajectory deviation experienced during the mission. This was confirmed by the satellites’ operators, SES and Yahsat, respectively. 36)
- SES has informed NASA there is minimal impact on the SES-14 satellite carrying the agency’s GOLD instrument after a launch anomaly on Jan. 25, 2018. The satellite will reach geostationary orbit four weeks later than originally planned. As the spacecraft is in good health, we expect no effect on the quality of observations and data. Originally, science operations were expected to start in mid-October. Our partners are working to maintain that timeline as closely as possible. We will provide updates as they become available. 37)
Sensor Complement
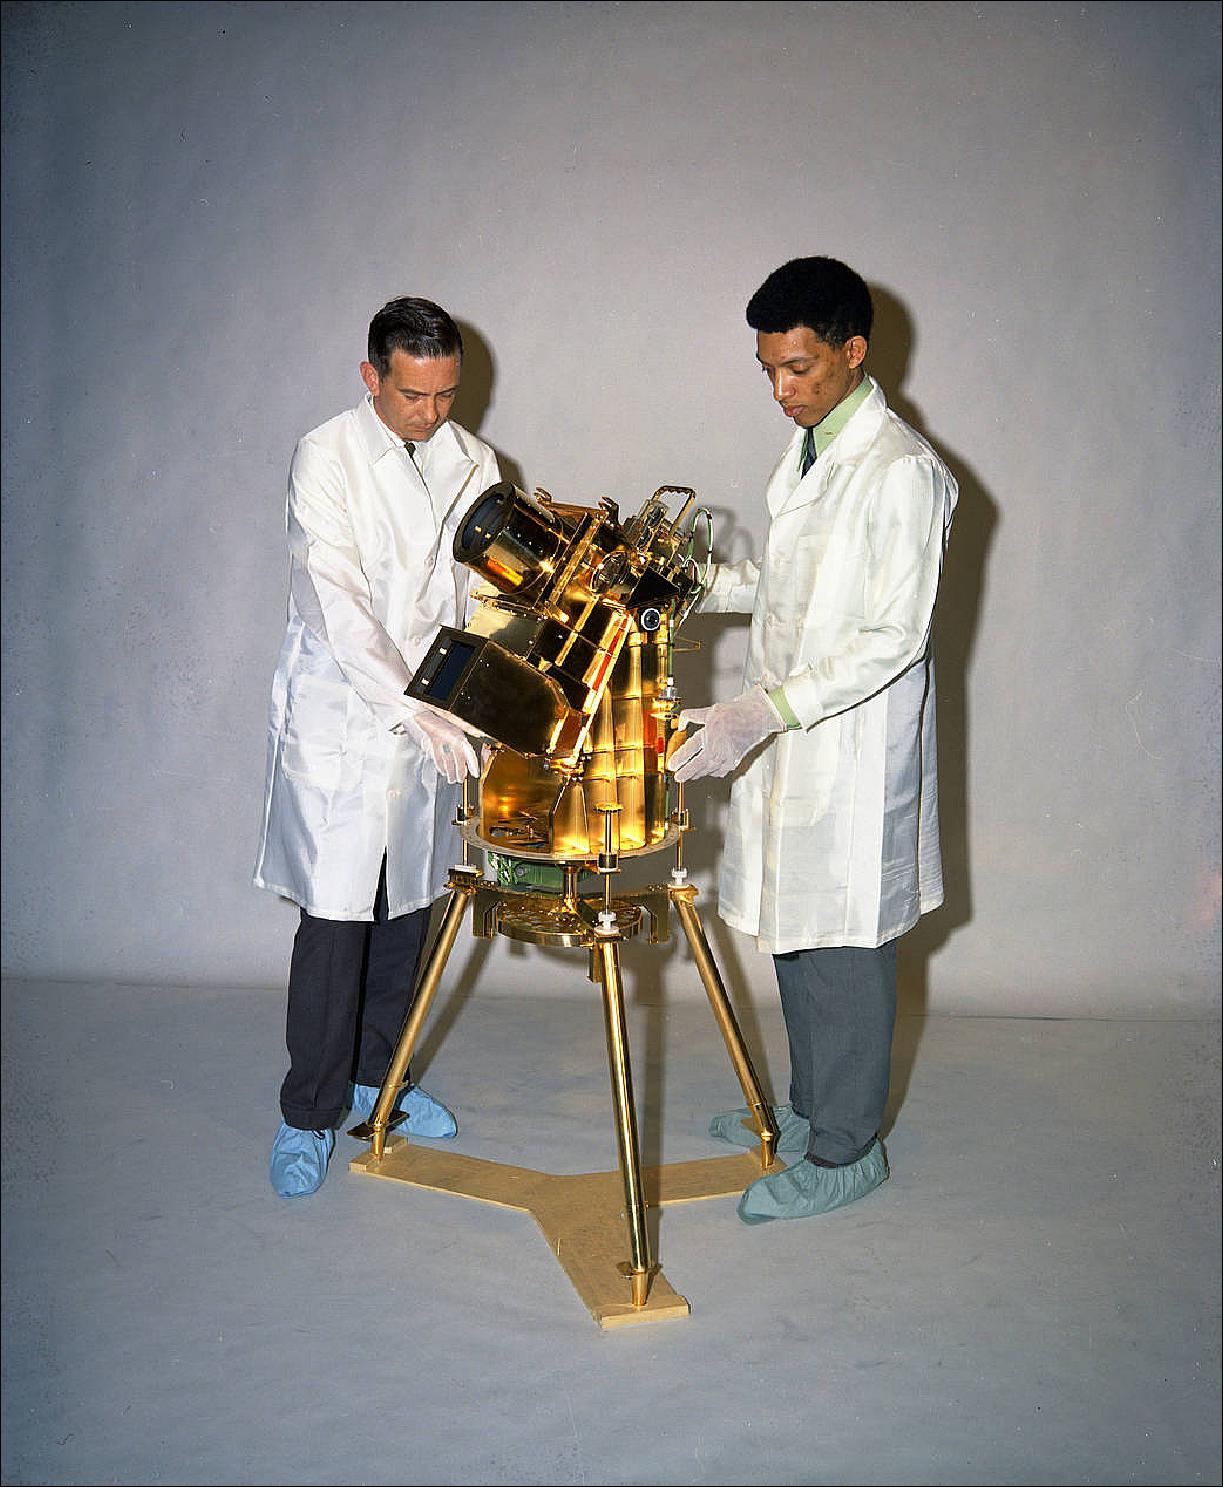
GOLD (Global-scale Observations of the Limb and Disk) Instrument
GOLD is a result of collaboration among several world-leading entities. NASA/GSFC in Greenbelt, Maryland, is providing overall NASA program management. The GOLD instrument is being designed and built at LASP (Laboratory for Atmospheric and Space Physics) at the University of Colorado, Boulder, CO. Richard Eastes, the PI of UCF/FSI (University of Central Florida/Florida Space Institute), oversees the GOLD mission. UCF will be responsible for disseminating the data products. CU/LASP is responsible for the mission and home of the Science Data Center for the mission. 38) 39) 40)
In addition to LASP, the GOLD mission partners include NCAR (National Center for Atmospheric Research), UCB ( University of California at Berkeley), Computational Physics Inc. and NOAA (National Oceanic and Atmospheric Administration). UCF is the first Florida university to lead a NASA mission.
GOLD is a high-resolution FUV (Far Ultraviolet) imaging spectrograph with two identical channels. The objective is to provide global-scale imaging and limb scans, with a 30 minute cadence. GOLD will image the Earth in the far-ultraviolet from 132 to 162 nm.
The science objectives of the GOLD mission are:
• Determine how geomagnetic storms alter the temperature and composition of Earth’s thermosphere.
• Analyze the global-scale response of the thermosphere to solar extreme-ultraviolet variability.
• Investigate the significance of atmospheric waves and tides propagating from below on the temperature structure of the thermosphere.
• Resolve how the structure of the equatorial ionosphere influences the formation and evolution of equatorial plasma density irregularities.
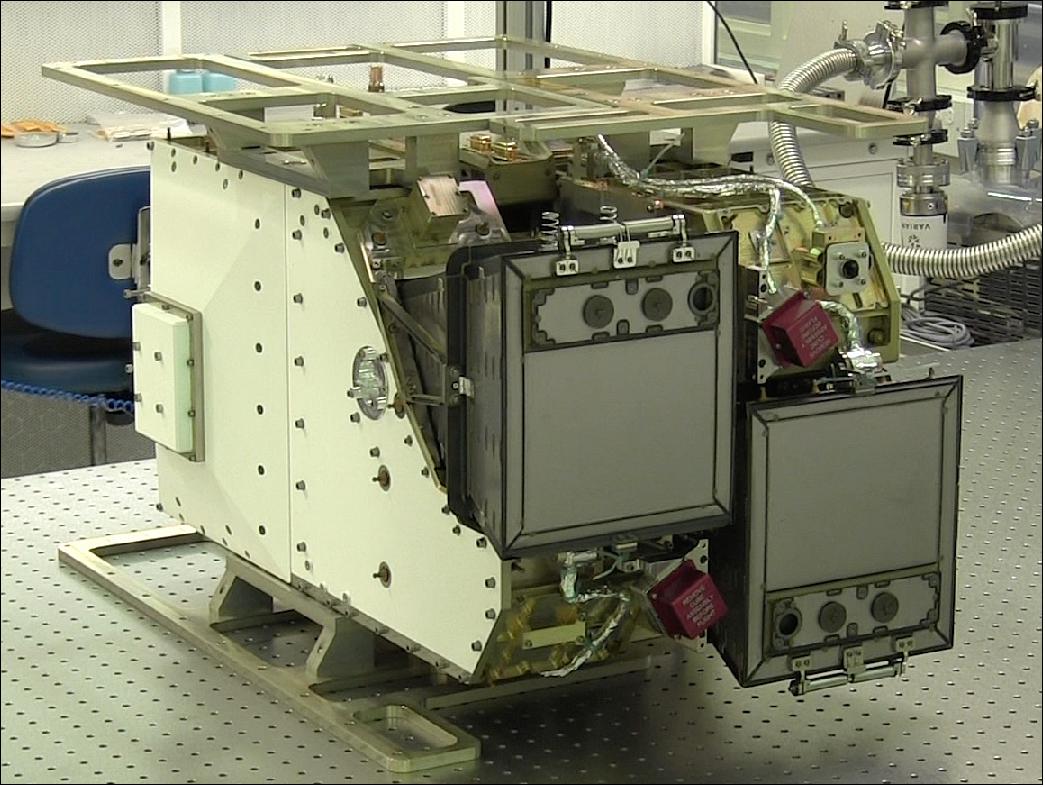
The GOLD instrument is a dual channel imaging spectrograph, each capable of all measurements, with a mass of 37 kg, a power consumption of 72 W (average), a size of 40 x 30 x 70 cm, and a data rate of ~6 Mbit/s.
Focal length of telescope: 150 mm, entrance pupil size 30 mm x 30 mm.
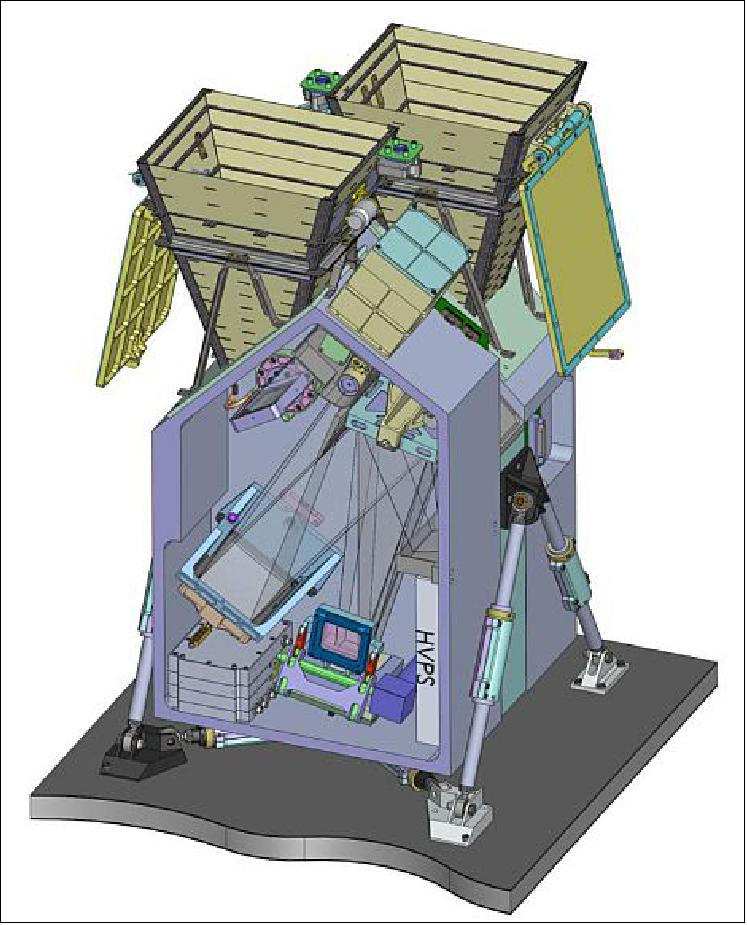
The GOLD imager has two identical and independent optical channels, each capable of performing every required measurement. These interface to the SES-14 spacecraft through a single processor assembly, which commands each channel independently. Images produced by the instrument are routed to a dedicated transponder for immediate downlink to an SES ground station. The raw images are stored at the ground station until transmission to LASP is confirmed. These are then sent over ground line to the University of Central Florida where high-level data processing converts the raw data into maps of thermosphere composition and temperature. 41)
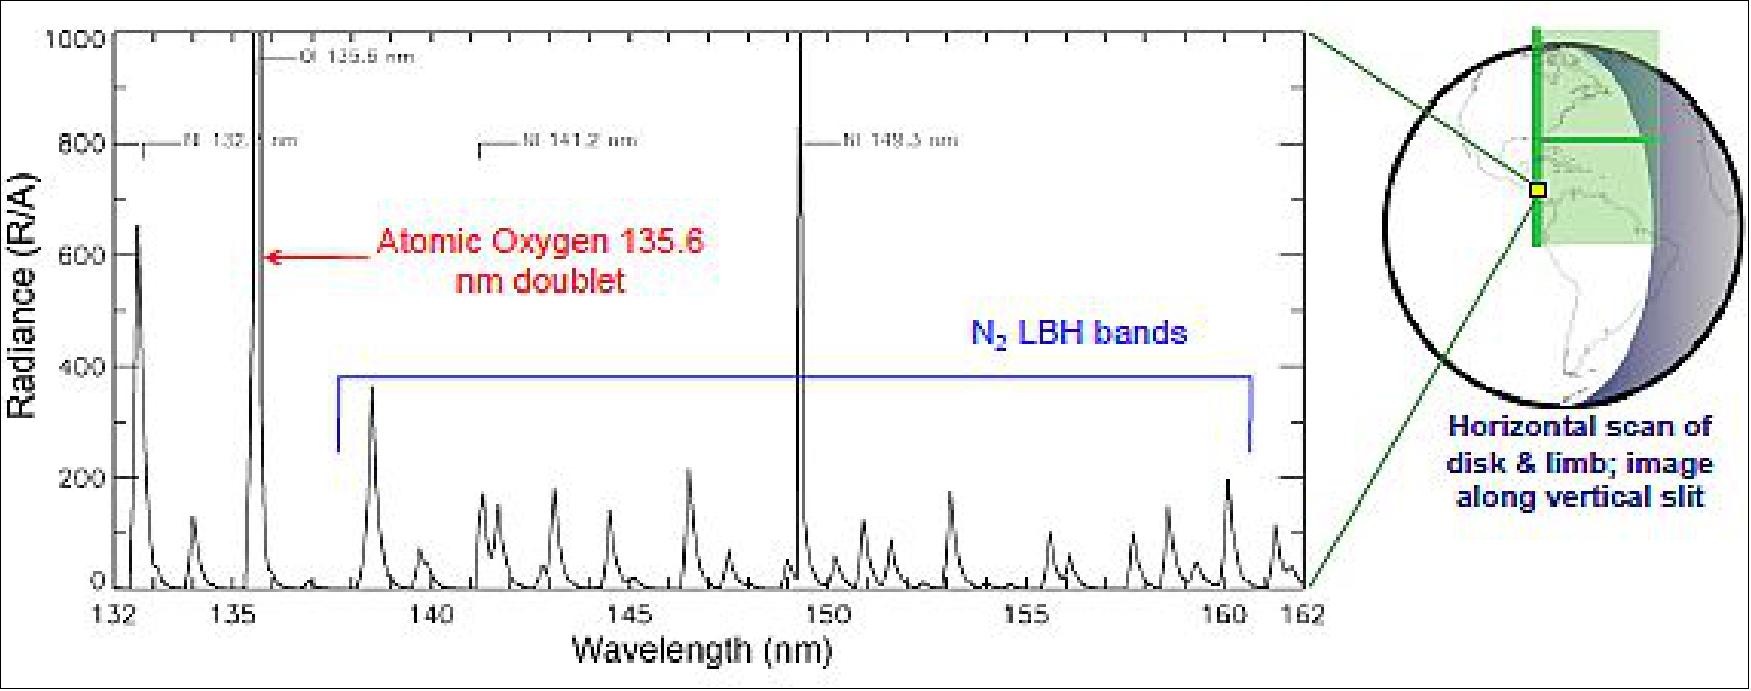
Each channel contains an ultraviolet spectrograph equipped with an imaging detector that covers 132 to 162 nm. This wavelength range contains important emissions from the main constituents of the thermosphere—atomic oxygen (135.6 nm) and molecular nitrogen (the Lyman-Birge-Hopfield (LBH) band system 132 – 162 nm). Two selectable entrance slits, which are 0.2 mm and 0.4 mm wide, respectively, enable the two spectral resolutions of 0.2 nm and 0.4 nm required for measuring temperature and composition. The optical layout of a single channel is shown here in Figure 32.
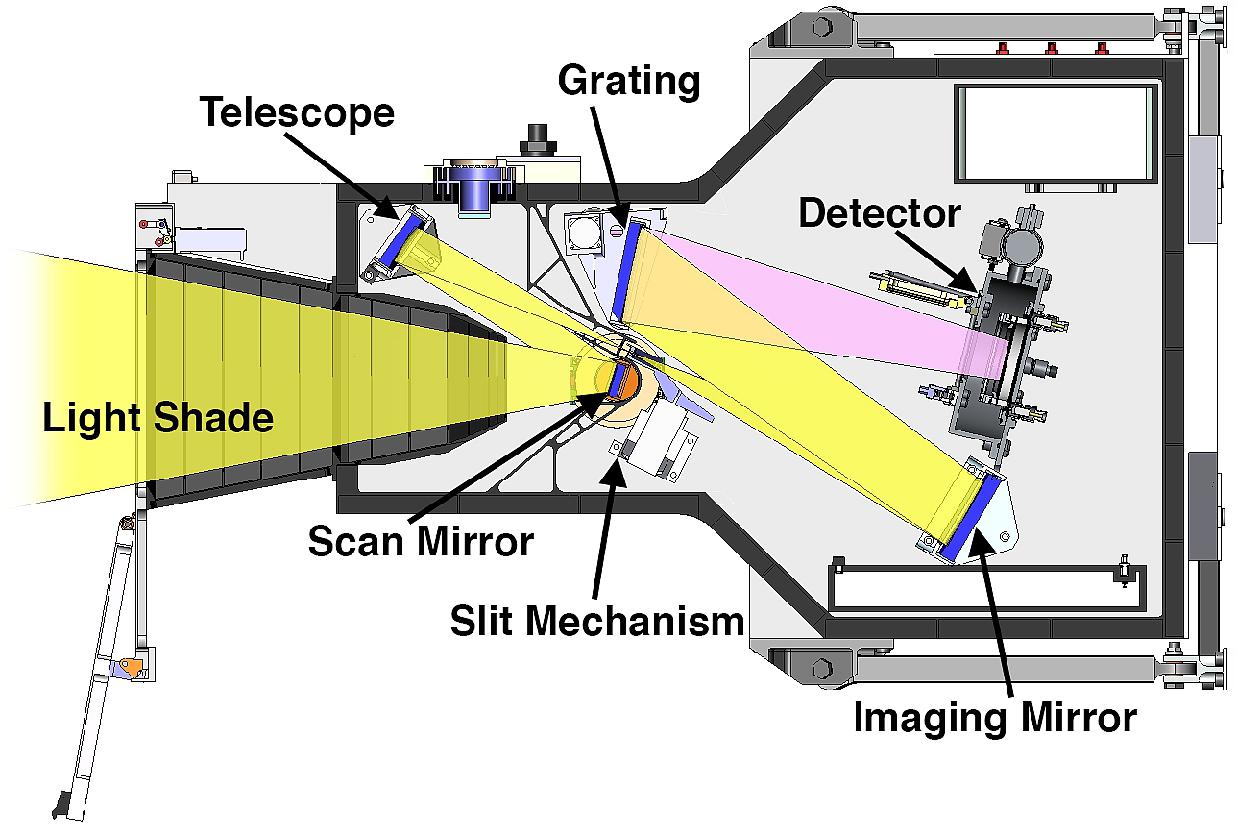
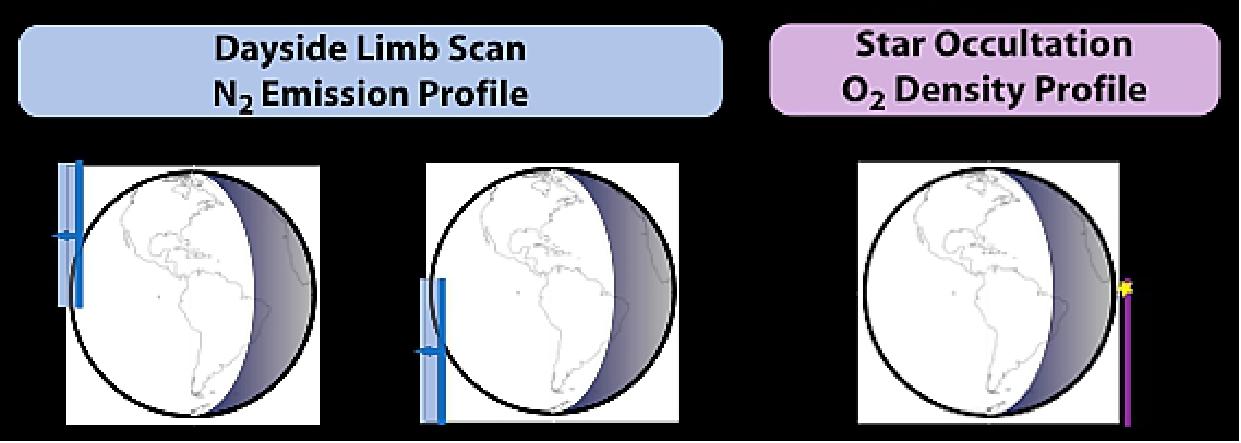
A single-mirror telescope equipped with a plane scan mirror images the spectrograph entrance slit onto the atmosphere. During an observation, a precision mechanism rotates the mirror so that the slit image sweeps east-west across the Earth’s atmosphere. The slit is only tall enough to cover a single hemisphere (either north or south). This is accommodated by tilting the mirror through approximately 4.5º. In this configuration, one face of the mirror projects the slit onto the northern hemisphere and the other face projects it onto the southern hemisphere, as illustrated in the left panel of Figure 33. A third 2.6 mm wide entrance slit is used for stellar occultations. In this configuration, which is illustrated in the right panel of Figure 33, the scan mirror is positioned near the limb of the Earth and remains motionless as the star drifts through it. This enables GOLD to measure the absorption of starlight by the atmosphere in order to measure the density of molecular oxygen, which is a minor constituent of the thermosphere.
GOLD measures composition and temperature simultaneously:
• Two identical channels
• Each channel fully independently in all observing modes
- disk images and limb scans
- dayside: T and O/N2
- nightside: O+ density
- stellar occultations
- full disk maps and limb scans with 30 minute cadence
- limiting resolution is ~50 km
• A single channel can perform all measurements with reduced cadence or reduced spatial resolution
Proven measurement techniques will be used:
• Temperature obtained on disk from rotational shape of N2 LBH (Lyman-Birge-Hopfield) bands
• O/N2 composition measured using ratio of 135.6 doublet to LBH bands
• Temperature on limb determined by slope of emission altitude profile
• O+ at night observed using 135.6 recombination emission
• O2 profile on limb from stellar occultations.
GOLD will observe space weather response to forcing:
GOLD provides a new perspective on T-I (Thermosphere-Ionosphere) system:
• Unprecedented, simultaneous imaging of composition and temperature
• Able to separate changes in time from changes in location
• Capability for continuous, real time data availability is inherent to the mission
• Provides context for ground-based and LEO measurements
• Observations will be concurrent with NASA's ICON (Ionospheric Connection Explorer) mission.
“GOLD’s imaging represents a new paradigm for observing the boundary between Earth and space,” said Bill McClintock, senior research scientist at LASP working on the project. “It will revolutionize our understanding of how the sun and the space environment affect our upper atmosphere.”
References
1) “LASP will partner on NASA mission to study Earth’s upper atmosphere,” LASP Press Release, April 12, 2013, URL: http://lasp.colorado.edu/home/blog/2013/04/12/press-release-lasp-gold/
2) “Grant Makes UCF, Florida History,” Space Daily, April 16, 2013, URL: http://www.spacedaily.com/reports/Grant_Makes_UCF_Florida_History_999.html
3) Dwayne Brown, “NASA Selects Explorer Projects To Probe Earth's Upper Atmosphere,” Contract Release: C13-100, April 12, 2013, URL: http://www.nasa.gov
/home/hqnews/2013/apr/HQ_C13-100_Helio_Explorers.html
4) “Global-scale Observations of the Limb and Disk -Imaging the Boundary Between Earth and Space,” UCF Factsheet, URL: http://www.gold-mission.org/GOLD_EX_Factsheet.pdf
5) R. W. Eastes, W. E. McClintock, A. G. Burns, S. C. Solomon, D. N. Anderson, L. Andersson, M. Codrescu, R. E. Daniell, S. L. England, J. E. Harvey, A. Krywonos, M. Lankton, J. D. Lumpe, A. D. Richmond, D. W. Rusch, O. Siegmund, D. J. Strickland, T. N. Woods, A. Aksnes, S. A. Budzien, K. F. Dymond, F. G. Eparvier, R. S. Lieberman, C. R. Martinis, J. Oberheide, H. Foroosh, “Global-Scale Observations of the Limb and Disk (GOLD) - A New View of the Thermosphere-Ionosphere System,” 11th Conference on Space Weather at the 2014 AMS Meeting, Atlanta, GA, USA, Feb. 2-6, 2014, URL: http://www.gold-mission.org/DL/GOLD_AMS2014_final.pdf
6) http://today.ucf.edu/55-million-grant-makes-ucf-florida-history/
7) ”Airbus Defence and Space to build SES-14 satellite,” Airbus DS Press Release, Feb. 18, 2015, URL: http://www.space-airbusds.com/en/press_centre/airbus-defence-and-space-to-build-ses-14-satellite.html
8) ”Electric propulsion satellites,” Airbus DS, URL: http://www.space-airbusds.com
/en/programmes/electric-propulsion-satellites.html
9) Mark Lankton, Robert Caffrey, Rich Pang, Richard Eastes, David N. Anderson, Laila Andersson, Alan G. Burns, Mihail Codrescu, Robert E. Daniell, Scott England, Jim Harvey, Andrey Krywonos, Ruth Segal Lieberman, Jerry D. Lumpe, Carlos Rubens Martinis, William E. McClintock, Jens Oberheide, Arthur D. Richmond, David W. Rusch, Ossy Siegmund, Stanley C. Solomon, Douglas J. Strickland, Thomas N. Woods, ”Global-scale Observations of the Limb and Disk (GOLD): Hosted Payload Accommodation on a Commercial Satellite,” AGU Meeting, Dec. 2013, SA43B-2139, URL:
http://www.gold-mission.org/DL/GOLD_Hosted_Payload_Accommodation_AGU%20Dec%202013.pdf
10) ”GOLD - Global-scale Observations of the Limb and Disk,” NASA, July 31, 2015, URL:
http://www.nasa-usa.de/mission_pages/sunearth/missions/mission_gold.html
11) Robert Briel, ”SES-14 arrives at Kourou for January launch,” Broadband News, 22 Dec. 2017, URL: https://www.broadbandtvnews.com/2017/12/22/ses-14-arrives-at-kourou-for-january-launch/
12) ”GOLD Instrument and SES-14 Spacecraft,” NASA, 14 Dec. 2017, URL: https://www.nasa.gov
/image-feature/goddard/2017/gold-instrument-and-ses-14-spacecraft
13) ”SES-14 integrates NASA ultraviolet space spectrograph,” SES, May 23, 2017, URL: https://www.ses.com/press-release/ses-14-integrates-nasa-ultraviolet-space-spectrograph
14) Tom Mason, ”GOLD installed on commercial communications satellite,” May 17, 2017, URL: http://gold.cs.ucf.edu/gold-installed-on-commercial-communications-satellite/
15) ”GOLD one step closer to launching into space,” UCF, Jan. 4, 2017: URL: http://gold.cs.ucf.edu
/nasa-mission-one-step-closer-to-launching-into-space/
16) ”GOLD Science Team,” URL: http://gold.cs.ucf.edu/gold-team/
17) ”Ariane 5 launch VA241 for SES-14 and Al Yah 3: Update,” Arianespace, 25 Jan. 2018, URL: http://www.arianespace.com/mission-update/va241/
18) ”CU-Boulder Hitches A Ride To Space On Commercial Satellite,” Colorado Space News, April 17, 2015, URL: https://web.archive.org/web/20201024000256/http://www.coloradospacenews.com/cu-boulder-hitches-a-ride-to-space-on-commercial-satellite/
19) ”UCF GOLD Project Makes Critical Step on Path to Space,” UCF, April 7, 2015, URL: https://web.archive.org/web/20150908053422/https://fsi.ucf.edu/ucf-gold-project-makes-critical-step-on-path-to-space/
20) Miles Hatfield, ”In Earth’s Highest Atmospheric Layers, Space Weather Can Really Heat Things Up,” NASA The Sun Spot, 18 October 2021, URL: https://blogs.nasa.gov/sunspot/2021/10/18/
in-earths-highest-atmospheric-layers-space-weather-can-really-heat-things-up/
21) F. I. Laskar, R. W. Eastes, M. V. Codrescu, J. S. Evans, A. G. Burns, W. Wang, W. E. McClintock, S. Aryal, X. Cai, ”Response of GOLD Retrieved Thermospheric Temperatures to Geomagnetic Activities of Varying Magnitudes,” Geophysical Research Letters, Volume48, Issue15, August 2021, e2021GL093905, Volume48, Issue15,August 2021, e2021GL093905, https://doi.org/10.1029/2021GL093905
22) Sarah Frazier, ”GOLD’s Bird’s-Eye Reveals Dynamics in Earth’s Interface to Space,” NASA Feature, 30 August 2021, URL: https://www.nasa.gov/feature/goddard/2021/
gold-s-bird-s-eye-reveals-dynamics-in-earth-s-interface-to-space
23) Xuguang Cai, Alan G. Burns, Wenbin Wang, Liying Qian, Jing Liu, Stanley C. Solomon, Richard W. Eastes, Robert E. Daniell, Carlos R. Martinis, William E. McClintock, Inez S. Batista, ”Observation of Postsunset OI 135.6 nm Radiance Enhancement Over South America by the GOLD Mission,” JGR Space Physics, Volume126, Issue2, February 2021, e2020JA028108, https://doi.org/10.1029/2020JA028108
24) Sarah Frazier, ”Research Highlights from NASA’s GOLD Mission,” NASA The Sun Spot, 14 January 2021, URL: https://blogs.nasa.gov/sunspot/2021/01/14/research-highlights-from-nasas-gold-mission/
25) Saurav Aryal, J. S. Evans, John Correira, Alan G. Burns, Wenbin Wang, Stanley C. Solomon, Fazlul I. Laskar, William E. McClintock, Richard W. Eastes, Tong Dang, Jiuhou Lei, Huixin Liu, Geonhwa Jee, ”First Global‐Scale Synoptic Imaging of Solar Eclipse Effects in the Thermosphere,” Journal of Geographical Research, Volume125, Issue9, Published: 4 September 2020, e2020JA027789, https://doi.org/10.1029/2020JA027789
26) ”A GOLDen Look at the Ionosphere,” NASA Earth Observatory, Image of the Day for 26 December 2019, URL: https://earthobservatory.nasa.gov/images/146043/a-golden-look-at-the-ionosphere
27) ”Postcards from the Edge of Space: Scientists Present New Ionosphere Images and Science,” NASA feature, 10 December 2019, URL: https://www.nasa.gov/feature/goddard/2019/
postcards-from-the-edge-of-space-scientists-present-new-ionosphere-images-and-science
28) Tom Mason, ”GOLD reveals unexpected changes in Earth’s nighttime ionosphere,” NASA, 13 August 2019, URL: https://gold.cs.ucf.edu/gold-reveals-unexpected-changes-in-earths-nighttime-ionosphere/
29) Miles Hatfield, Lina Tran, ”Earth's Shining Upper Atmosphere — From the Apollo Era to the Present,” NASA, 17 July 2019, URL: https://www.nasa.gov/feature/goddard/2019/
earth-shining-upper-atmosphere-ionosphere-apollo-era-gold-camera-moon
30) Tom Mason, ”First Release of Data from GOLD,” UCF, 12 March 2019, URL: https://gold.cs.ucf.edu
/first-release-of-data-from-gold/
31) ”NASA’s GOLD instrument captures its first image of the Earth,” LASP, 17 September 2018, URL: http://lasp.colorado.edu/home/2018/09/17/nasas-gold-instrument-captures-its-first-image-of-the-earth/
32) ”GOLD Captures Its First Image of the Earth,” UCF, 17 September 2018, URL: http://gold.cs.ucf.edu/gold-captures-its-first-image-of-the-earth/
33) ”Now Fully Engaged at 47.5 Degrees West is the SES-14 Satellite,” Satnews Daily, 4 September 2018, URL: http://www.satnews.com/story.php?number=1710110610
34) ”Independent Enquiry Commission announces conclusions concerning the launcher trajectory deviation during Flight VA241,” Arianespace, 23 Feb. 2018, URL: http://www.arianespace.com/
press-release/independent-enquiry-commission-announces-conclusions-concerning-the-launcher-trajectory-deviation-during-flight-va241/
35) ”NASA’s GOLD Powers on for the First Time,” NASA, 29 Jan. 2018, URL: https://www.nasa.gov/feature/goddard/2018/nasa-s-gold-powers-on-for-the-first-time
36) ”SES-14 and Al Yah 3 satellites orbited by Ariane 5 on Flight VA241,” Arianespace, 26 Jan. 2018, URL: http://www.arianespace.com/mission-update/ses-14-and-al-yah-3-satellites-orbited/
37) ”NASA Statement on Impact to GOLD Mission After Launch Anomaly,” NASA 26 Jan. 2018, Update, URL: https://www.nasa.gov/feature/goddard/2018/nasa-s-gold-powers-on-for-the-first-time
38) Richard Eastes, ”Global-scale Observations of the Limb and Disk (GOLD) Mission – an Unprecedented View of the Thermosphere-Ionosphere System,” CEDAR June 23, 2014, URL: https://cedarweb.vsp.ucar.edu/wiki/images/4/4a/2014CEDAR_plenary_Eastes.pdf
39) ”GOLD Approved for Final Design and Fabrication,” LASP Press Release, March 31, 2015, URL: http://lasp.colorado.edu/home/blog/2015/03/31/
press-release-gold-approved-for-final-design-and-fabrication/
40) ”Quick Facts: Global-scale Observations of the Limb and Disk (GOLD), LASP, URL: http://lasp.colorado.edu/home/missions-projects/quick-facts-gold/
41) ”GOLD instrument,” UCF, URL: http://gold.cs.ucf.edu/science-mission/gold-instrument/
The information compiled and edited in this article was provided by Herbert J. Kramer from his documentation of: ”Observation of the Earth and Its Environment: Survey of Missions and Sensors” (Springer Verlag) as well as many other sources after the publication of the 4th edition in 2002. - Comments and corrections to this article are always welcome for further updates (eoportal@symbios.space).
Spacecraft Launch Mission status Instrument References Back to Top