Hunga Tonga
EO
Quick facts
Overview
| Mission type | EO |
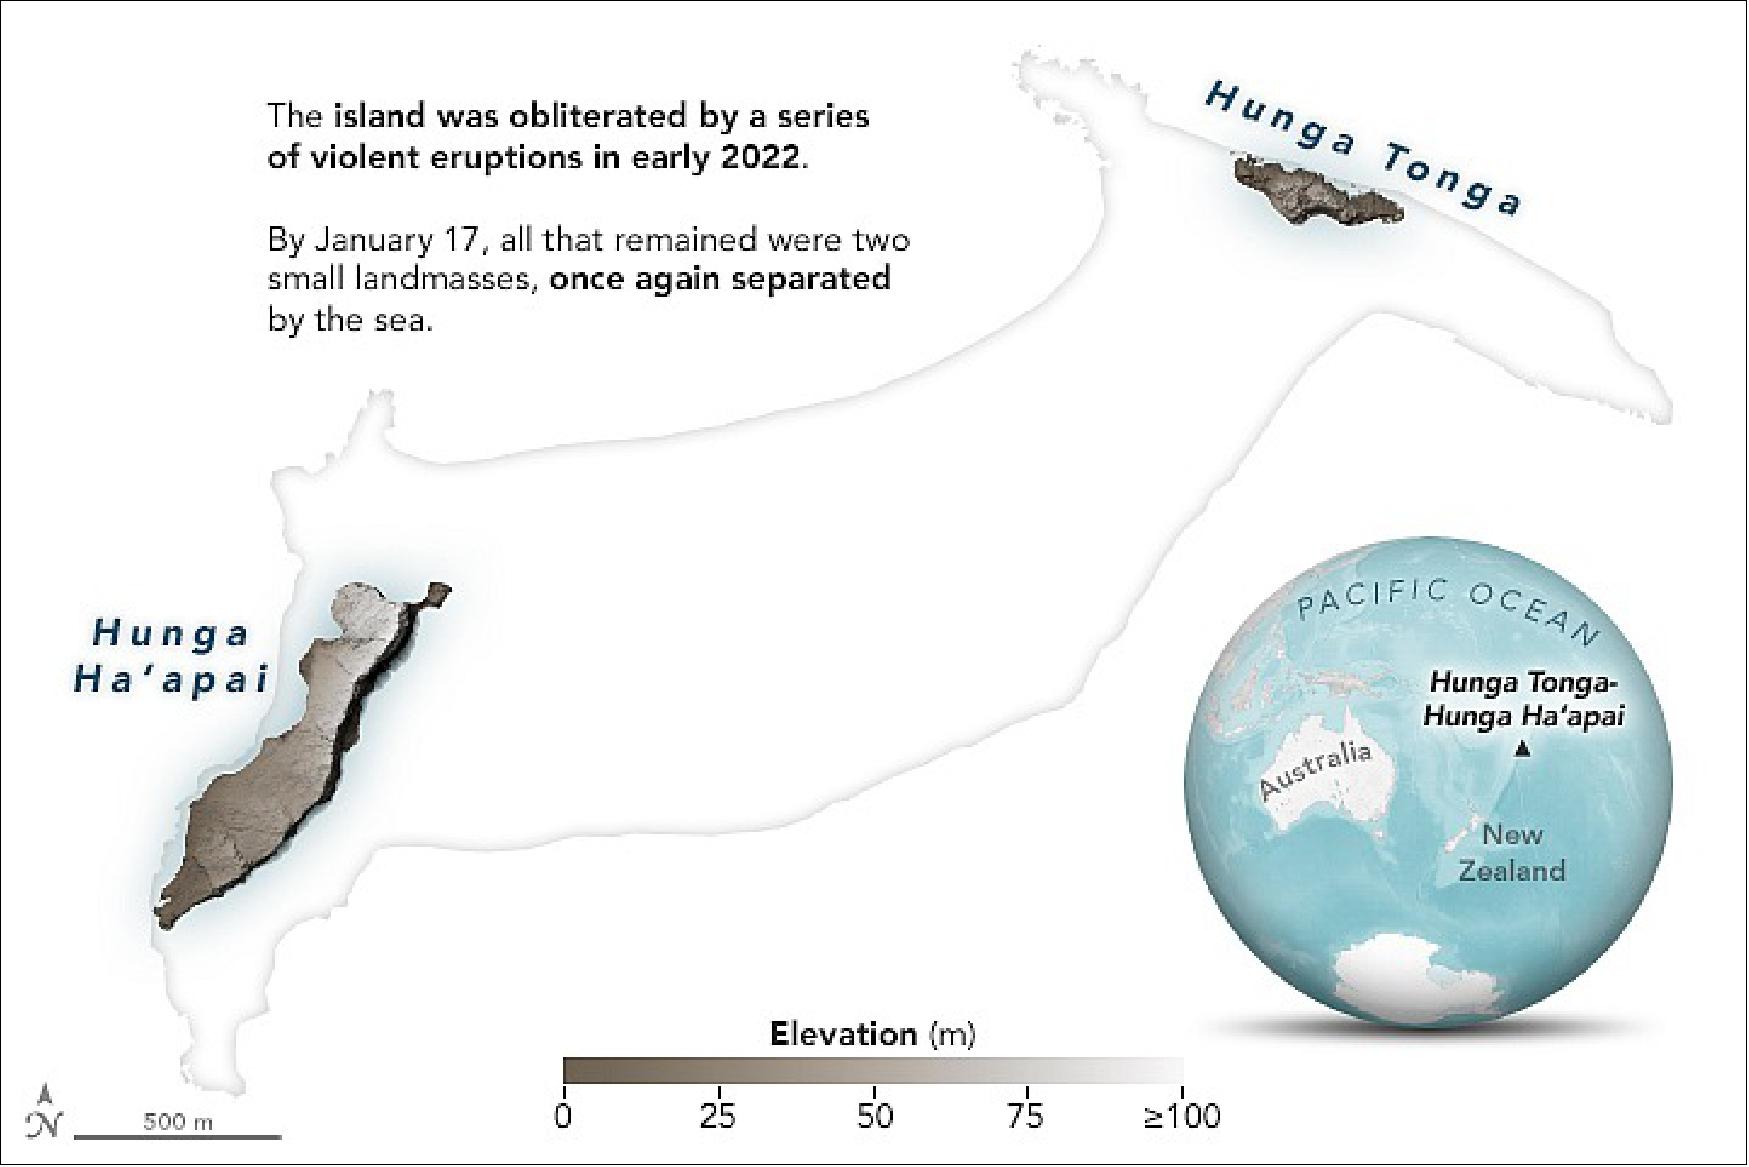
Hunga Tonga — Hunga Ha‘apai Eruption in January 2022
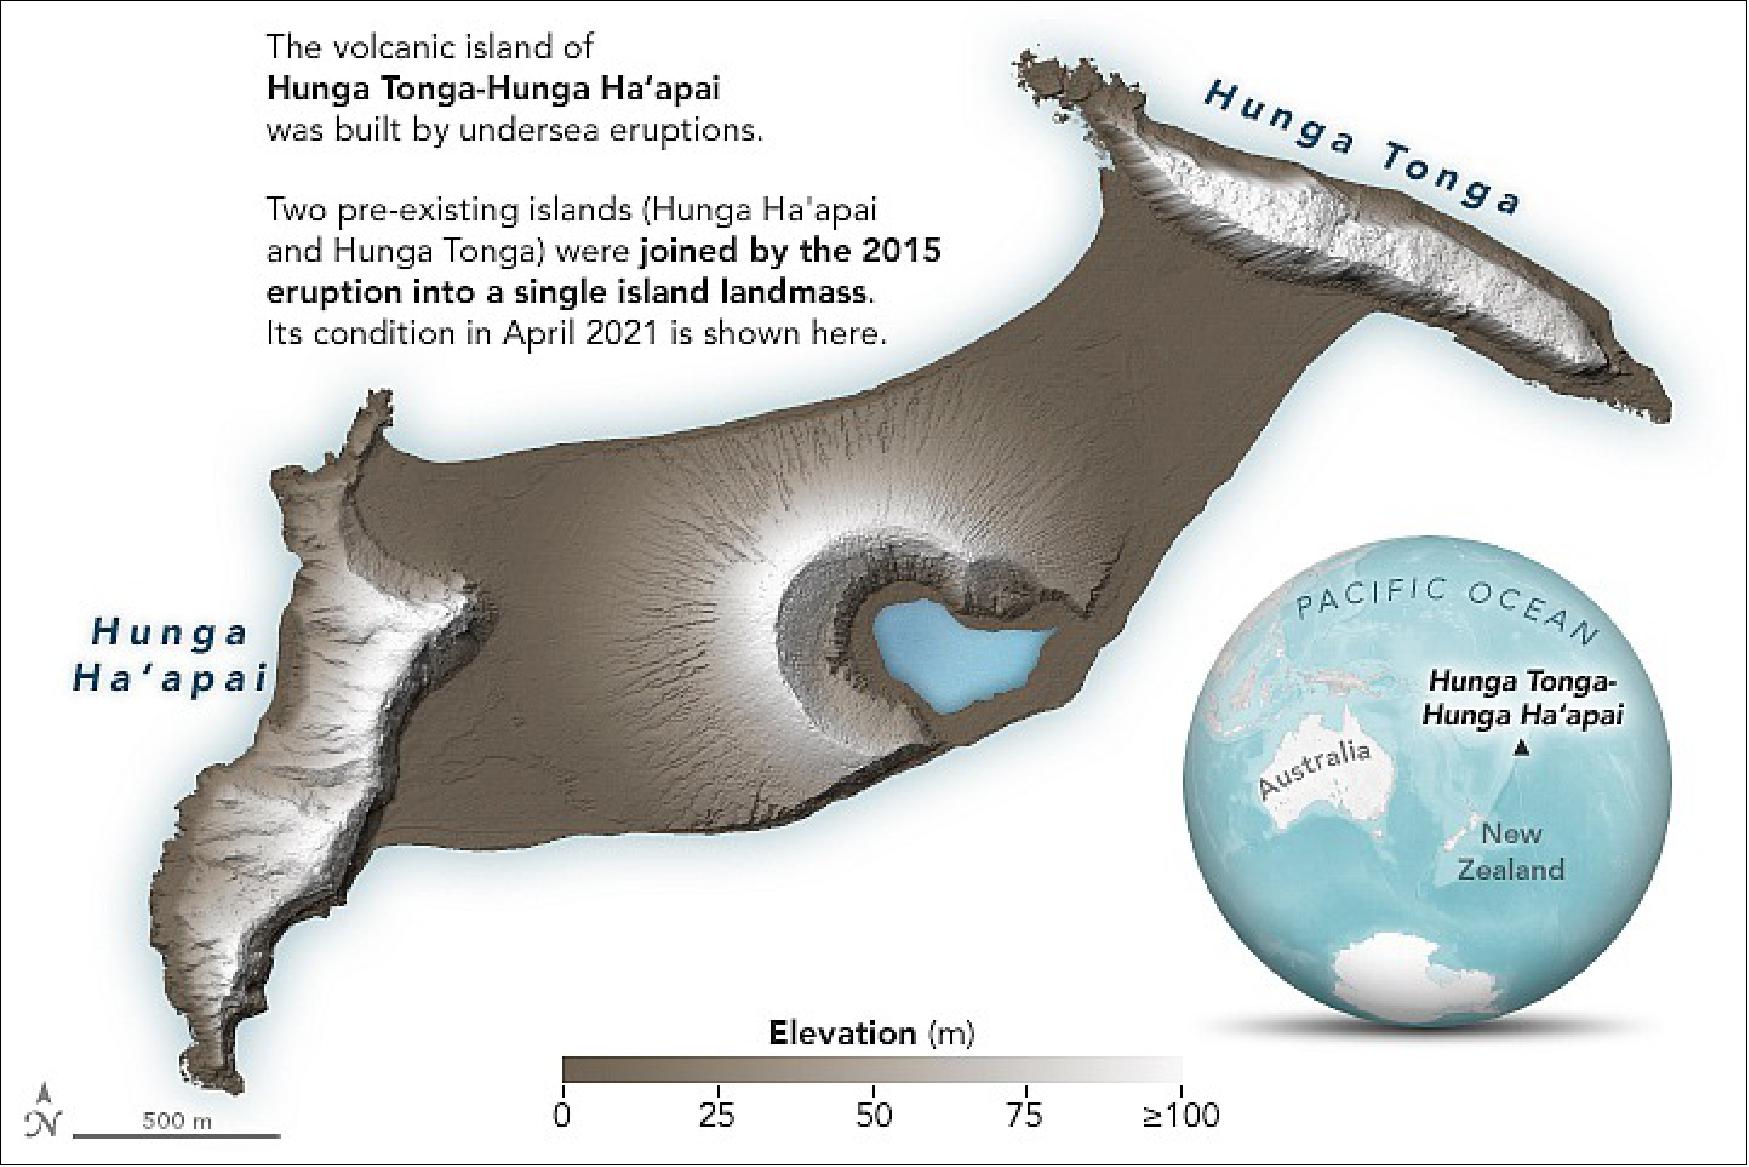
When a volcano in the South Pacific Kingdom of Tonga began erupting in late-December 2021 and then violently exploded in mid-January 2022, NASA scientist Jim Garvin and colleagues were unusually well positioned to study the events. Ever since new land rose above the water surface in 2015 and joined two existing islands, Garvin and an international team of researchers have been monitoring changes there. The team used a combination of satellite observations and surface-based geophysical surveys to track the evolution of the rapidly changing piece of Earth. 1)
“This is a preliminary estimate, but we think amount of energy released by the eruption was equivalent to somewhere between 5 to 30 megatons of TNT,” said Garvin, chief scientist at NASA’s Goddard Space Flight Center. “That number is based on how much was removed, how resistant the rock was, and how high the eruption cloud was blown into the atmosphere at a range of velocities.” The blast released hundreds of times the equivalent mechanical energy of the Hiroshima nuclear explosion. For comparison, scientists estimate Mount St. Helens exploded in May 1980 with 24 megatons and Krakatoa burst in 1883 with 200 megatons of energy.
Garvin and NASA colleague Dan Slayback worked with several researchers to develop detailed maps of Hunga Tonga-Hunga Ha‘apai above and below the water line. They used high-resolution radar from the Canadian Space Agency’s RADARSAT Constellation Mission, optical observations from the commercial satellite company Maxar, and altimetry from NASA’s ICESat-2 mission. They also used sonar-based bathymetry data collected by the Schmidt Ocean Institute, in partnership with NASA and Columbia University.
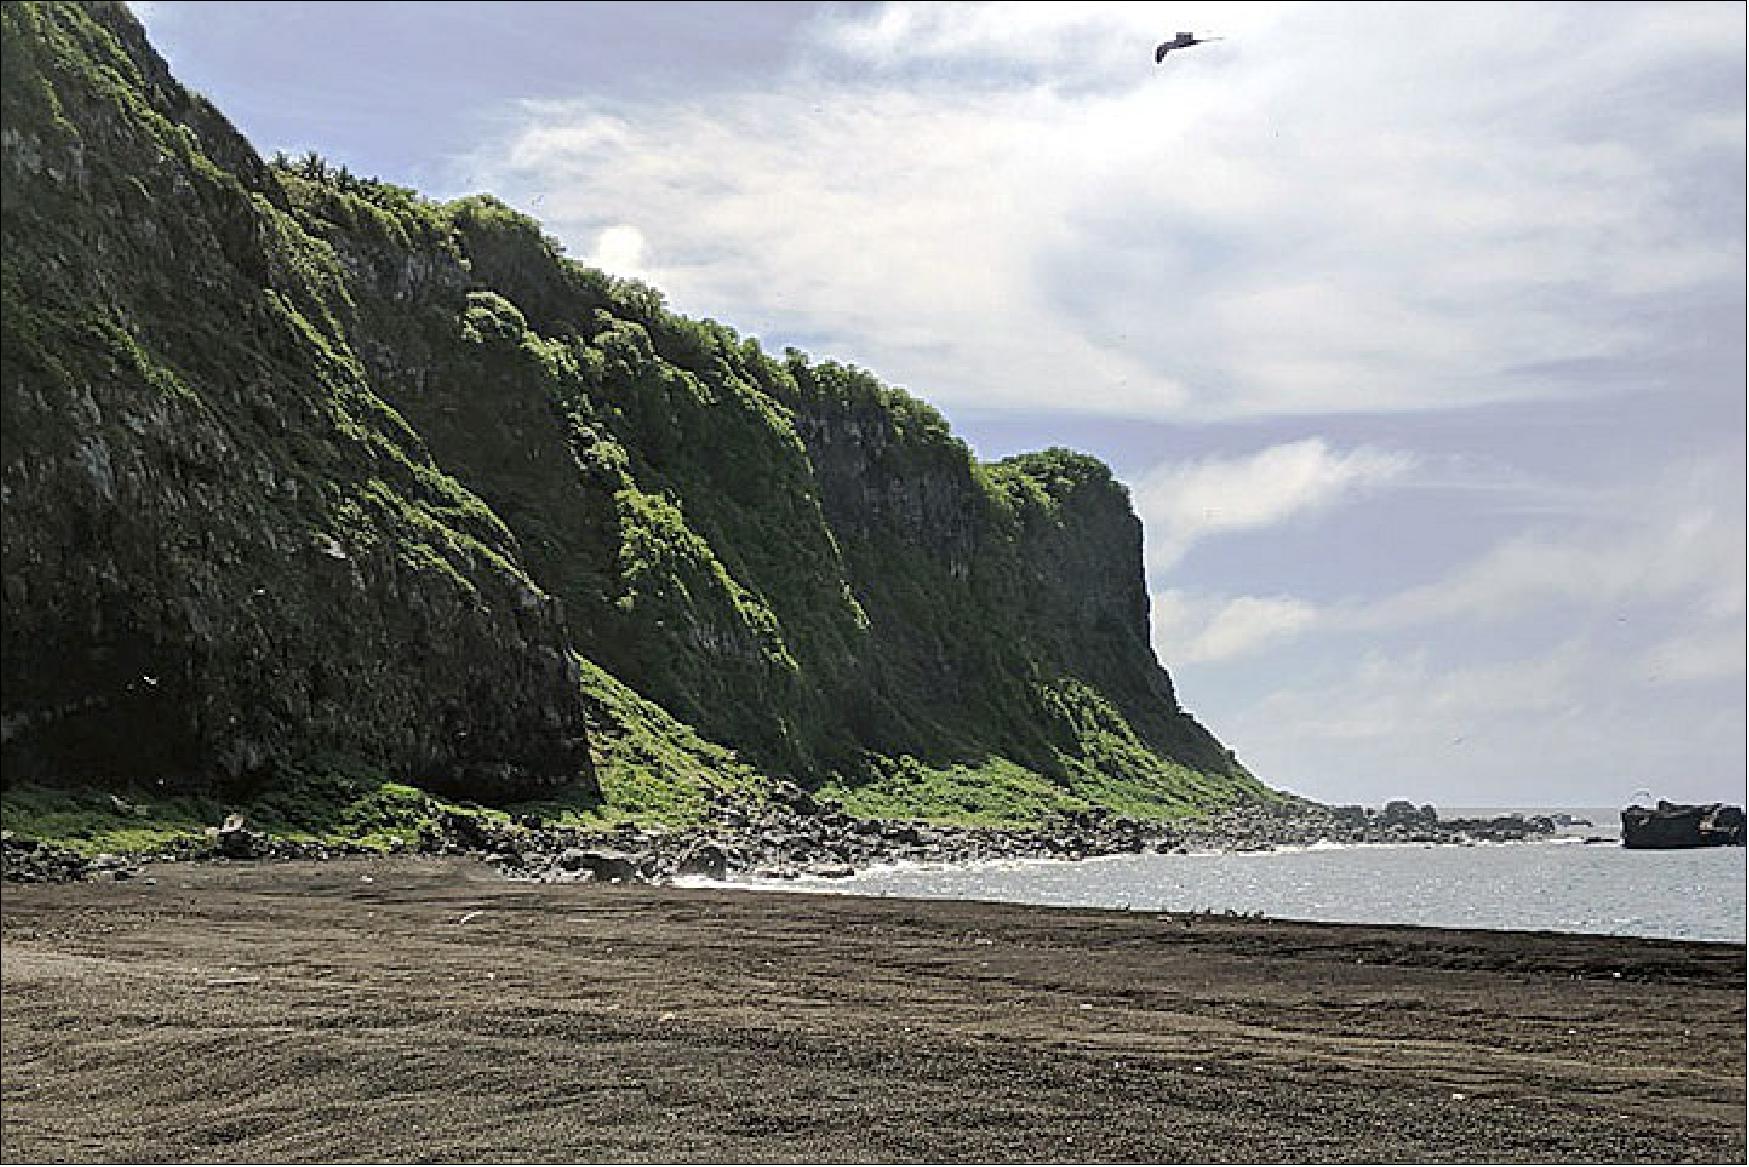
For the past six years, researchers from NASA, Columbia, the Tongan Geological Service, and the Sea Education Association worked together to determine how the young terrain was eroding due to the ongoing churn of waves and occasional battering by tropical cyclones. They also noted how wildlife—various types of shrubs, grasses, insects, and birds—had moved from the lush ecosystems of Hunga Tonga and Hunga Ha‘apai and colonized the more barren landscapes of the newer land.
Things changed dramatically in January. For the first few weeks of 2022, the volcanic activity seemed typical enough, with intermittent, small explosions of tephra, ash, steam, and other volcanic gases as magma and seawater interacted at a vent near the middle of the island. The ongoing Surtseyan eruptions were reshaping the landscape and enlarging the island by adding new deposits of ash and tuff to the growing volcanic cone.
“By early January, our data showed the island had expanded by about 60 percent compared to before the December activity started,” said Garvin. “The whole island had been completely covered by a tenth of cubic kilometer of new ash. All of this was pretty normal, expected behavior, and very exciting to our team.”
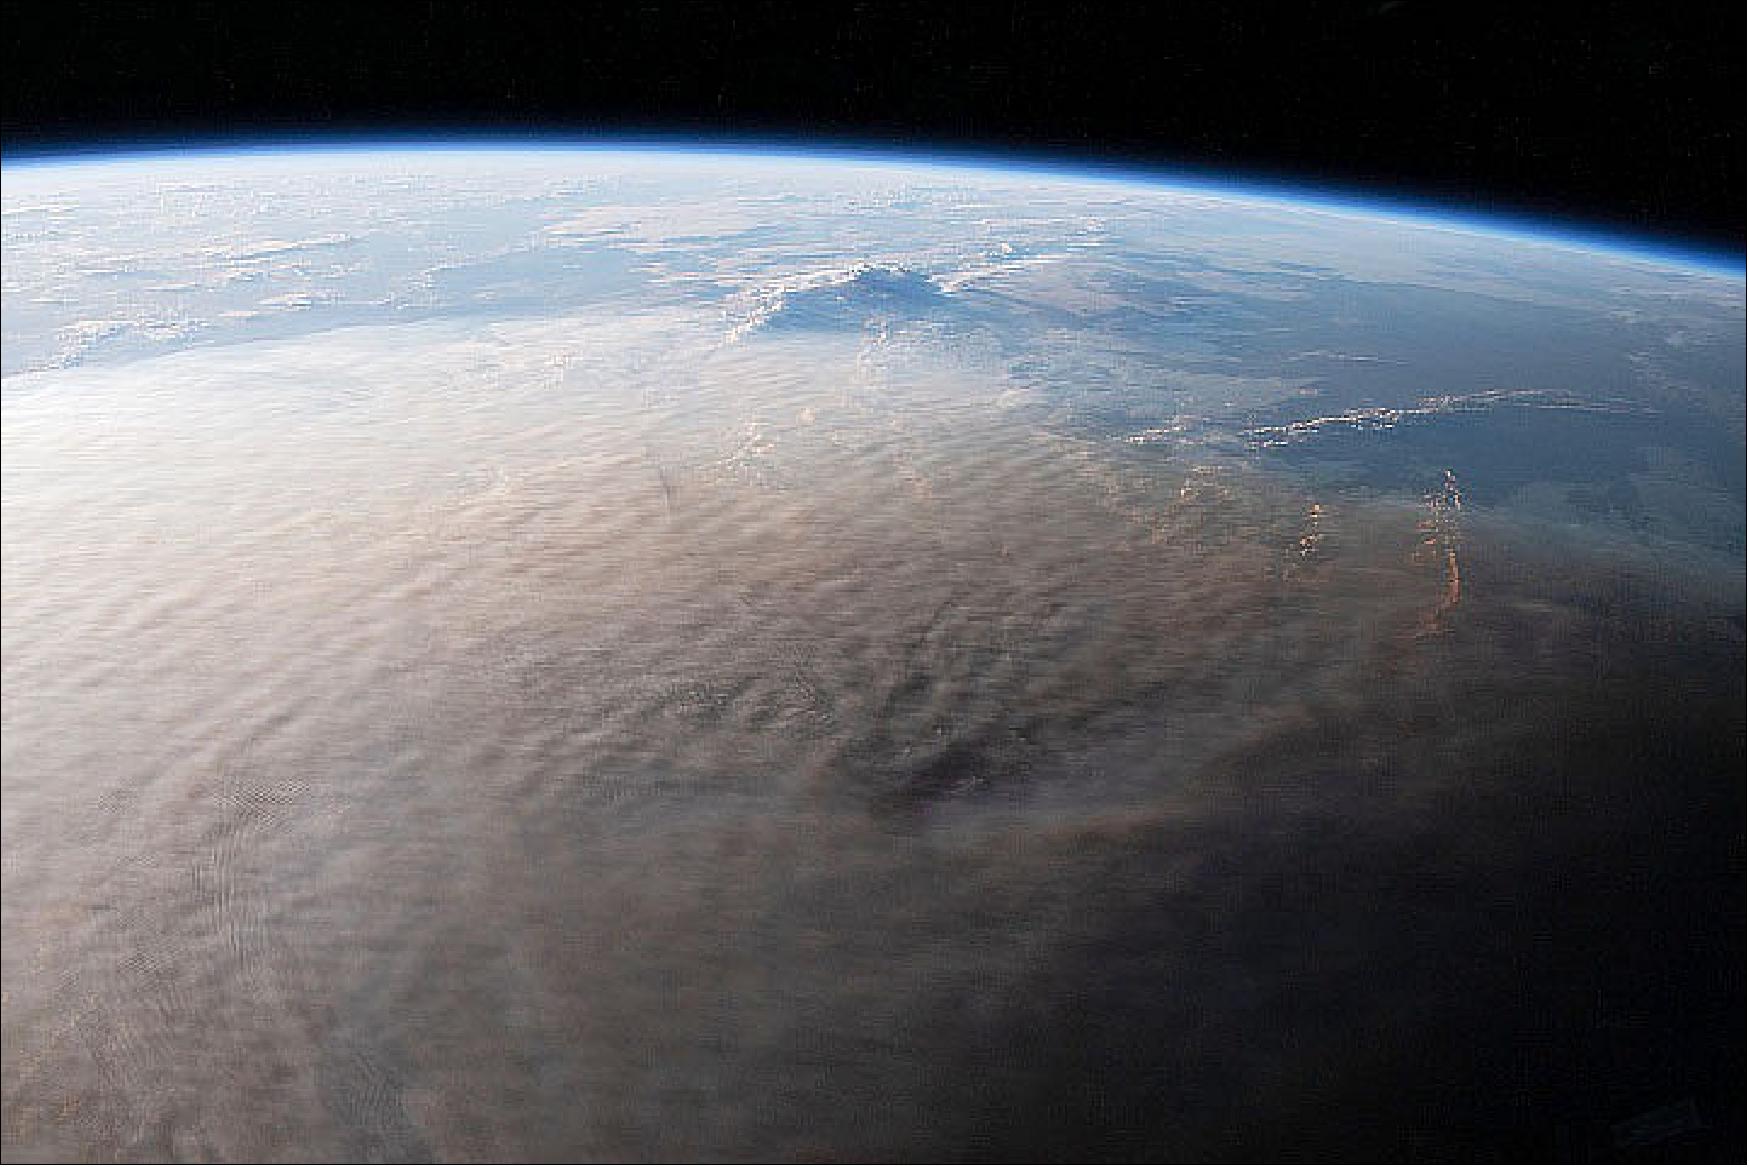
But on January 13-14, an unusually powerful set of blasts sent ash surging into the stratosphere. Then explosions on January 15 launched material as high as 40 km (25 miles) in altitude and possibly as high as 50 km, blanketing nearby islands with ash and triggering destructive tsunami waves. An astronaut aboard the International Space Station took this photo of ash over the South Pacific.
Most Surtseyan style eruptions involve a relatively small amount of water coming into contact with magma. “If there’s just a little water trickling into the magma, it’s like water hitting a hot frying pan. You get a flash of steam and the water burns burn off quickly,” explained Garvin. “What happened on the 15th was really different. We don’t know why — because we don’t have any seismometers on Hunga Tonga-Hunga Ha‘apai — but something must have weakened the hard rock in the foundation and caused a partial collapse of the caldera’s northern rim. Think of that as the bottom of the pan dropping out, allowing huge amounts of water to rush into an underground magma chamber at very high temperature.”
The temperature or magma usually exceeds 1000 º Celsius; seawater is closer to 20ºC. The mixing of the two can be incredibly explosive, particularly in the confined space of a magma chamber. “This was not your standard Surtseyan eruption because of the large amount of water that had to be involved,” said Garvin. “In fact, some of my colleagues in volcanology think this type of event deserves its own designation. For now, we’re unofficially calling it an ‘ultra Surtseyan’ eruption.”
For a geologist like Garvin, watching the birth and evolution of a “Surtseyan island” like this is fascinating, partly because there have not been many other modern examples. Aside from Surtsey — which formed near Iceland in 1963 to 1967 and still exists more than a half-century later—most new Surtseyan islands get eroded away within a few months or years.
What also interests Garvin about these islands is what they may teach us about Mars. “Small volcanic islands, freshly made, evolving rapidly, are windows in the role of surface waters on Mars and how they may have affected similar small volcanic landforms,” he said. “We actually see fields of similar-looking features on Mars in several regions.”
Update information of the Hunga Tonga-Hunga Ha'apai volcano eruption
Deep down temperature shifts give rise to eruptions
• February 15, 2022: The astonishing force of the Tonga volcanic eruption shocked the world, but the fact that this underwater volcano actually erupted came as less of a surprise to geoscientists using satellite data to study changes in the temperature deep below Earth’s surface. 3)
- The cataclysmic explosion of the Hunga Tonga-Hunga Ha‘apai volcano in January is reported to have been the biggest eruption recorded anywhere on the planet in 30 years. It sent a plume of ash soaring into the sky, left the island nation of Tonga smothered in ash, sonic booms were heard as far away as Alaska and tsunami waves raced across the Pacific Ocean.
- While the Tonga eruption was powerful but short, last year’s eruption of the Cumbre Vieja volcano on the Spanish Canary Island of La Palma was less explosive but lasted for almost three months.
- Although different, both of these recent eruptions remind us all of how devastating nature can be. A better understanding of the natural processes that are occurring deep below our feet might bring the possibility of predicting eruptions a little closer.
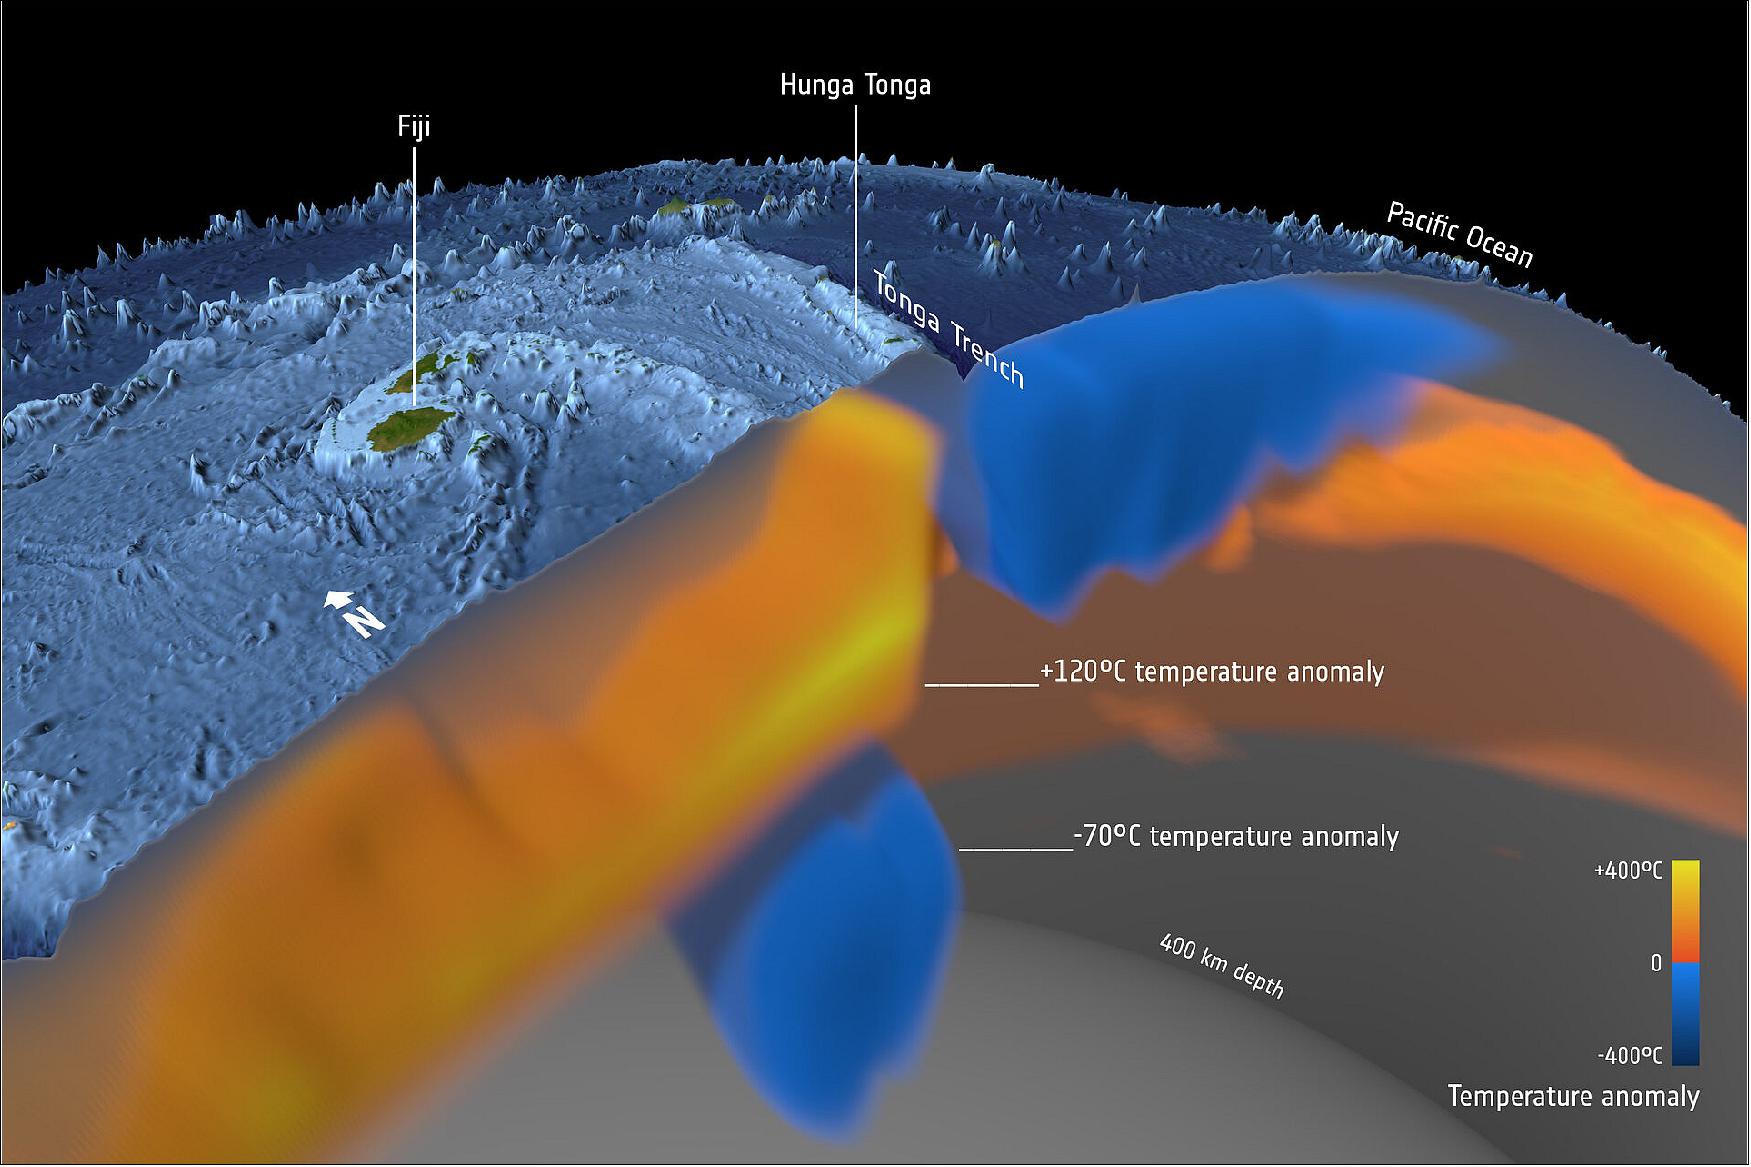
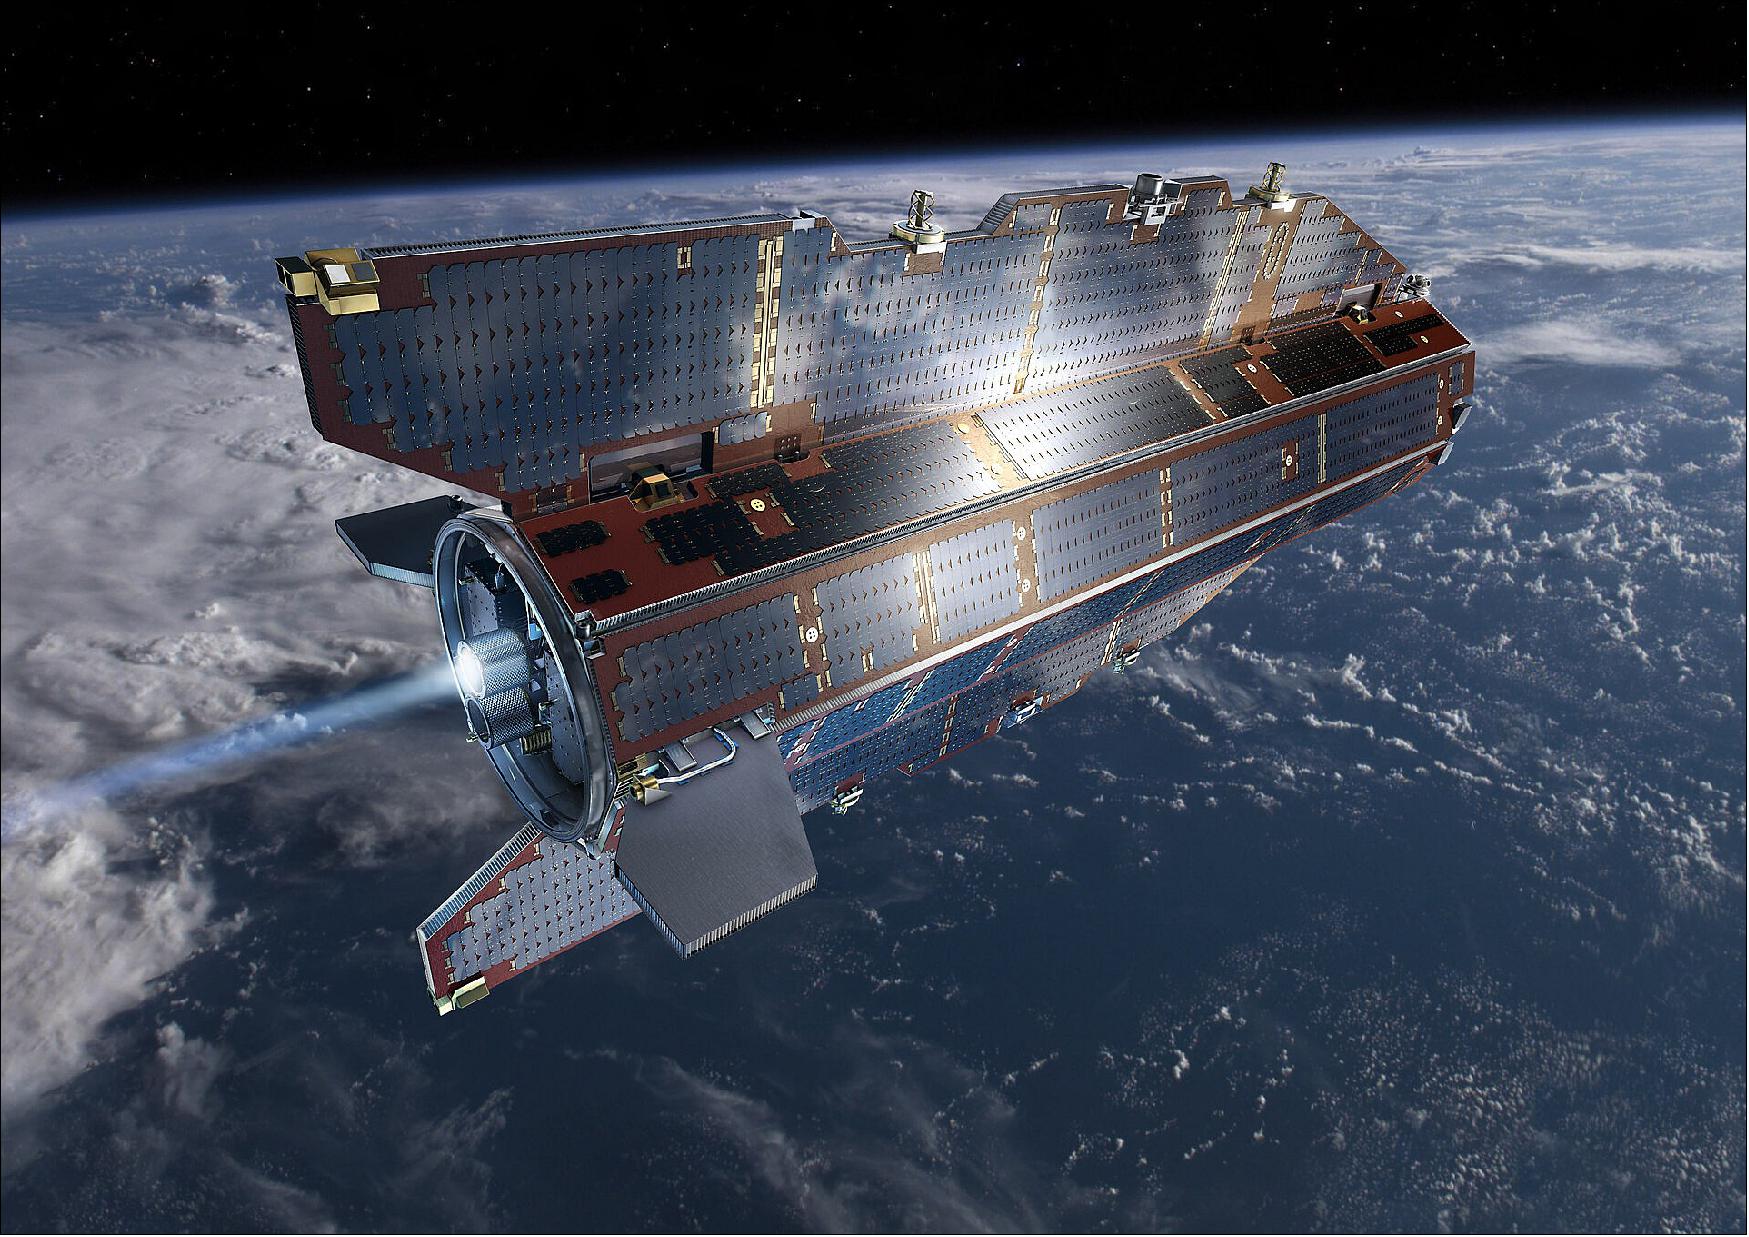
- This is one of the aims of ESA’s Science for Society 3D Earth project where an international group of geoscientists joined forces to develop a state-of-the art global model of the lithosphere, which is a term to describe Earth’s brittle crust, the top part of the upper mantle and the sub-lithospheric upper mantle down to 400 km depth. The model combines different satellite data, such as gravity data from ESA’s GOCE, with in-situ observations, primarily seismic tomography.
- In their model that shows differences in temperature, or the thermal structure, of Earth’s upper mantle, the researchers could see that these volcanoes would erupt at some point. Predicting exactly when this would happen is, however, more difficult.
- Javier Fullea, from Complutense University of Madrid, said, “Our WINTERC-G model, which uses in-situ tomographic and GOCE satellite gravity data, shows a branch of the Azores plume. It is visible from the surface down to a depth of 400 km, at the base of the upper mantle. The plume flows southeast towards Madeira and the Canary Islands surrounding the cold mantle beneath the north Atlantic’s African margin.
- “Across the globe, we see that the Hunga Tonga volcano is located in a back arc basin, created by the subduction of the Tonga slab. Back arc volcanoes are associated with the cold slab being melted by the mantle as the slab slides down into the mantle.”
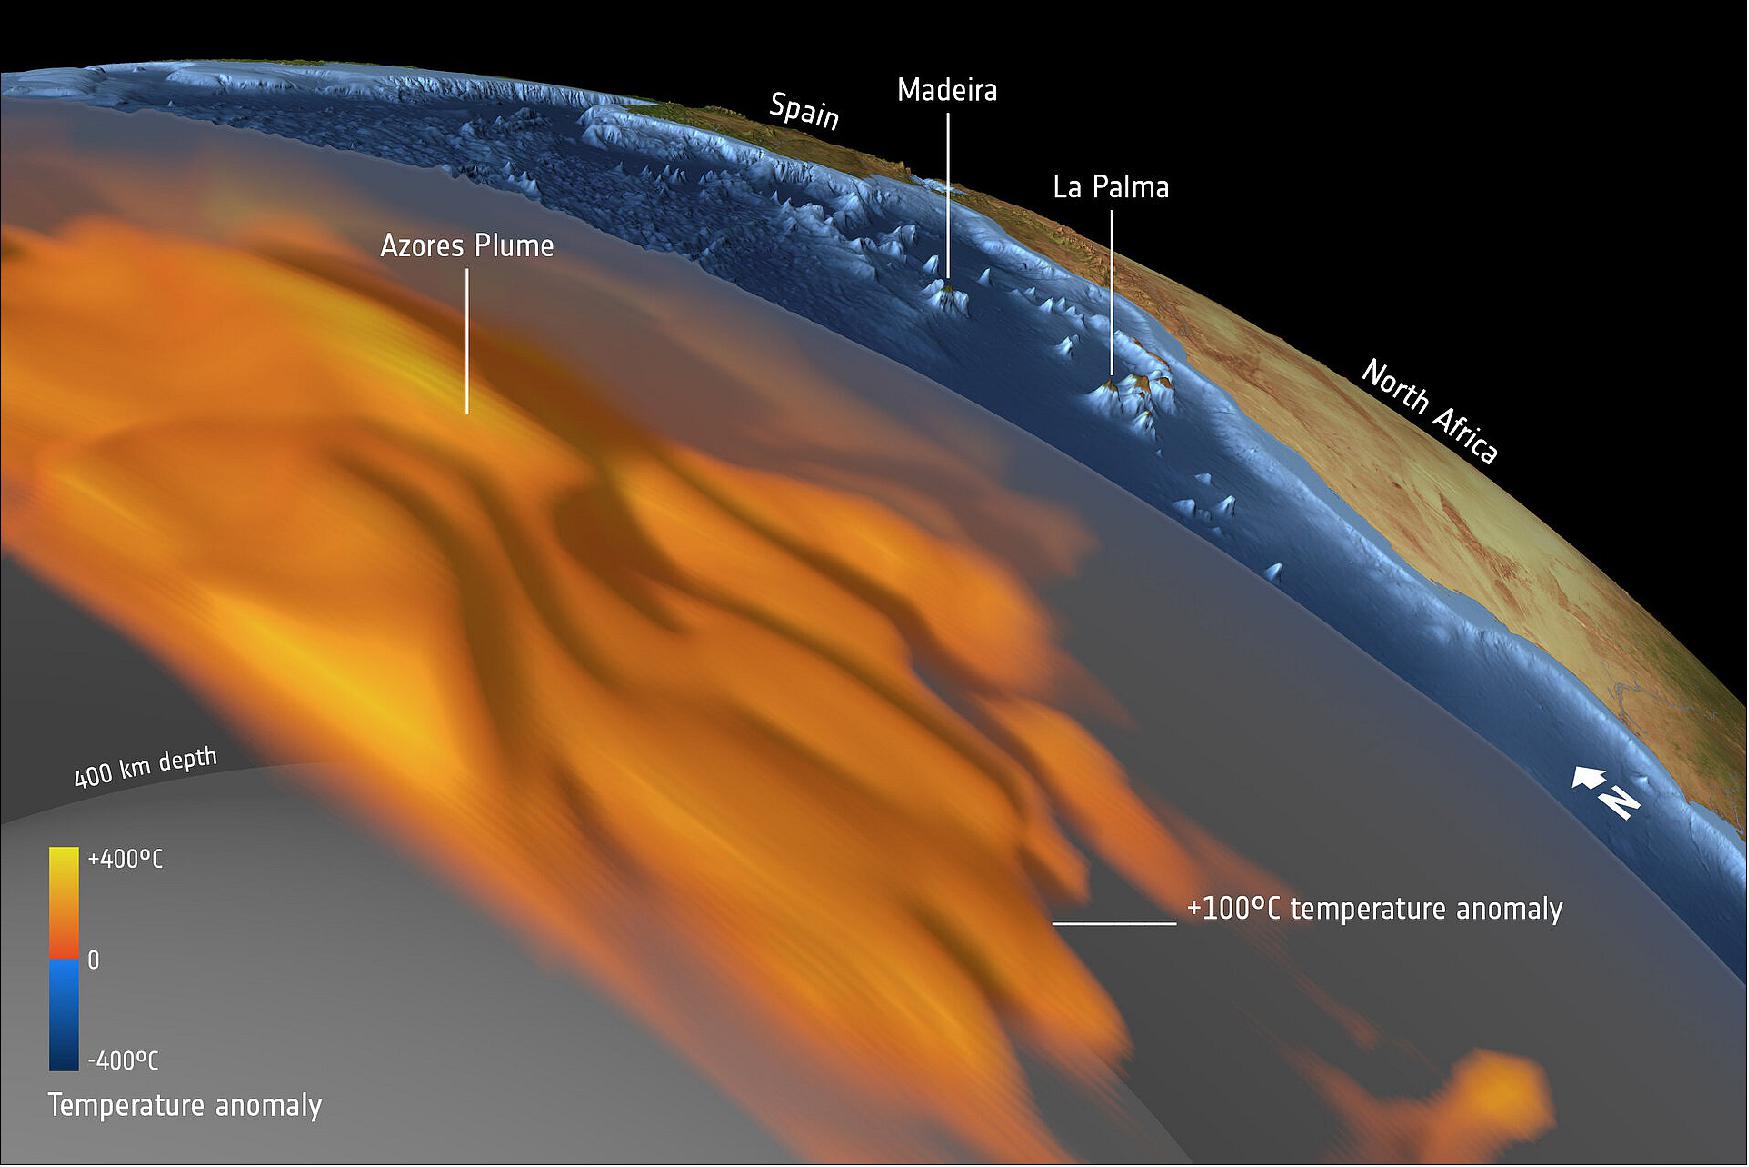
- Sergei Lebedev, from the University of Cambridge in the UK, adds, “From such models and seismic tomography, we see structures rising from great depth beneath the Canary Islands. These anomalies reflect hot material rising to the surface of Earth and are referred to as hotspots or plumes and are a constant source for the volcanos at the surface.
- “The origin of the Hunga Tonga-Hunga Ha‘apai volcano is different. It is a part of the Tonga–Kermadec arc, where the edge of the Pacific tectonic plate dives beneath the Australian Plate. Here, our imaging shows the layer of hydrated, partially molten rock above the plunging Pacific Plate, which feeds the volcanoes of the arc.”
- But where do these thermal anomalies come from?
- The answer lies even deeper, at a depth of around 2800 km, and is associated with structures at the core–mantle boundary: the Large-Low Seismic Velocity Provinces (LLSVPs). These prominent continent-sized structures appear to have a big impact on how the surface behaves.
- Clint Conrad, from Norway’s Centre for Earth Evolution Dynamics, said, “There is a link between the flow in the mantle, where convection cells drive plate tectonics, and major plume locations. The flow along the core–mantle boundary pushes plume material against the LLSVPs, forming the plumes. In models, this flow is driven by downwelling slabs that surround the two LLSVPs. The Canary Islands, for example, site above the edge of the African LLSVP.”
- However, the exact origin and build-up of the LLSVPs remains elusive. At the recent 4D Earth Science meeting alternative concepts and ideas were discussed using satellite data and seismological models, which will hopefully lead to more detailed studies of Earth interior in the near future.
- Bart Root from TU Delft, one of the organisers, summarises, “Clearly a multidisciplinary approach is needed, where different types of satellite data are combined with seismological data in a common way to address the exact structure of Earth’s deep interior.”
- ESA’s Diego Fernandez noted, “I’m happy to see that this ESA Science for Society project is yielding results that will further improve our understanding of the deep-lying sources of the events such as we’ve just seen in La Palma and Tonga.
- “It is worth noting that data from the GOCE satellite has been key to this research. GOCE, which mapped variations in Earth’s gravity field with extreme detail and precision, completed its mission in orbit back in 2013 – and scientists still rely on the data. This is another example of the benefits our satellite missions bring well beyond their life in orbit. ”
NASA detected the shockwave from the underwater eruption high up in the atmosphere.
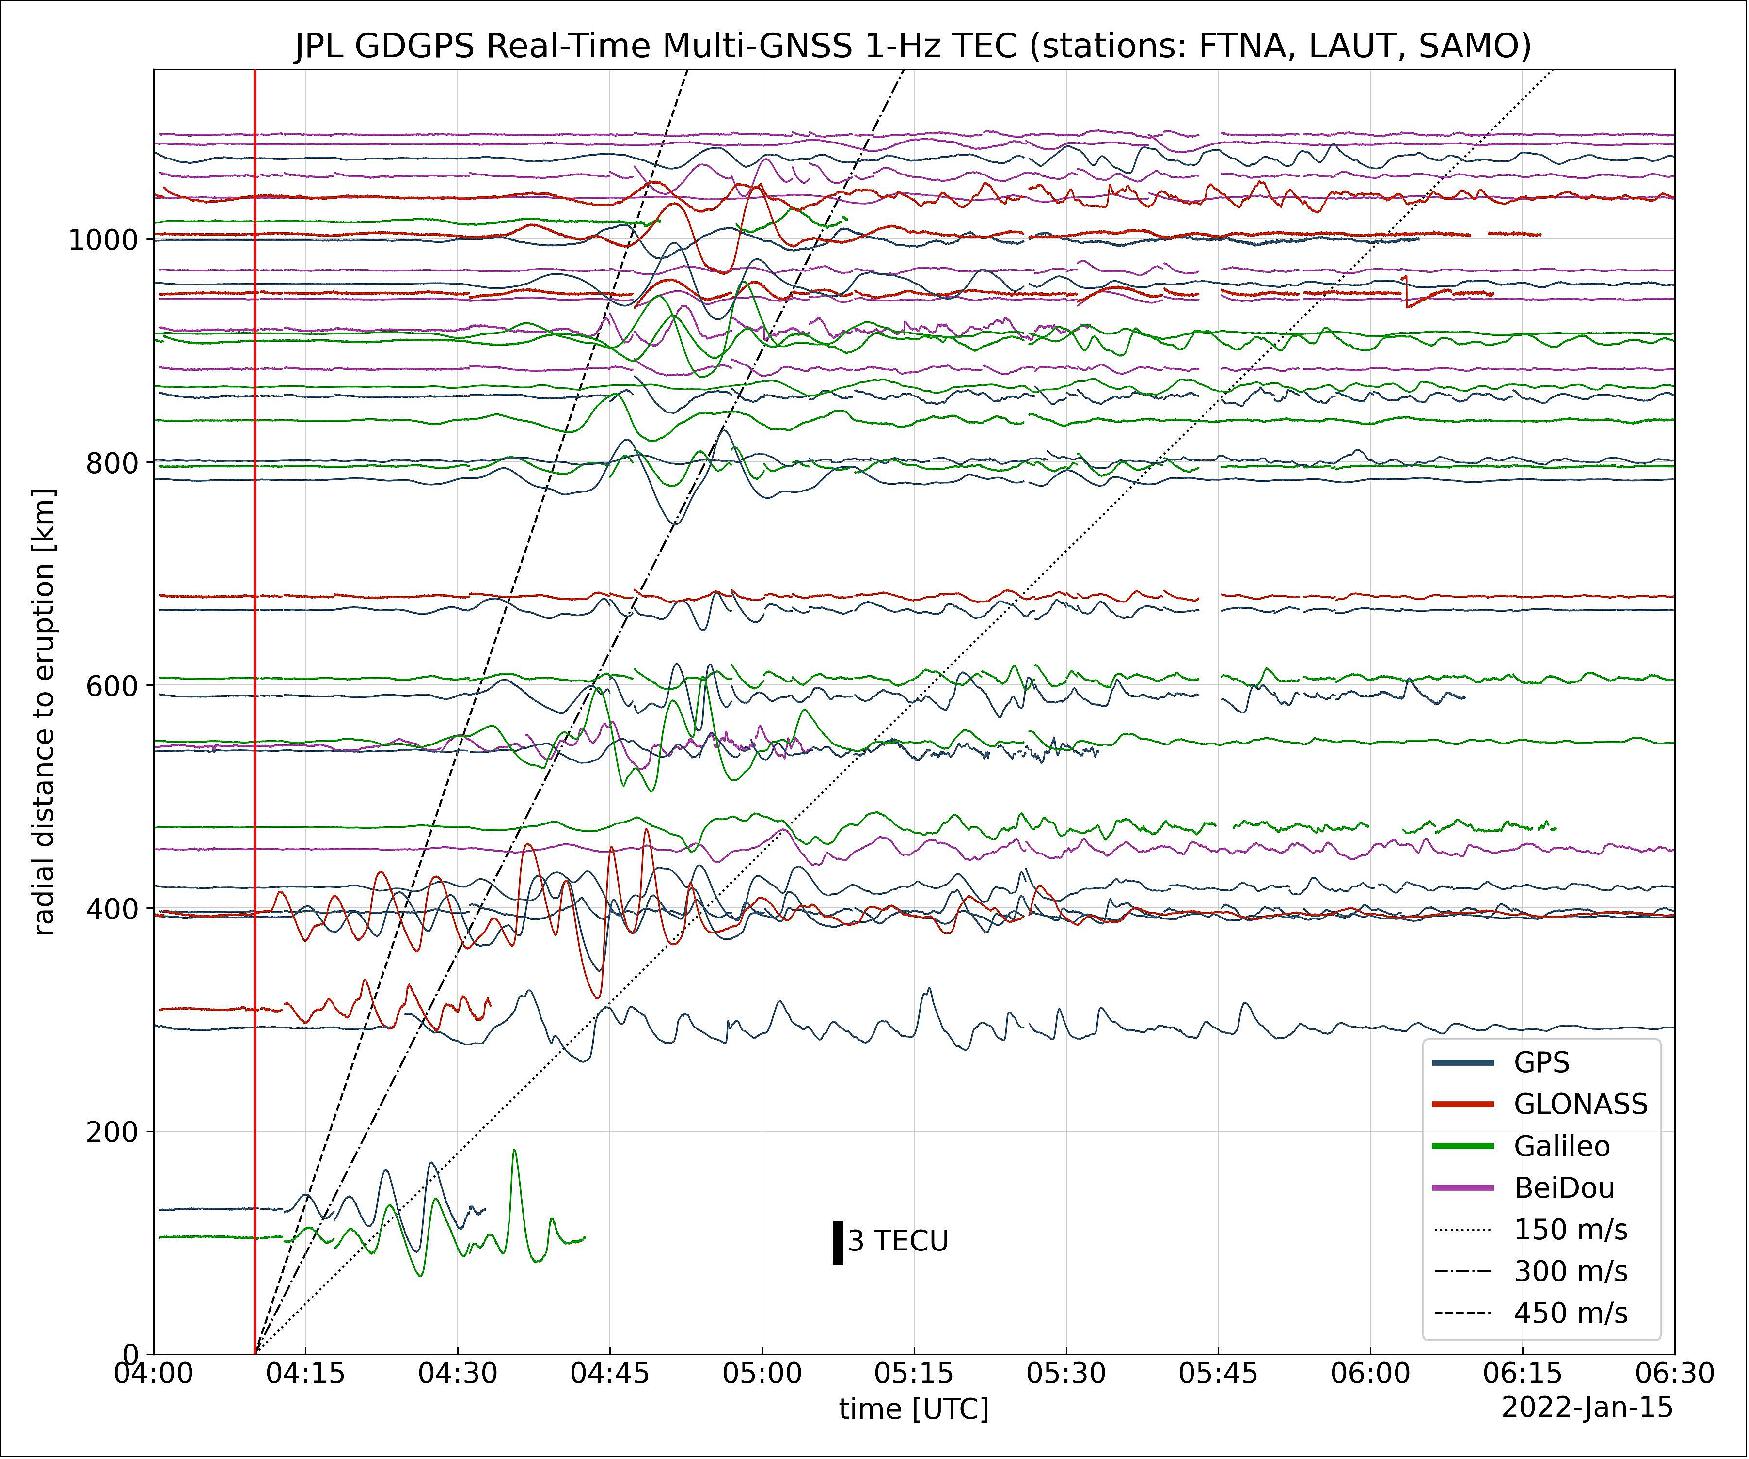
• February 4, 2022: The powerful underwater volcanic eruption that blanketed the island nation of Tonga with ash and sent tsunami waves across the world also caused ripples in Earth’s ionosphere, according to measurements from the Global Differential Global Positioning System (GDGPS) managed by NASA’s Jet Propulsion Laboratory in Southern California. 4)
- When the Hunga Tonga-Hunga Ha’apai volcano erupted on Jan. 15, 2022, it unleashed a violent explosion with the equivalent force of 4 to 18 megatons of TNT, according to estimates from NASA geologist Jim Garvin. This explosion produced an acoustic shockwave that was strong enough to perturb the ionosphere, the outer layer of the atmosphere that starts about 50 to 56 miles (80 to 90 kilometers) above Earth’s surface and contains electrons ionized by the Sun’s energy.
- The eruption also caused a tsunami, which was enhanced by the atmospheric pressure waves of the explosion – a phenomenon known as a meteotsunami. The deformation of the ocean’s surface from these large waves further disturbed the ionosphere. The GDGPS observed ionospheric disturbances caused by the explosion and subsequent meteotsunami in real time. The system monitors the density of electrons in the ionosphere (measured as total electron content units, or TECU) by tracking the delay of global navigation satellite systems (GNSS) signals as they travel through the atmosphere.
- GNSS data can serve an important role in contributing to tsunami early warning systems, shaving precious time off tsunami warnings when every second of advanced notice can save lives. The NASA Research Opportunities in Space and Earth Science (ROSES) A.37 project Local Tsunami Early Warning With GNSS Earthquake Source Products, funded by the Applied Sciences Disasters program area, is using this GNSS data to detect ground movement and model earthquake activity that could lead to tsunamis. The team is integrating this data into tsunami early warning systems operated by the National Oceanic and Atmospheric Administration’s Center for Tsunami Research (CTR).
- NASA’s Space Geodesy Project also supports tsunami risk reduction through collaborations with the International GNSS Service, which manages the GNSS-enhanced Tsunami Early Warning Systems (GTEWS), the International Association of Geodesy’s Global Geodetic Observing System (GGOS), and the Group on Earth Observations (GEO) Geodesy for the Sendai Framework Community Activity.
- In the future, the ionospheric disturbance recorded by the GDGPS could also be integrated into these tsunami warning systems, increasing their effectiveness to warn communities and get people out of harm’s way before tsunami waves strike.
1) ”Dramatic Changes at Hunga Tonga-Hunga Ha‘apai,” NASA Earth Observatory, Image of the Day for 24 January 2022, URL: https://earthobservatory.nasa.gov/images
/149367/dramatic-changes-at-hunga-tonga-hunga-haapai
2) J. B. Garvin, D. A. Slayback, V. Ferrini, J. Frawley, C. Giguere, G. R. Asrar, K. Andersen, ”Monitoring and Modeling the Rapid Evolution of Earth's Newest Volcanic Island: Hunga Tonga Hunga Ha'apai (Tonga) Using High Spatial Resolution Satellite Observations,” Geographical Research Letters, Volume 45, Issue 8, 28 April 2018, pp: 3445-3452, Fisrt published: 11 March 2018, https://doi.org/10.1002/2017GL076621, URL: https://agupubs.onlinelibrary.wiley.com/doi/epdf/10.1002/2017GL076621
3) ”Deep down temperature shifts give rise to eruptions,” ESA Applications, 15 February 2022, URL: https://www.esa.int/Applications/Observing_the_Earth/
FutureEO/GOCE/Deep_down_temperature_shifts_give_rise_to_eruptions
4) ”Tonga Eruption Sent Ripples Through Earth’s Ionosphere,” NASA/JPL News, 4 February 2022, URL: https://www.jpl.nasa.gov/news/tonga-eruption-sent-ripples-through-earths-ionosphere
The information compiled and edited in this article was provided by Herbert J. Kramer from his documentation of: ”Observation of the Earth and Its Environment: Survey of Missions and Sensors” (Springer Verlag) as well as many other sources after the publication of the 4th edition in 2002. - Comments and corrections to this article are always welcome for further updates (herb.kramer@gmx.net).